文章目录
- 一、介绍
- 二、安装Prometheus
- 三、安装Grafana
- 四、Pronetheus和Grafana相关联
- 五、监控服务器状态
- 六、常见问题
一、介绍
Prometheus是一个开源的系统监控和报警系统,现在已经加入到CNCF基金会,成为继k8s之后第二个在CNCF托管的项目,在kubernetes容器管理系统中,通常会搭配prometheus进行监控,同时也支持多种exporter采集数据,还支持pushgateway进行数据上报,Prometheus性能足够支撑上万台规模的集群。
Prometheus优点:
- 通过PromQL实现多维度数据模型的灵活查询。
- 定义了开放指标数据的标准,自定义探针(如Exporter等),编写简单方便。
- PushGateway组件让这款监控系统可以接收监控数据。
Grafana是一个开源的可视化系统,使用Grafana展示页面更美观。
二、安装Prometheus
1、时间和时区同步
对于监控系统而言,时间不同步会严重导致采集数据失败,或采集数据不准确!
# 时区同步
timedatectl set-timezone Asia/Shanghai# 时间同步
yum -y install ntpdate
/usr/sbin/ntpdate -u ntp1.aliyun.com
2、针对时间做定时同步
# 每天凌晨5点进行时间同步
echo "0 5 * * * /usr/sbin/ntpdate -u ntp1.aliyun.com >/dev/null &" >> /var/spool/cron/root# 查看定时任务
crontab -l
3、安装Prometheus
prometheus官方下载地址:
wget https://github.com/prometheus/prometheus/releases/download/v2.42.0/prometheus-2.42.0.linux-amd64.tar.gztar zxf prometheus-2.42.0.linux-amd64.tar.gz
mv prometheus-2.42.0.linux-amd64 /usr/local/prometheus
cd /usr/local/prometheus/# 修改配置监控自己的19090端口
sed -i  s/localhost:9090/localhost:19090/g prometheus.yml # 启动监听端口为19090,不加默认9090
./prometheus --config.file=prometheus.yml --web.listen-address=:19090
PS:上面命令指示测试是否可以启动,如果可以启动 ^C 停止掉即可!下面配置systemd管理
4、添加systemd管理
cat > /usr/lib/systemd/system/prometheus.service << EOF
[Unit][Service]
ExecStart=/usr/local/prometheus/prometheus --config.file=/usr/local/prometheus/prometheus.yml --web.listen-address=:19090
ExecReload=/bin/kill -HUP \$MAINPID[Install]
WantedBy=multi-user.target
Alias=dbus-org.fedoraproject.FirewallD1.service
EOF
启动并加入开机自启动
systemctl start prometheus.service
systemctl enable prometheus.service
5、WEB页面验证
浏览器访问 IP:19090
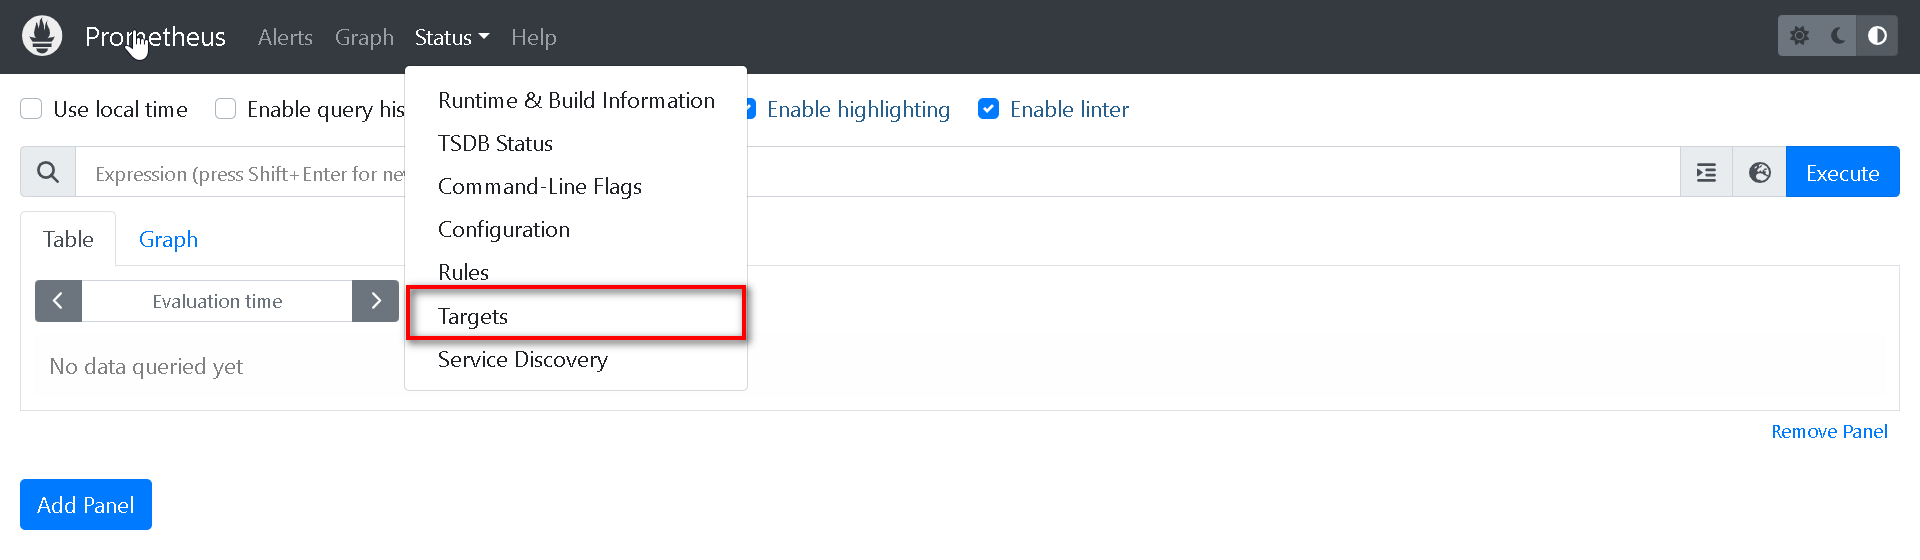

如上图所示:监控自己状态为UP表示至此步骤无误!
三、安装Grafana
1、安装Grafana
Grafana官方下载地址
wget https://dl.grafana.com/enterprise/release/grafana-enterprise-9.4.1-1.x86_64.rpm
sudo yum install grafana-enterprise-9.4.1-1.x86_64.rpm -ysystemctl enable grafana-server.service --now
2、WEB页面验证
浏览器访问 IP:3000
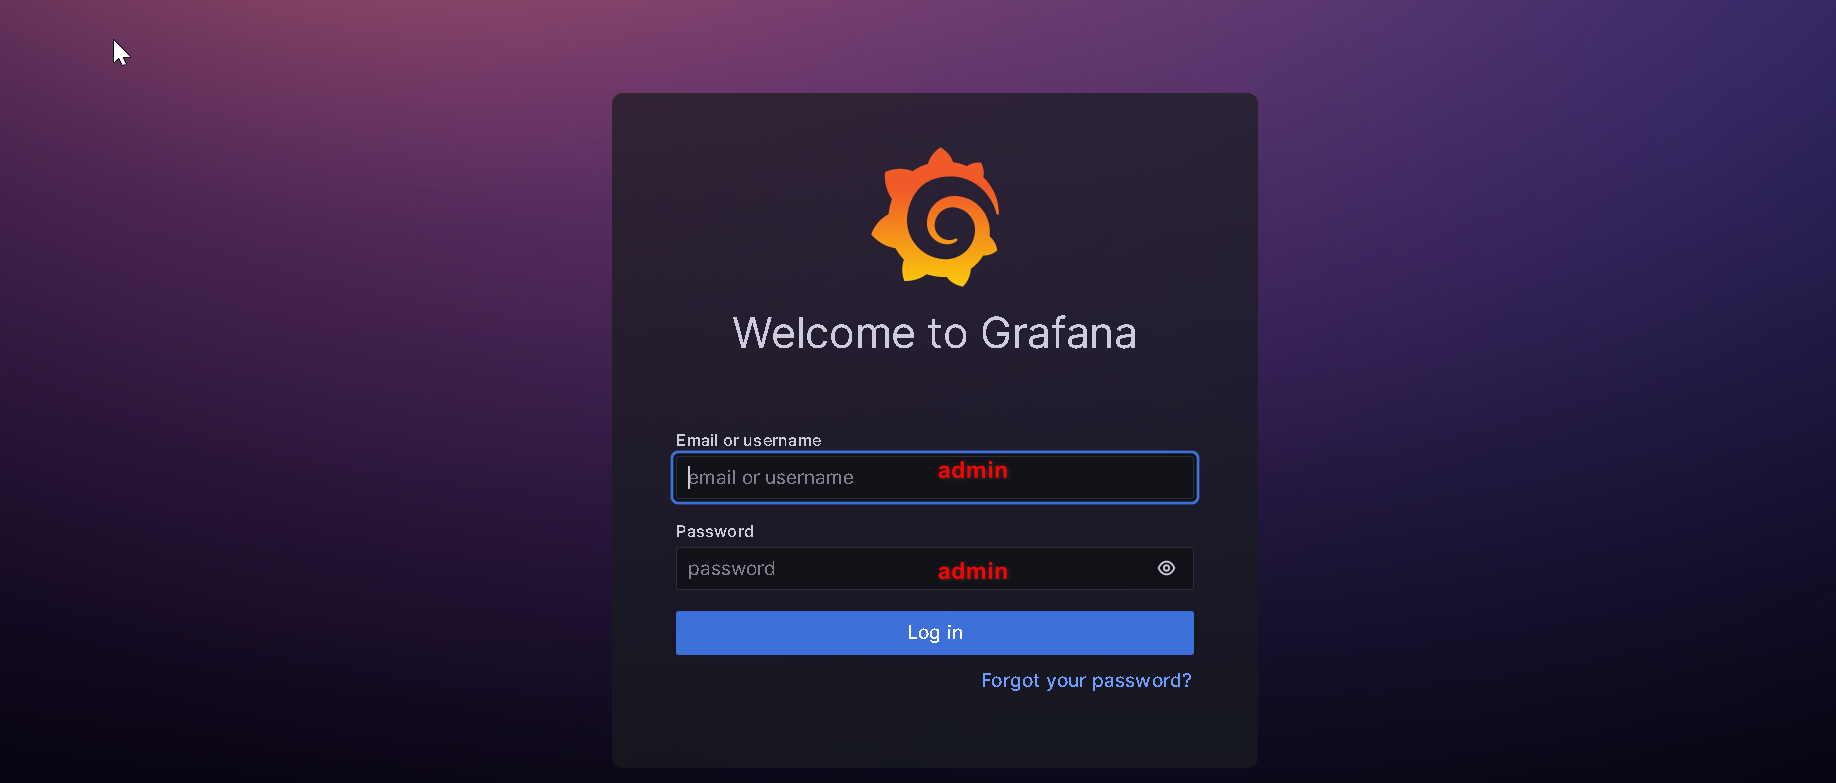
第一次需要更改密码,正常操作即可。
四、Pronetheus和Grafana相关联
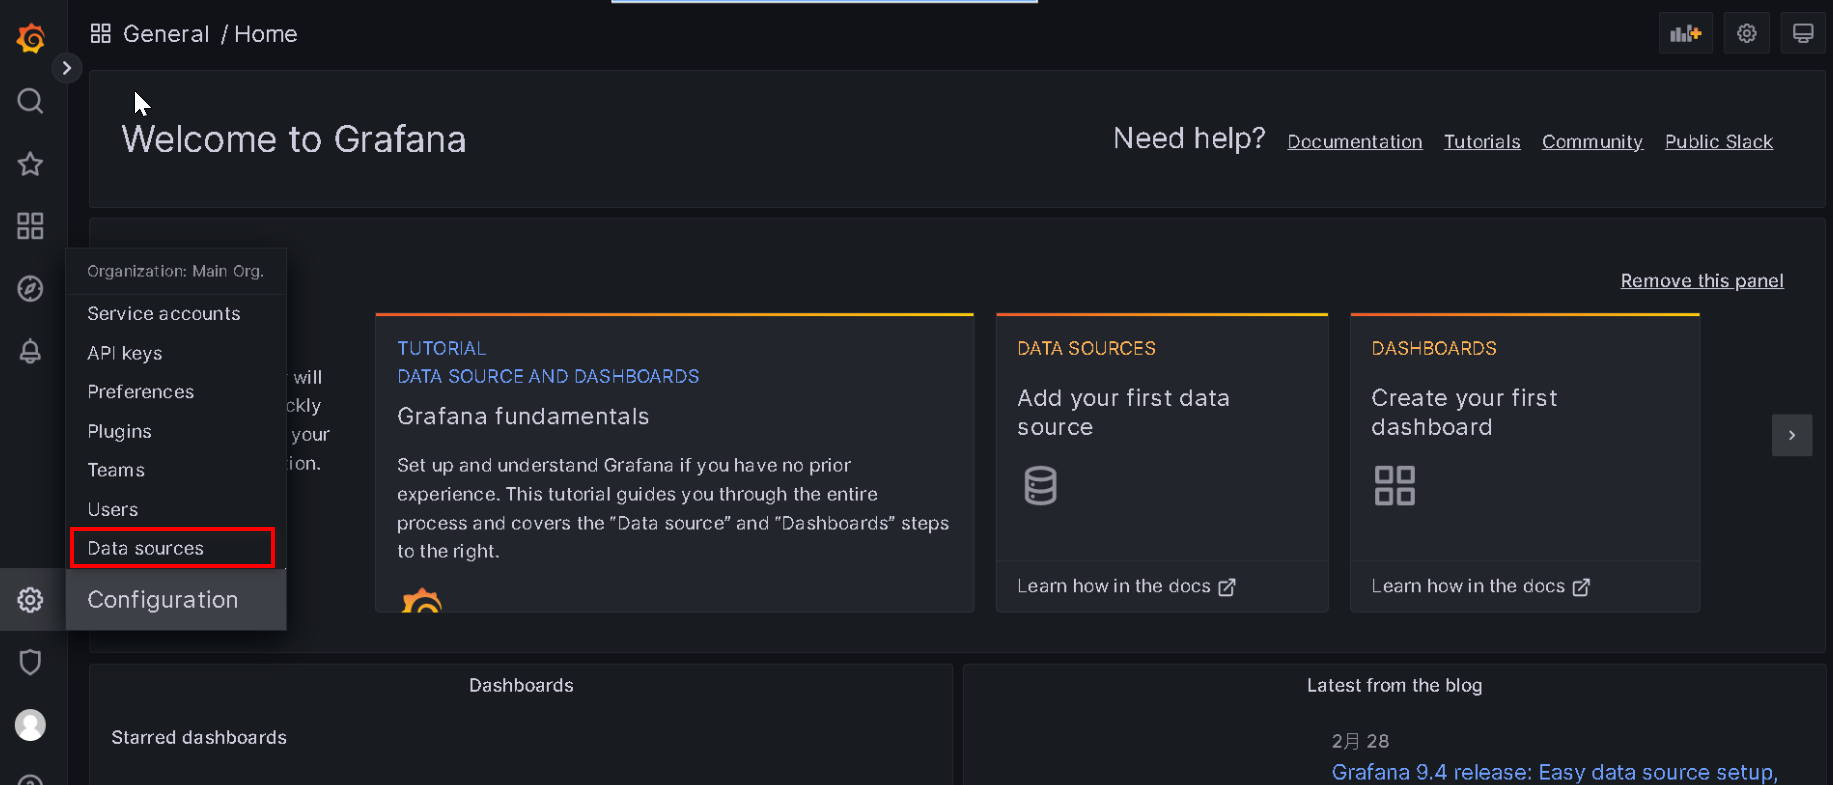
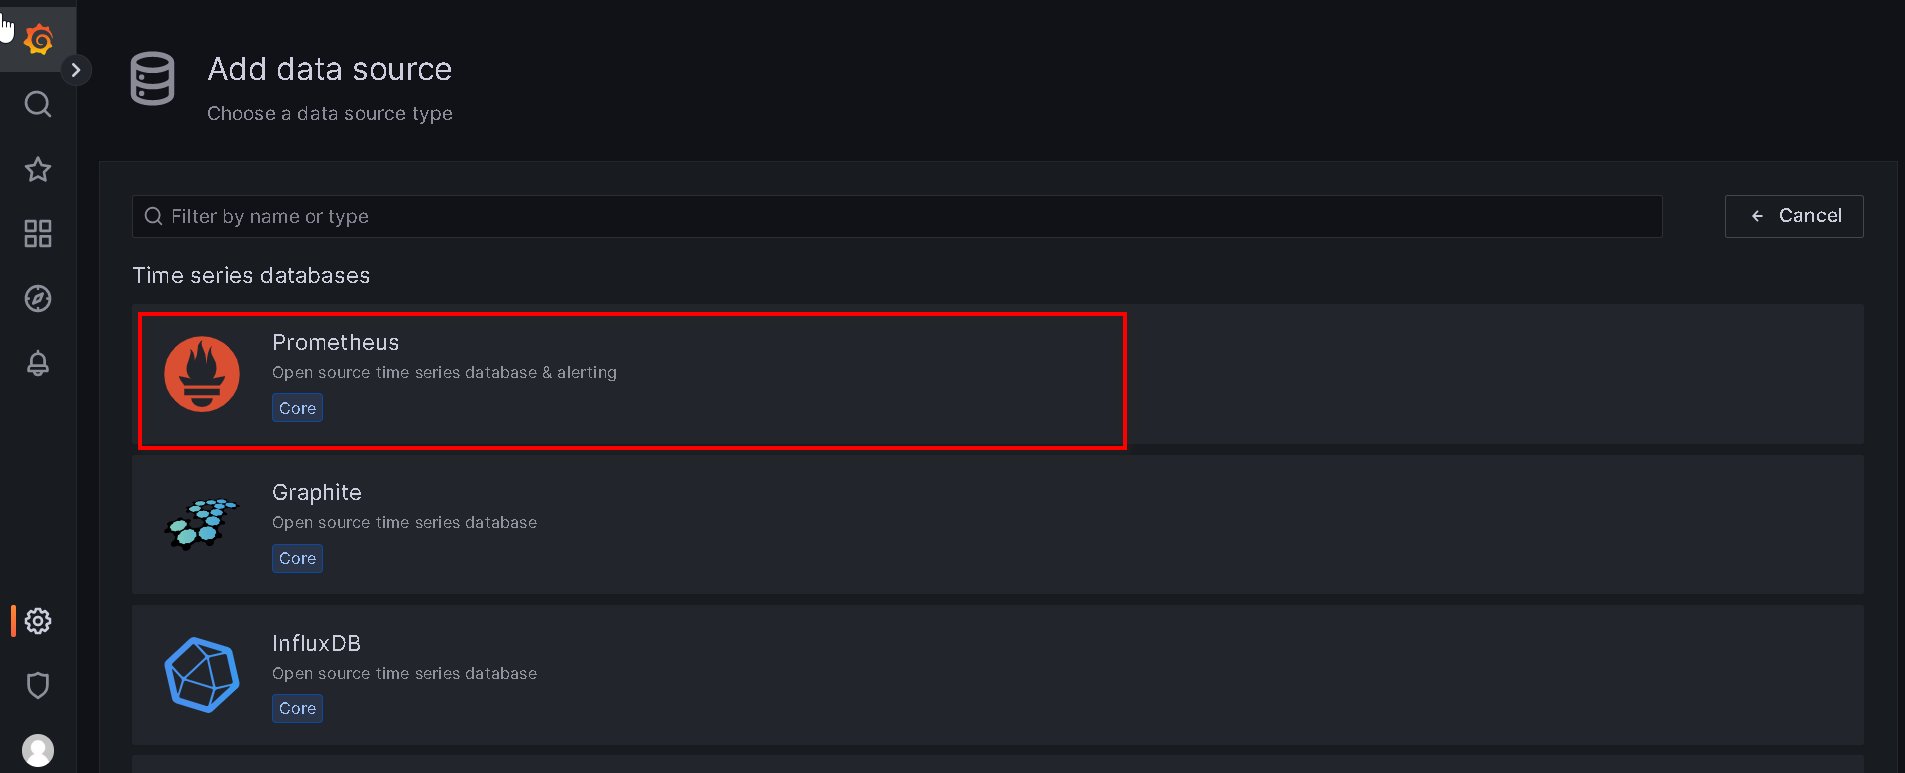
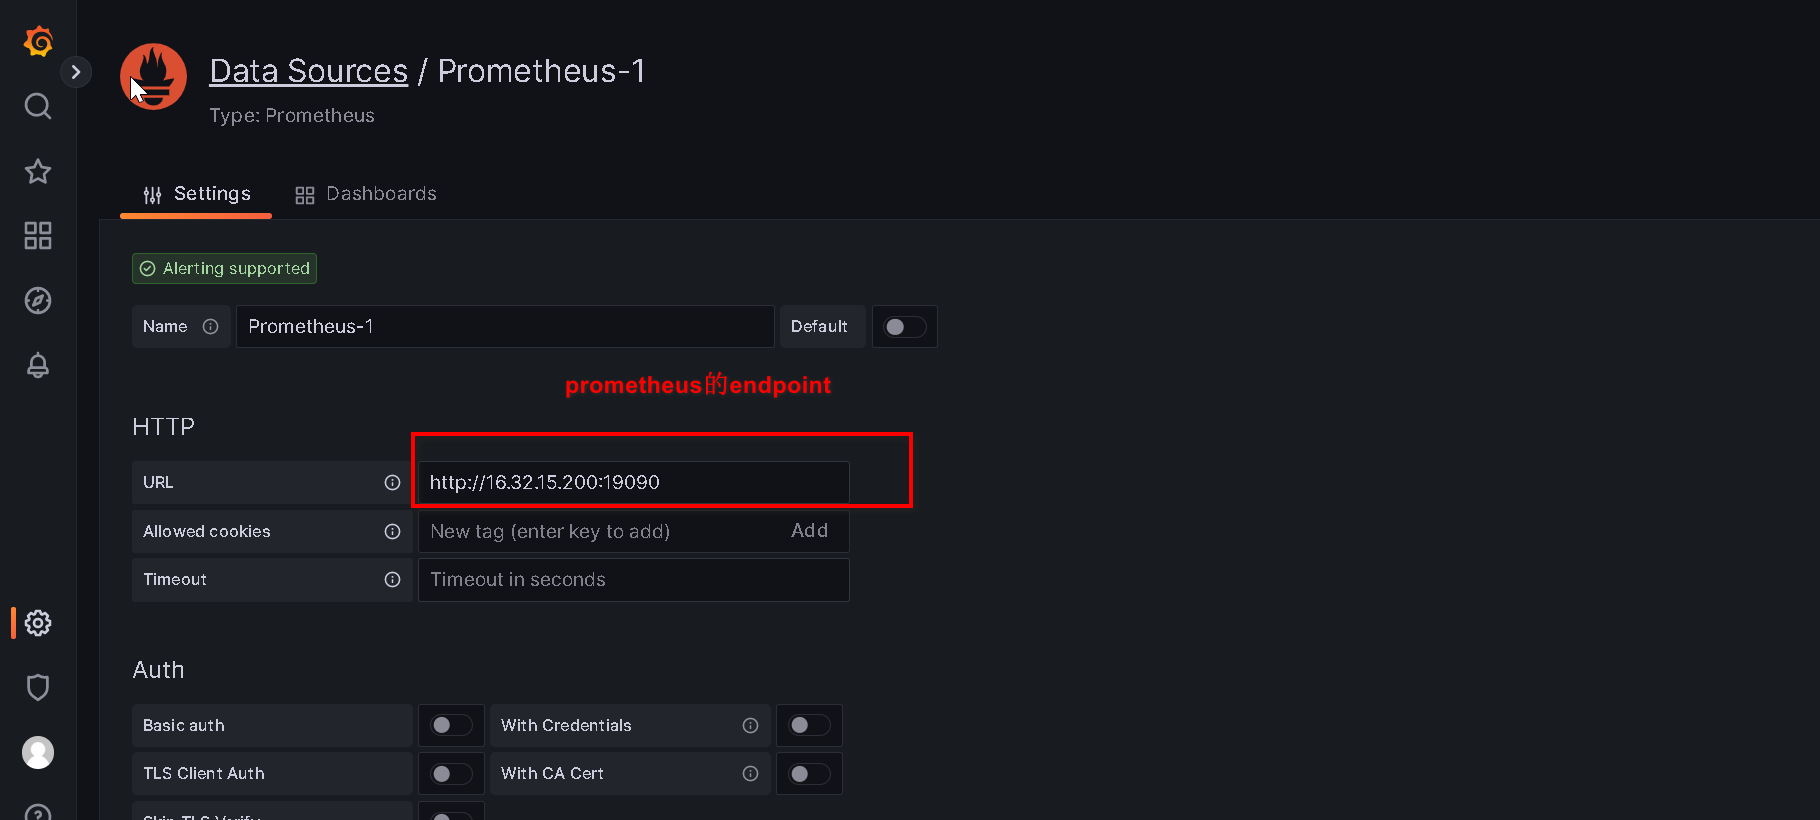
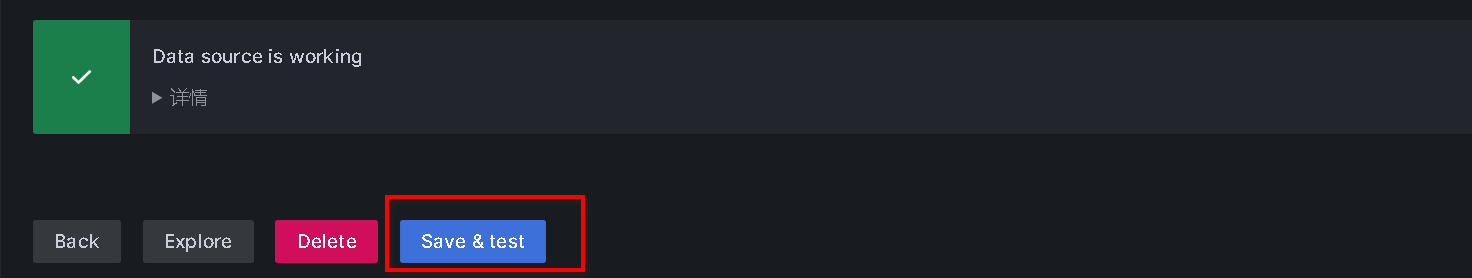
划到末端 点击"Save & test"
五、监控服务器状态
1、node_exporter组件安装
node_exporter是Prometheus指标收集组件,和传统的指标数据收集组件不同的是,它只负责收集数据,并不向Server端发送数据,而是等待Prometheus Server 主动抓取。
wget https://github.com/prometheus/node_exporter/releases/download/v1.5.0/node_exporter-1.5.0.linux-amd64.tar.gz
tar zxf node_exporter-1.5.0.linux-amd64.tar.gz
mv node_exporter-1.5.0.linux-amd64 /usr/local/prometheus/node_exporter
cd /usr/local/prometheus/node_exporter/./node_exporter
2、配置systemd管理node_exporter
cat > /usr/lib/systemd/system/node_exporter.service << EOF
[Unit][Service]
ExecStart=/usr/local/prometheus/node_exporter/node_exporter
ExecReload=/bin/kill -HUP \$MAINPID[Install]
WantedBy=multi-user.target
Alias=dbus-org.fedoraproject.FirewallD1.service
EOF
启动并加入开机自启动
systemctl start node_exporter.service
systemctl enable node_exporter.service
默认监听9100端口
netstat -anput |grep 9100
tcp6       0      0 :::9100                 :::*                    LISTEN      3372/./node_exporte
2、Prometheus添加监控主机配置
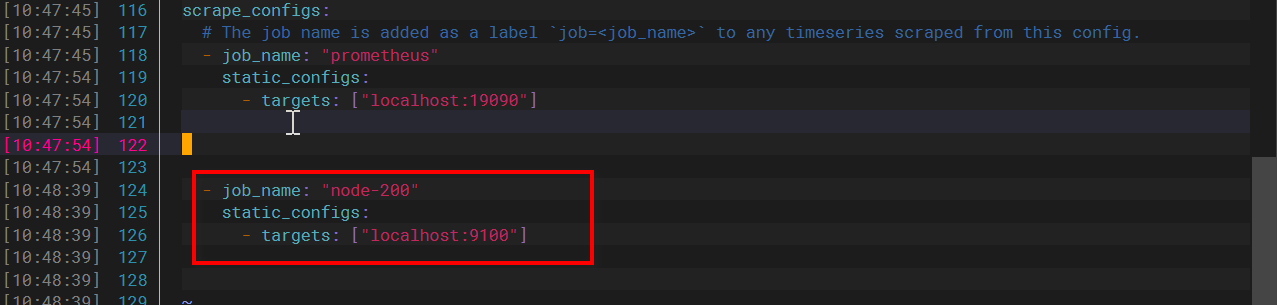
vim /usr/local/prometheus/prometheus.yml
# 末尾添加一下配置,注意缩进要遵守yml格式- job_name: "node-200"static_configs:- targets: ["localhost:9100"]
重启Prometheus
systemctl restart prometheus.service
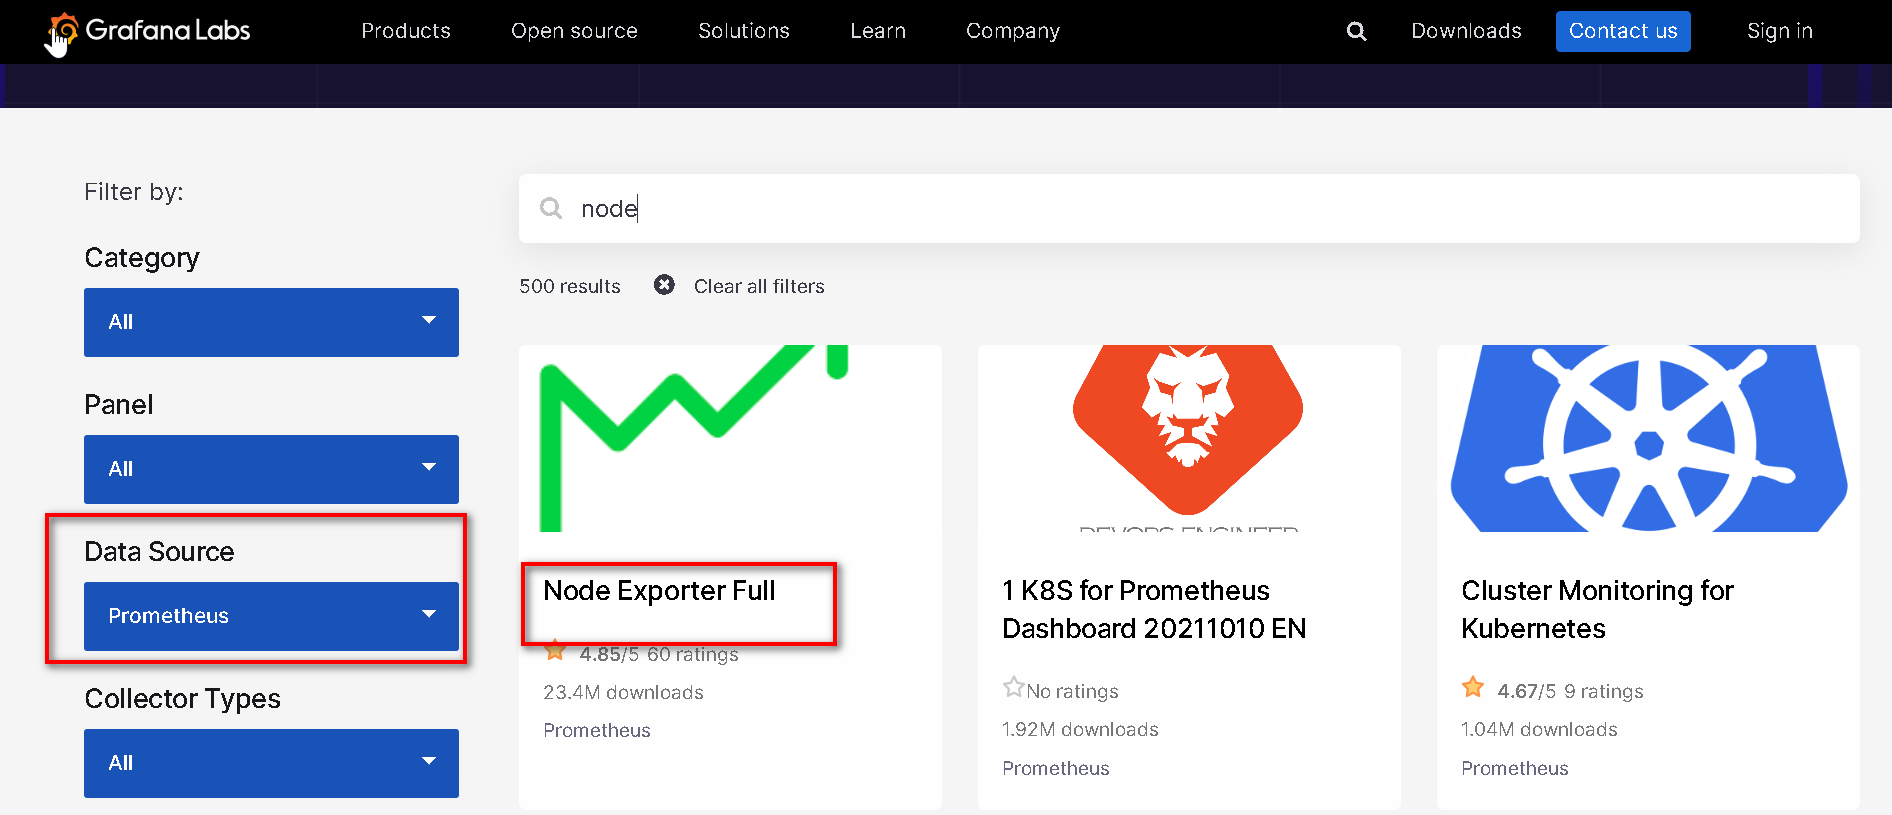
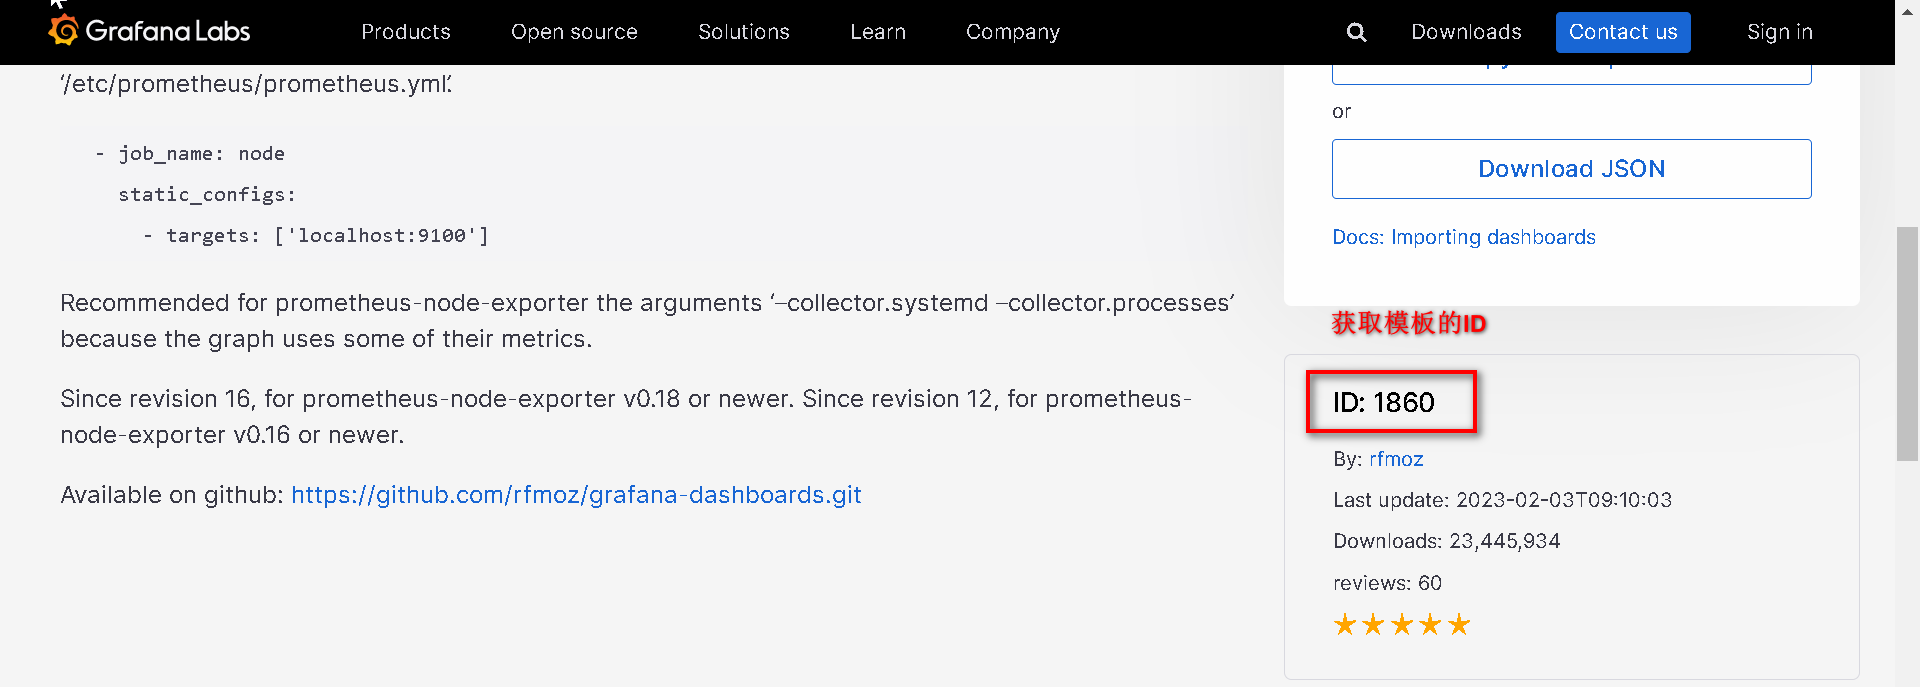
3、导入Node监控模板
模板地址:
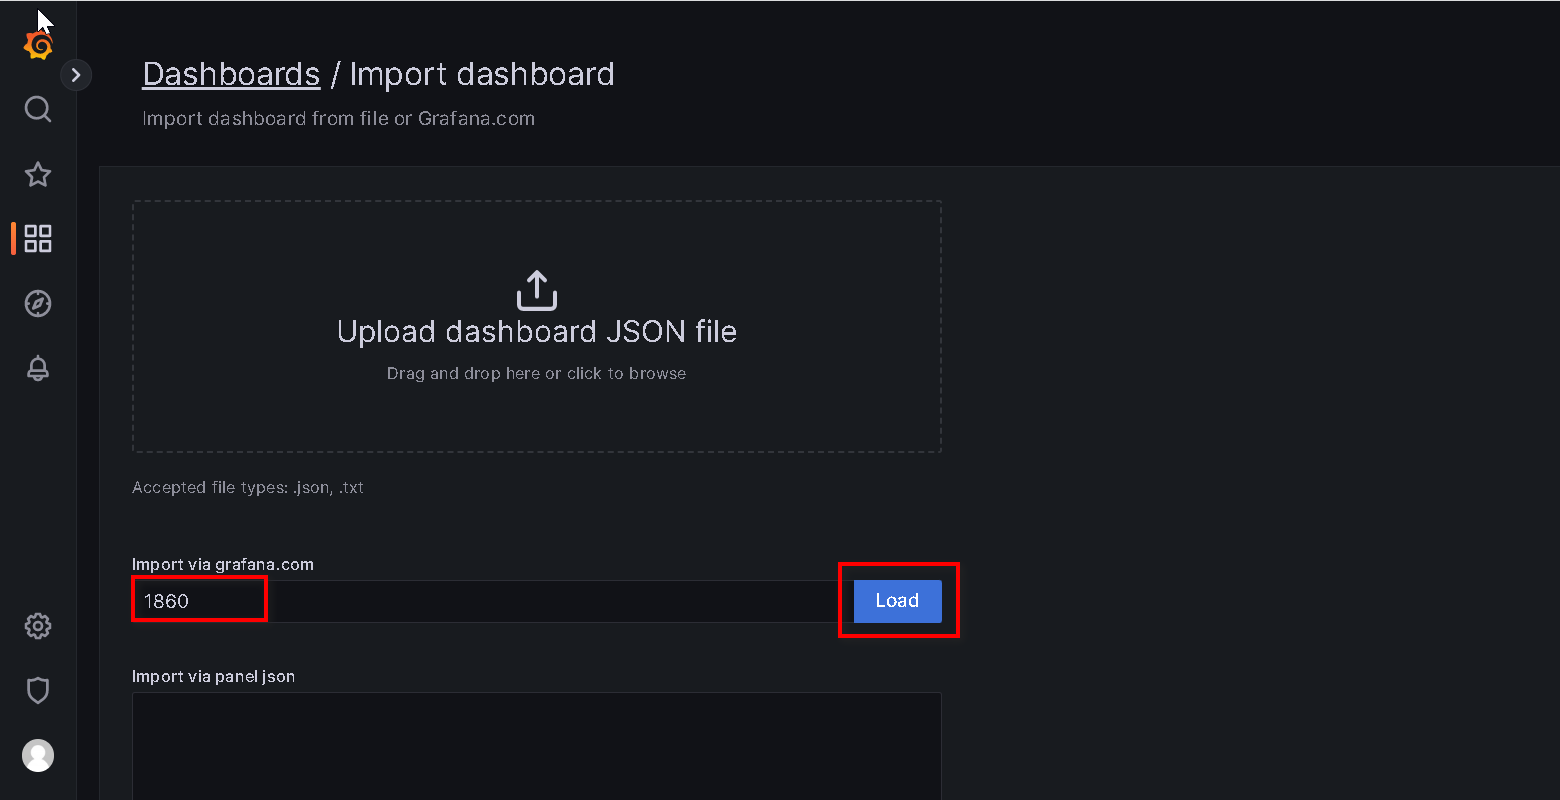
打开Grafana平台进行如下配置:

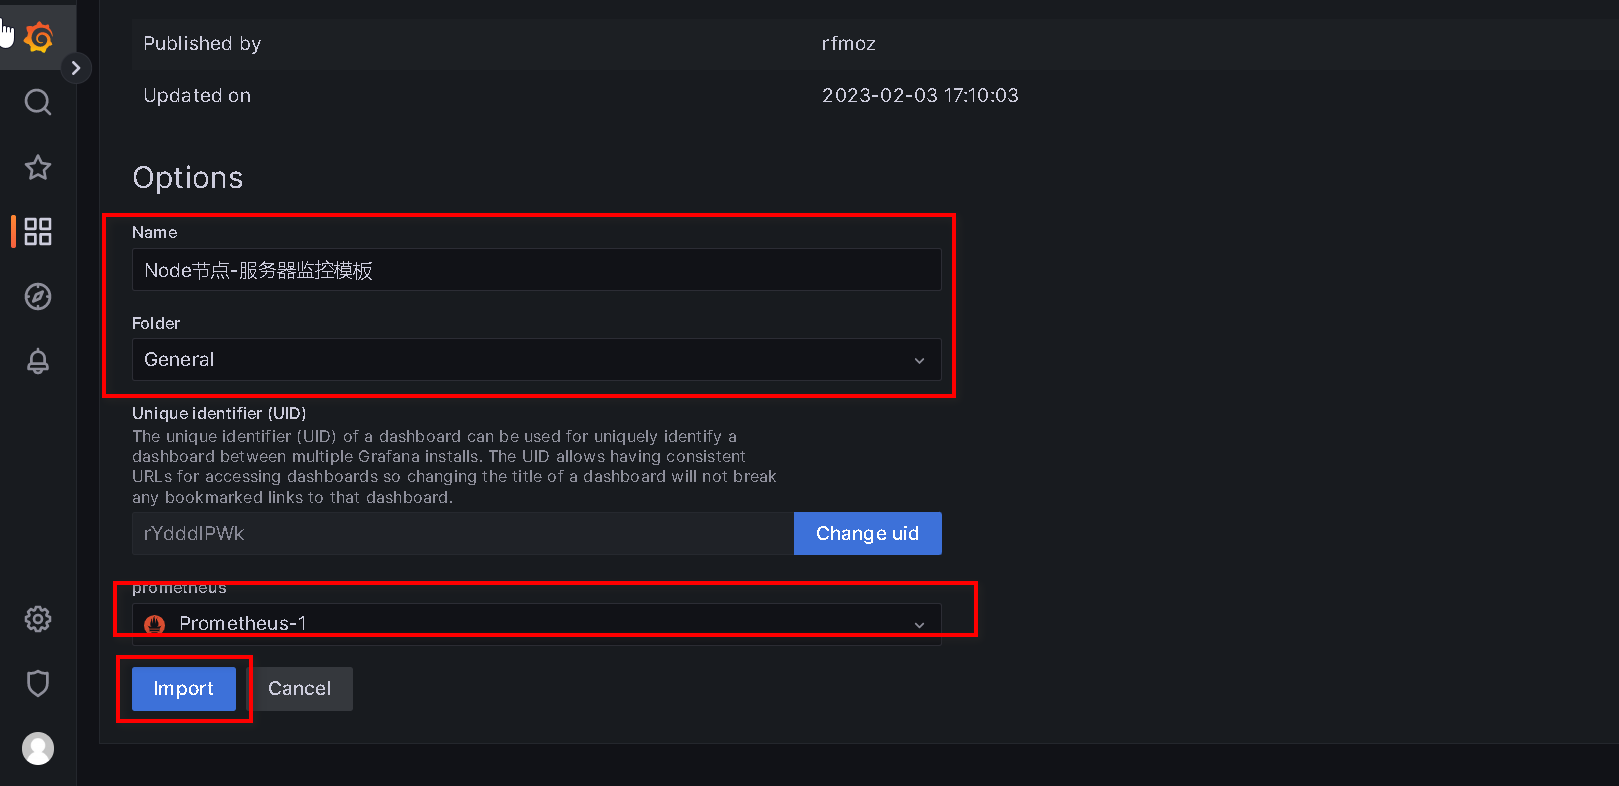
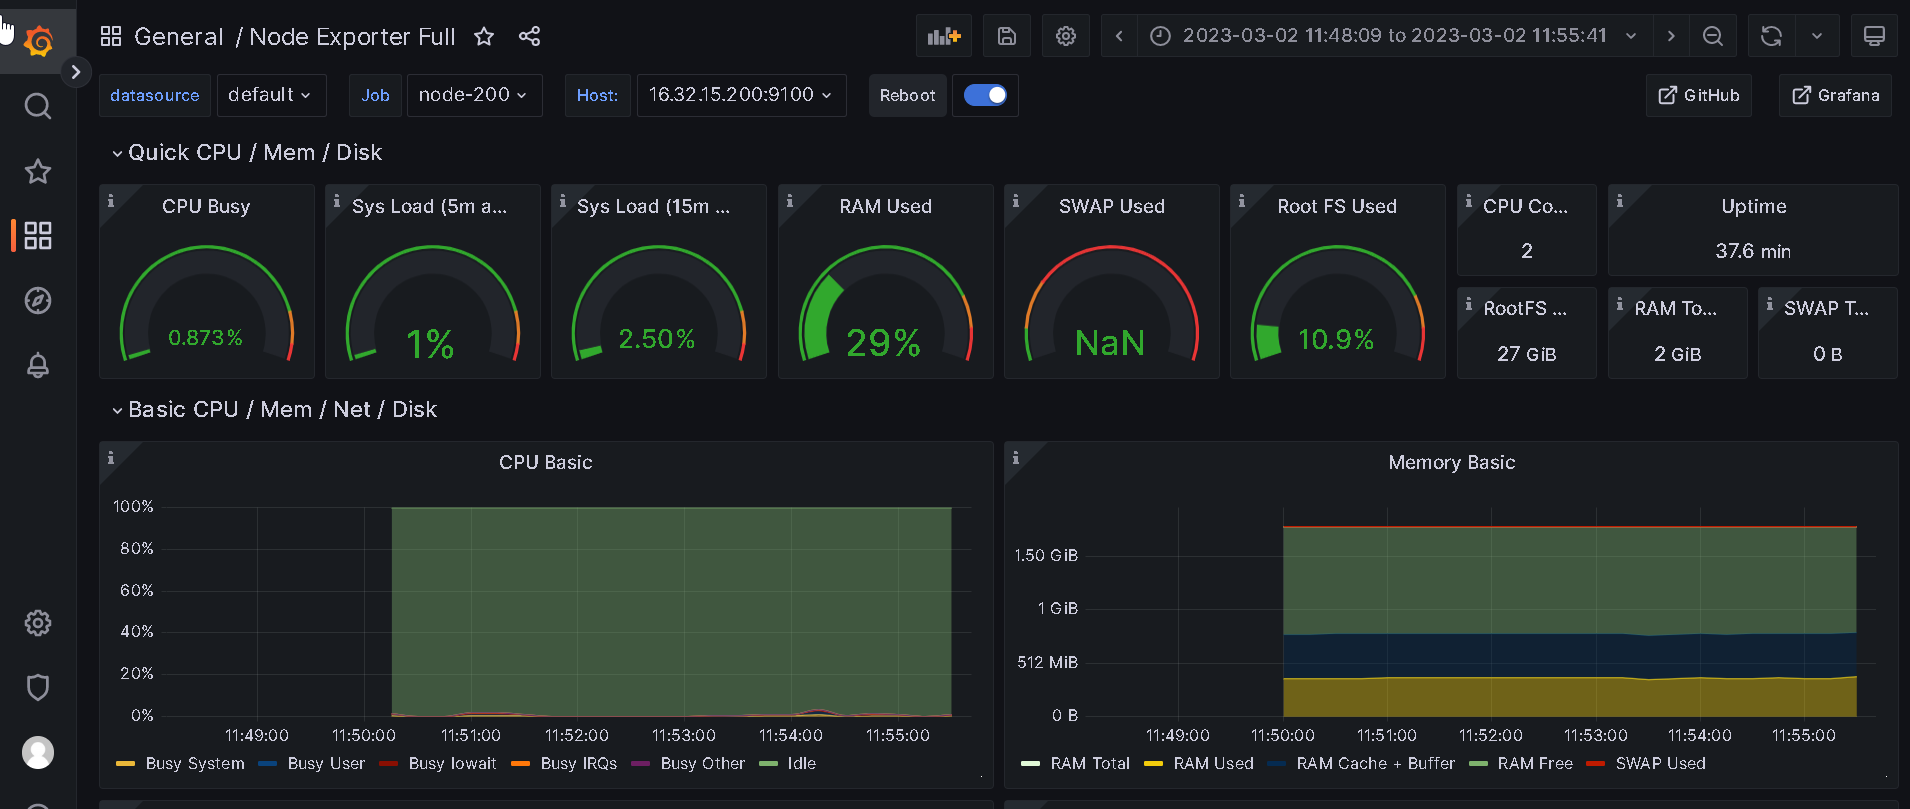
最终效果如下:
六、常见问题
1、重启prometheus报 Error on ingesting samples that are too old or are too far into the future 问题解决
# 清空Prometheus data目录之后重启
mv data data_bak
mkdir data
systemctl restart prometheus.service