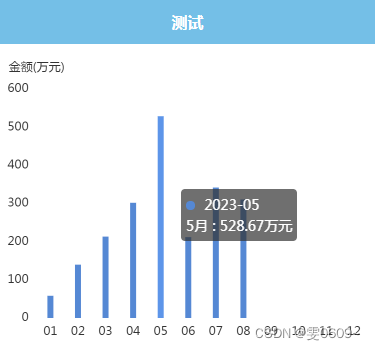
效果
代码
<template><view @click="echarts.onClick" :prop="option" :change:prop="echarts.updateEcharts" id="echarts" class="echarts"></view>
</template><script>export default {data() {return {option: '',}},mounted() {this.getData(); // 在组件挂载后调用获取数据的方法},methods: {getData() {uni.request({url: getApp().globalData.position + 'Other/select_sale_ekanbaninfo',data: {},header: {"Content-Type": "application/x-www-form-urlencoded"},method: 'POST',dataType: 'json',success: res => {//月统计var monthinfo = res.data.month_info;this.monthinfo = monthinfo;//显示图表this.echart();},fail(res) {console.log("查询失败")}});},echart() {//月统计// 提取日期和对应的值var dates1 = this.monthinfo.date;var values1 = this.monthinfo.total_amount;var months1 = ["01", "02", "03", "04", "05", "06", "07", "08", "09", "10", "11", "12"];var months1_chinese = ["1月", "2月", "3月", "4月", "5月", "6月", "7月", "8月", "9月", "10月", "11月", "12月"];this.option = {//配置网格组件,用于定义图表的位置和大小grid: {top: '15%', // 增加top的值来创建间距left: '2%',right: '2%',bottom: '2%', // 增加bottom的值来创建间距containLabel: true, //自动计算并包含坐标轴标签、刻度和标题等内容在内。},color: ['#5588d4'],tooltip: {trigger: 'item',axisPointer: {type: 'line'},formatter: function(params) {var value = values1[params.dataIndex];var date = dates1[params.dataIndex];var month = months1_chinese[params.dataIndex];var marker = params.marker; // 添加marker(小圆点)return marker + ' ' + date + '<br/>' + month + ' : ' + value + '万元';}},xAxis: {// name: '日期',data: months1,axisLine: {show: false // 隐藏纵坐标轴的横线},//隐藏小刻度短线axisTick: { // x轴刻度相关配置show: false, // 是否显示x轴刻度线},nameTextStyle: {fontSize: 12 // 设置横轴名称字体大小为12}},yAxis: {name: '金额(万元)',splitLine: {show: false // 隐藏纵坐标轴的背景横线},axisLine: {show: false // 隐藏纵坐标轴的竖线},//隐藏小刻度短线axisTick: { // x轴刻度相关配置show: false, // 是否显示x轴刻度线},axisLabel: {fontSize: 12 // 设置横轴标签字体大小为12},nameTextStyle: {fontSize: 12 // 设置横轴名称字体大小为12}},series: [{barWidth: '6',name: '销量',type: 'bar',data: values1,itemStyle: {show: true,position: 'top',textStyle: {// color: '#515dc3',fontSize: 12}}}]}}}}
</script>
<!-- 指定脚本类型模块为echarts,语言为renderjs -->
<script module="echarts" lang="renderjs">let myChartexport default {mounted() {// 首先判断window.echarts是否存在,如果存在则调用initEcharts方法进行初始化。if (typeof window.echarts === 'function') {this.initEcharts()} else {// 如果不存在,则动态创建一个<script>标签,并设置其src属性为static/js/echarts.js,然后在加载完成后调用initEcharts方法。// 动态引入较大类库避免影响页面展示const script = document.createElement('script')script.src = 'static/js/echarts.js'script.onload = this.initEcharts.bind(this)document.head.appendChild(script)}},methods: {initEcharts() {//echarts.init函数创建一个新的ECharts实例,并将其挂载到具有id为echarts的DOM元素上。myChart = echarts.init(document.getElementById('echarts'))},//updateEcharts方法用于更新图表数据。当监听到组件数据或属性发生变化时,会调用这个方法。// 在方法中,首先判断myChart实例是否存在,如果存在则调用setOption方法,将新的配置选项传递给图表实例。updateEcharts(newValue, oldValue, ownerInstance, instance) {if (myChart != undefined) {myChart.setOption(newValue)}},}}
</script><style>.echarts {width: 100%;height: 300px;}
</style>
解析
<view @click="echarts.onClick" :prop="option" :change:prop="echarts.updateEcharts" id="echarts" class="echarts">
-
@click="echarts.onClick":在点击事件发生时,将调用echarts.onClick方法进行处理。@click是Vue中绑定点击事件的方式,相当于v-on:click。 -
:prop="option":将option作为prop属性的值进行绑定。这里的prop可以是组件的自定义属性,被父组件传递给子组件作为数据的一种方式。 -
:change:prop="echarts.updateEcharts":使用了Vue的修饰符语法,在change:prop事件发生时,调用echarts.updateEcharts方法进行处理。 -
id="echarts":给该元素指定了唯一的id属性值为echarts。id属性通常用于在JavaScript中获取元素或通过CSS选择器匹配元素。 -
class="echarts":给该元素指定了一个CSS类名为echarts,用于样式设计或选择器匹配。
<script module="echarts" lang="renderjs">
- 指定了这个脚本模块的类型为
echarts,并且语言为renderjs。
if (typeof window.echarts === 'function') {
this.initEcharts()
} else {
// 动态引入较大类库避免影响页面展示
const script = document.createElement('script')
script.src = 'static/js/echarts.js'
script.onload = this.initEcharts.bind(this)
document.head.appendChild(script)
}
- 首先判断
window.echarts是否存在,如果存在则调用initEcharts方法进行初始化。 -
如果不存在,则动态创建一个
<script>标签,并设置其src属性为static/js/echarts.js,然后在加载完成后调用initEcharts方法。 -
script.onload指定了onload事件的回调函数为this.initEcharts.bind(this)。当ECharts库的脚本加载完成后,触发onload事件,即可执行该回调函数。 -
this.initEcharts.bind(this)使用bind方法将当前组件实例绑定到initEcharts方法内部的this关键字上。这样,在initEcharts方法内部,this关键字将指向当前组件实例,可以访问组件的属性和方法。 -
document.head.appendChild(script)将动态创建的<script>元素添加到文档头部(head元素)中。通过这样的方式,浏览器会开始加载并执行该脚本。
initEcharts() {
myChart = echarts.init(document.getElementById('echarts'))
},
- echarts.init函数创建一个新的ECharts实例,并将其挂载到具有id为echarts的DOM元素上
updateEcharts(newValue, oldValue, ownerInstance, instance) {
if (myChart != undefined) {
myChart.setOption(newValue)
}
},
- updateEcharts方法用于更新图表数据。当监听到组件数据或属性发生变化时,会调用这个方法。
- 在方法中,首先判断myChart实例是否存在,如果存在则调用setOption方法,将新的配置选项传递给图表实例。