1.概述
QwtScaleDraw 是 Qt 绘图库 Qwt 中的一个类,用于绘制坐标轴刻度线和刻度标签。它提供了一些方法和属性来设置刻度线和标签的样式、布局和对齐方式。
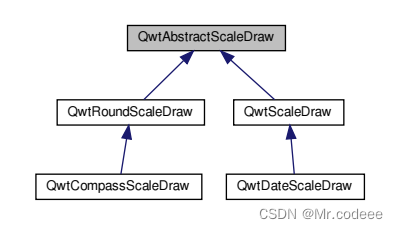
以下是类继承关系:
2.常用方法
标签相关方法:
- setLabelRotation(double angle):设置标签旋转角度。
- setLabelAlignment(Alignment alignment):设置标签对齐方式。
刻度线相关设置:
- void setTickLength (QwtScaleDiv::TickType, double length):设置刻度线长度
自定义标签,重写label方法
- virtual QwtText label (double) const
3.示例
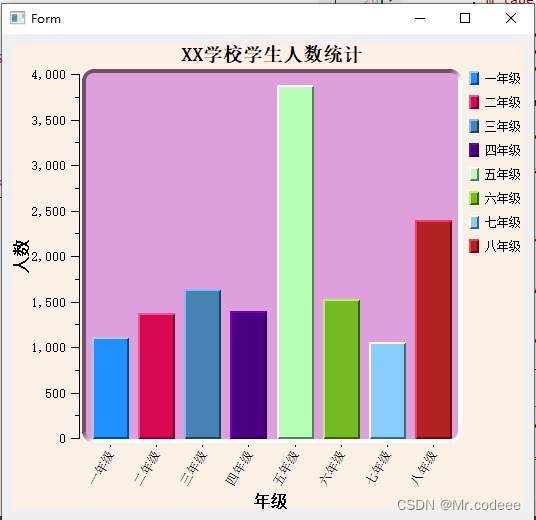
自定义下x轴的坐标轴。
#ifndef BARCHARTSINGLEWIDGET_H
#define BARCHARTSINGLEWIDGET_H#include <QWidget>namespace Ui {
class BarChartSingleWidget;
}class BarChartSingleWidget : public QWidget
{Q_OBJECTpublic:explicit BarChartSingleWidget(QWidget *parent = 0);~BarChartSingleWidget();private:Ui::BarChartSingleWidget *ui;QStringList m_distros;
};#endif // BARCHARTSINGLEWIDGET_H#include "BarChartSingleWidget.h"
#include "ui_BarChartSingleWidget.h"
#include "qwt_plot.h"
#include "qwt_plot_curve.h"
#include "qwt_text.h"
#include "qwt_legend.h"
#include "qwt_symbol.h"
#include "qwt_plot_marker.h"
#include "qwt_plot_grid.h"
#include "qwt_scale_div.h"
#include "qwt_plot_canvas.h"
#include "qwt_plot_legenditem.h"
#include "qwt_math.h"
#include "qwt_plot_layout.h"
#include "qwt_plot_barchart.h"
#include "qwt_scale_draw.h"
#include "qwt_column_symbol.h"
#include "qwt_plot_renderer.h"//自定义坐标轴
class ScaleDraw : public QwtScaleDraw
{public:ScaleDraw( Qt::Orientation orientation, const QStringList& labels ): m_labels( labels ){//设置tick长度setTickLength( QwtScaleDiv::MinorTick, 0 );setTickLength( QwtScaleDiv::MediumTick, 0 );setTickLength( QwtScaleDiv::MajorTick, 2 );enableComponent( QwtScaleDraw::Backbone, false );//设置方向if ( orientation == Qt::Vertical ){setLabelRotation( -60.0 );}else{setLabelRotation( -20.0 );}//设置label对齐方式setLabelAlignment( Qt::AlignLeft | Qt::AlignVCenter );}//重写label方法virtual QwtText label( double value ) const QWT_OVERRIDE{QwtText lbl;const int index = qRound( value );if ( index >= 0 && index < m_labels.size() ){lbl = m_labels[ index ];}return lbl;}private:const QStringList m_labels;
};//自定义ChartItem类,实现specialSymbol和barTitle方法
class ChartItem : public QwtPlotBarChart
{public:ChartItem(): QwtPlotBarChart( "Page Hits" ){setLegendMode( QwtPlotBarChart::LegendBarTitles );setLegendIconSize( QSize( 10, 14 ) );setLayoutPolicy( AutoAdjustSamples );setLayoutHint( 4.0 ); // minimum width for a single barsetSpacing( 10 ); // spacing between bars}void addDistro( const QString& distro, const QColor& color ){m_colors += color;m_distros += distro;itemChanged();}virtual QwtColumnSymbol* specialSymbol(int index, const QPointF& ) const QWT_OVERRIDE{// we want to have individual colors for each bar//新建一个标记QwtColumnSymbol* symbol = new QwtColumnSymbol( QwtColumnSymbol::Box );symbol->setLineWidth( 2 );  //设置线宽symbol->setFrameStyle( QwtColumnSymbol::Raised );//设置边框风格QColor c( Qt::white );if ( index >= 0 && index < m_colors.size() )c = m_colors[ index ];//设置颜色symbol->setPalette( c );return symbol;}//设置bar的标题virtual QwtText barTitle( int sampleIndex ) const QWT_OVERRIDE{QwtText title;if ( sampleIndex >= 0 && sampleIndex < m_distros.size() )title = m_distros[ sampleIndex ];return title;}private:QList< QColor > m_colors;       //每个bar的颜色QList< QString > m_distros;     //每个bar的标题
};static QwtPlot *g_plot = nullptr;BarChartSingleWidget::BarChartSingleWidget(QWidget *parent) :QWidget(parent),ui(new Ui::BarChartSingleWidget)
{ui->setupUi(this);const struct{const char* distro;const int hits;QColor color;} pageHits[] ={{ "一年级", 1114, QColor( "DodgerBlue" ) },{ "二年级", 1373, QColor( "#d70751" ) },{ "三年级", 1638, QColor( "SteelBlue" ) },{ "四年级", 1395, QColor( "Indigo" ) },{ "五年级", 3874, QColor( 183, 255, 183 ) },{ "六年级", 1532, QColor( 115, 186, 37 ) },{ "七年级", 1059, QColor( "LightSkyBlue" ) },{ "八年级", 2391, QColor( "FireBrick" ) }};//设置plot背景色g_plot = new QwtPlot(QwtText("XX学校学生人数统计"),this);g_plot->setAutoFillBackground( true );g_plot->setPalette( QColor( "Linen" ) );//设置画布QwtPlotCanvas* canvas = new QwtPlotCanvas();canvas->setLineWidth( 2 );canvas->setFrameStyle( QFrame::Box | QFrame::Sunken );canvas->setBorderRadius( 10 );//设置画布的背景色QPalette canvasPalette( QColor( "Plum" ) );canvasPalette.setColor( QPalette::WindowText, QColor( "Indigo" ) );canvas->setPalette( canvasPalette );g_plot->setCanvas( canvas );// 创建柱状图ChartItem* chartItem = new ChartItem();//设置条形图数据QVector< double > samples;for ( uint i = 0; i < sizeof( pageHits ) / sizeof( pageHits[ 0 ] ); i++ ){m_distros += pageHits[ i ].distro;samples += pageHits[ i ].hits;chartItem->addDistro( pageHits[ i ].distro, pageHits[ i ].color );}chartItem->setSamples( samples );chartItem->attach( g_plot );//设置坐标轴//设置自定义的坐标轴g_plot->setAxisTitle( QwtAxis::XBottom, "年级" );g_plot->setAxisMaxMinor( QwtAxis::XBottom, 3 );g_plot->setAxisScaleDraw( QwtAxis::XBottom, new ScaleDraw( Qt::Vertical, m_distros ) );g_plot->setAxisTitle( QwtAxis::YLeft, "人数" );g_plot->setAxisMaxMinor( QwtAxis::YLeft, 3 );//设置自定义的坐标轴QwtScaleDraw* scaleDraw = new QwtScaleDraw();scaleDraw->setTickLength( QwtScaleDiv::MediumTick, 4 );g_plot->setAxisScaleDraw( QwtAxis::YLeft, scaleDraw );g_plot->plotLayout()->setCanvasMargin( 0 );//插入图例g_plot->insertLegend( new QwtLegend() );g_plot->replot();// 显示绘图对象ui->verticalLayout->addWidget(g_plot);
}BarChartSingleWidget::~BarChartSingleWidget()
{delete ui;
}
4.相关参考
Qwt QwtLegend和QwtPlotLegendItem图例类详解-CSDN博客
Qwt QwtPlot类详解-CSDN博客
Qwt QwtPlotBarChart自定义条形统计图-CSDN博客


![[java/力扣110]平衡二叉树——优化前后的两种方法](https://img-blog.csdnimg.cn/ac5f043c9c894051bb5062d8f5c8ee8d.png)