以umi为例
首先是下载两个插件(echarts和echarts-for-react)
npm
npm install --save echarts-for-react
npm install echarts
yarn
yarn add echarts-for-react
yarn add echarts
接下来是在tsx或jsx中引入使用
import ReactEcharts from "echarts-for-react";
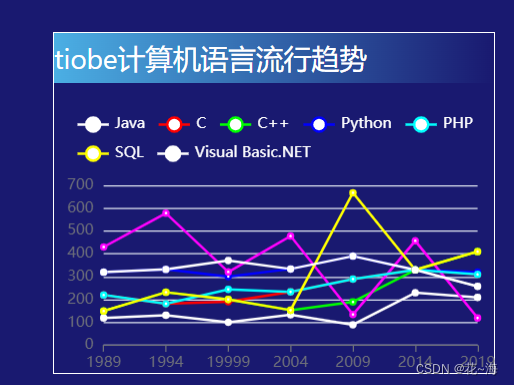
import React from 'react'export default function Line() {let option = {legend: {data: ['Java', 'C', 'C++', 'Python', 'JavaScript', 'PHP', 'SQL', 'Visual Basic.NET'],textStyle: {color: 'white'}},grid: {left: '3%',right: '4%',bottom: '3%',containLabel: true},xAxis: {type: 'category',boundaryGap: false,data: ['1989', '1994', '19999', '2004', '2009', '2014', '2019']},yAxis: {type: 'value'},series: [{name: 'Java',type: 'line',data: [120, 132, 101, 134, 90, 230, 210]},{name: 'C',type: 'line',data: [220, 182, 191, 234, 290, 330, 310]},{name: 'C++',type: 'line',data: [150, 232, 201, 154, 190, 330, 410]},{name: 'Python',type: 'line',data: [320, 332, 301, 334, 390, 330, 320]},{name: ' JavaScript',type: 'line',data: [430, 578, 321, 478, 135, 457, 120]},{name: 'PHP',type: 'line',data: [220, 182, 245, 234, 290, 330, 310]},{name: 'SQL',type: 'line',data: [150, 232, 201, 154, 667, 330, 410]},{name: 'Visual Basic.NET',type: 'line',data: [320, 332, 371, 334, 390, 330, 258]},]};return (<div><ReactEcharts option={option}  /></div>)
}
效果如下
