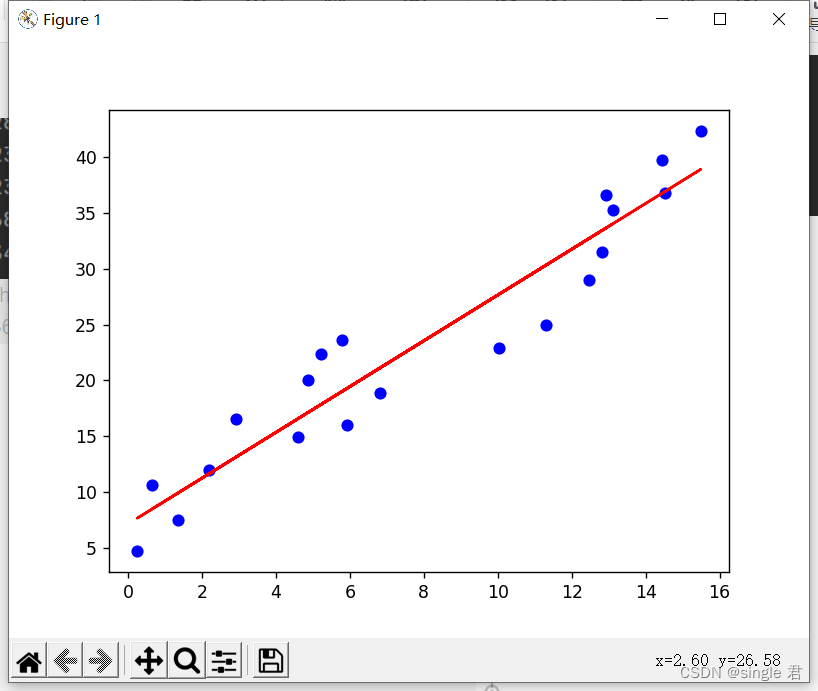
利用梯度下降实现线性拟合,效果和sklearn LinearRegression()差不多。
学习率初始设置为0.1结果算高的,直接让我的参数变成了nan。(体会到了飞出去的感觉)
把学习率调小了之后就正常了
# coding=utf-8
import matplotlib.pyplot as plt
import numpy as np
if __name__ == '__main__':X =[12.46, 0.25, 5.22, 11.3, 6.81, 4.59, 0.66, 14.53, 15.49, 14.43,2.19, 1.35, 10.02, 12.93, 5.93, 2.92, 12.81, 4.88, 13.11, 5.8]Y =[29.01, 4.7, 22.33, 24.99, 18.85, 14.89, 10.58, 36.84, 42.36, 39.73,11.92, 7.45, 22.9, 36.62, 16.04, 16.56, 31.55, 20.04, 35.26, 23.59]w=1b=0.1a=0.01 # 学习率w_temp=-100b_temp=-100wchange = 100bchange = 100while abs(wchange)>1e-12 and abs(bchange)>1e-12:print(wchange)wchange=0bchange=0for i in range(len(X)):wchange+=(w*X[i]+b-Y[i])*X[i]bchange+=w*X[i]+b-Y[i]wchange/=len(X)bchange /= len(X)w_temp=w-a*wchangeb_temp=b-a*bchangew=w_tempb=b_tempprint("y=%.4f*x+%.4f" % (w, b))# 简单画图显示plt.scatter(X, Y, c="blue")Y_predict=[]for i in range(len(X)):Y_predict.append(w*X[i]+b)plt.plot(X, Y_predict, c="red")plt.show()print(Y_predict)

