import matplotlib. pyplot as plt
areas = [ 50 , 80 , 120 ]
shenzhen_prices = [ 1500 , 2000 , 2500 ]
guangzhou_prices = [ 1200 , 1800 , 2300 ]
zhengzhou_prices = [ 800 , 1200 , 1500 ]
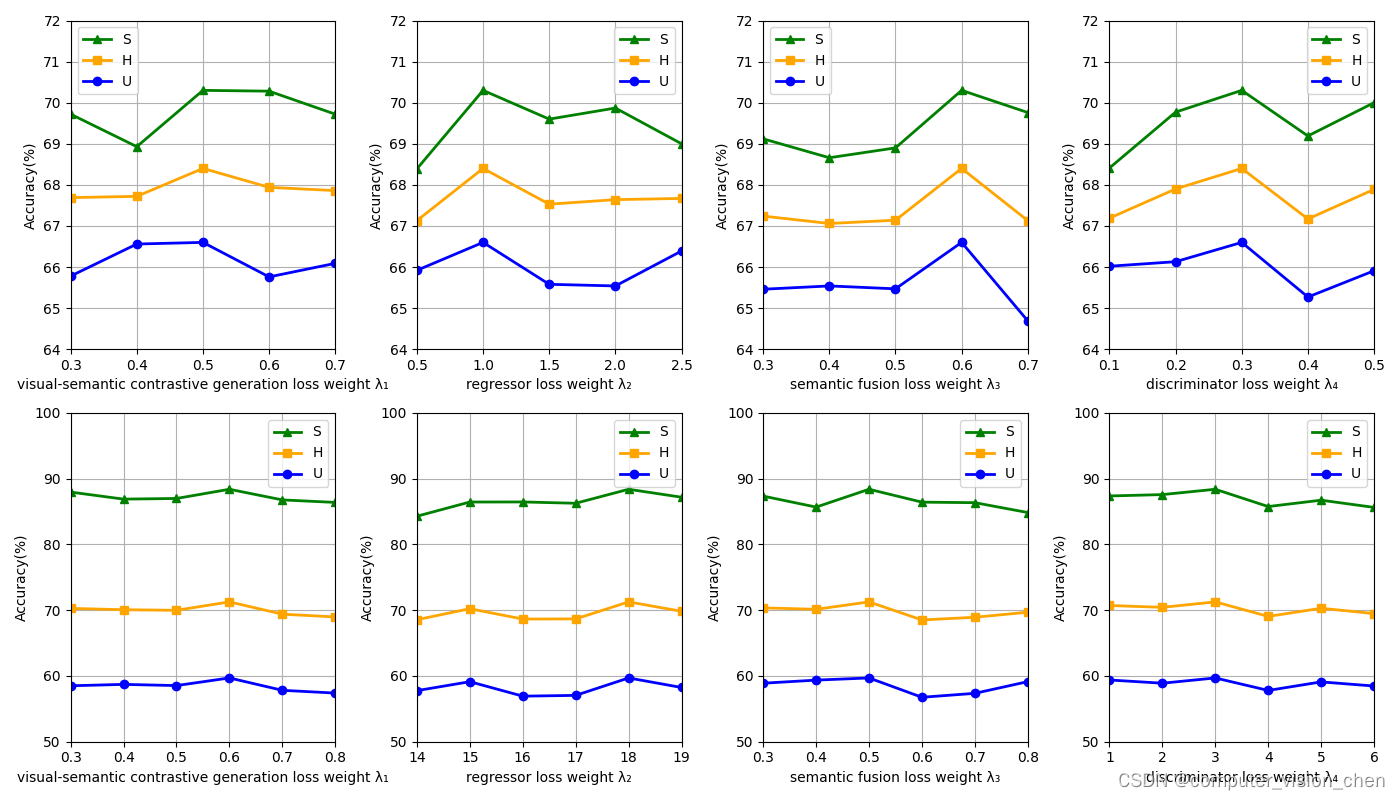
fig, axs = plt. subplots( 2 , 4 , figsize= ( 14 , 8 ) ) def draw_three_linegraph ( ax, x, S, H, U, x_begin, x_end, y_begin, y_end, x_label) : ax. plot( x, S, label= 'S' , color= 'green' , marker= '^' , linewidth= 2.0 ) ax. plot( x, H, label= 'H' , color= 'orange' , marker= 's' , linewidth= 2.0 ) ax. plot( x, U, label= 'U' , color= 'blue' , marker= 'o' , linewidth= 2.0 ) ax. set_xlabel( x_label) ax. set_ylabel( 'Accuracy(%)' ) ax. legend( ) ax. set_xlim( x_begin, x_end) ax. set_ylim( y_begin, y_end) ax. grid( True ) '''CUB第一个图'''
result_S2, result_H2, result_U2 = [ 69.72 , 68.93 , 70.3 , 70.28 , 69.72 ] , [ 67.69 , 67.72 , 68.4 , 67.94 , 67.86 ] , [ 65.78 , 66.56 , 66.6 , 65.76 , 66.09 ]
x_CUB = [ 0.3 , 0.4 , 0.5 , 0.6 , 0.7 ]
x_CUB_begin, x_CUB_end = 0.3 , 0.7
y_CUB_begin, y_CUB_end = 64 , 72
x_label = 'visual-semantic contrastive generation loss weight λ₁'
draw_three_linegraph( axs[ 0 , 0 ] , x_CUB, result_S2, result_H2, result_U2, x_CUB_begin, x_CUB_end, y_CUB_begin, y_CUB_end, x_label) '''CUB第二个图'''
result_S2, result_H2, result_U2 = [ 68.39 , 70.3 , 69.6 , 69.87 , 69.0 ] , [ 67.13 , 68.4 , 67.53 , 67.64 , 67.67 ] , [ 65.92 , 66.6 , 65.58 , 65.54 , 66.39 ]
x_CUB = [ 0.5 , 1 , 1.5 , 2 , 2.5 ]
x_CUB_begin, x_CUB_end = 0.5 , 2.5
y_CUB_begin, y_CUB_end = 64 , 72
x_label = 'regressor loss weight λ₂'
draw_three_linegraph( axs[ 0 , 1 ] , x_CUB, result_S2, result_H2, result_U2, x_CUB_begin, x_CUB_end, y_CUB_begin, y_CUB_end, x_label) '''CUB第三个图'''
result_S2, result_H2, result_U2 = [ 69.12 , 68.66 , 68.9 , 70.3 , 69.76 ] , [ 67.24 , 67.06 , 67.14 , 68.4 , 67.13 ] , [ 65.46 , 65.54 , 65.47 , 66.6 , 64.69 ]
x_CUB = [ 0.3 , 0.4 , 0.5 , 0.6 , 0.7 ]
x_CUB_begin, x_CUB_end = 0.3 , 0.7
y_CUB_begin, y_CUB_end = 64 , 72
x_label = 'semantic fusion loss weight λ₃'
draw_three_linegraph( axs[ 0 , 2 ] , x_CUB, result_S2, result_H2, result_U2, x_CUB_begin, x_CUB_end, y_CUB_begin, y_CUB_end, x_label) '''CUB第四个图'''
result_S2, result_H2, result_U2 = [ 68.41 , 69.77 , 70.3 , 69.19 , 70.0 ] , [ 67.19 , 67.9 , 68.4 , 67.17 , 67.89 ] , [ 66.02 , 66.13 , 66.6 , 65.27 , 65.91 ]
x_CUB = [ 0.1 , 0.2 , 0.3 , 0.4 , 0.5 ]
x_CUB_begin, x_CUB_end = 0.1 , 0.5
y_CUB_begin, y_CUB_end = 64 , 72
x_label = 'discriminator loss weight λ₄'
draw_three_linegraph( axs[ 0 , 3 ] , x_CUB, result_S2, result_H2, result_U2, x_CUB_begin, x_CUB_end, y_CUB_begin, y_CUB_end, x_label) '''FLO第一个图'''
resultS2, resultH2, resultU2 = [ 87.97 , 86.9 , 87.0 , 88.4 , 86.78 , 86.4 ] , [ 70.28 , 70.08 , 69.99 , 71.27 , 69.4 , 68.98 ] , [ 58.51 , 58.72 , 58.54 , 59.7 , 57.82 , 57.4 ]
x_FLO = [ 0.3 , 0.4 , 0.5 , 0.6 , 0.7 , 0.8 ]
x_FLO_begin, x_FLO_end = 0.3 , 0.8
y_FLO_begin, y_FLO_end = 50 , 100
x_label = 'visual-semantic contrastive generation loss weight λ₁'
draw_three_linegraph( axs[ 1 , 0 ] , x_FLO, resultS2, resultH2, resultU2, x_FLO_begin, x_FLO_end, y_FLO_begin, y_FLO_end, x_label) '''FLO第二个图'''
resultS2, resultH2, resultU2 = [ 84.3 , 86.46 , 86.47 , 86.27 , 88.4 , 87.19 ] , [ 68.56 , 70.23 , 68.66 , 68.68 , 71.27 , 69.84 ] , [ 57.77 , 59.13 , 56.93 , 57.05 , 59.7 , 58.25 ]
x_FLO = [ 14 , 15 , 16 , 17 , 18 , 19 ]
x_FLO_begin, x_FLO_end = 14 , 19
y_FLO_begin, y_FLO_end = 50 , 100
x_label = 'regressor loss weight λ₂'
draw_three_linegraph( axs[ 1 , 1 ] , x_FLO, resultS2, resultH2, resultU2, x_FLO_begin, x_FLO_end, y_FLO_begin, y_FLO_end, x_label) '''FLO第三个图'''
resultS2, resultH2, resultU2 = [ 87.36 , 85.69 , 88.4 , 86.44 , 86.36 , 84.86 ] , [ 70.36 , 70.14 , 71.27 , 68.52 , 68.93 , 69.7 ] , [ 58.9 , 59.37 , 59.7 , 56.76 , 57.36 , 59.14 ]
x_FLO = [ 0.3 , 0.4 , 0.5 , 0.6 , 0.7 , 0.8 ]
x_FLO_begin, x_FLO_end = 0.3 , 0.8
y_FLO_begin, y_FLO_end = 50 , 100
x_label = 'semantic fusion loss weight λ₃'
draw_three_linegraph( axs[ 1 , 2 ] , x_FLO, resultS2, resultH2, resultU2, x_FLO_begin, x_FLO_end, y_FLO_begin, y_FLO_end, x_label) '''FLO第四个图'''
resultS2, resultH2, resultU2 = [ 87.38 , 87.59 , 88.4 , 85.77 , 86.74 , 85.64 ] , [ 70.72 , 70.44 , 71.27 , 69.06 , 70.3 , 69.49 ] , [ 59.39 , 58.9 , 59.7 , 57.8 , 59.1 , 58.47 ]
x_FLO = [ 1 , 2 , 3 , 4 , 5 , 6 ]
x_FLO_begin, x_FLO_end = 1 , 6
y_FLO_begin, y_FLO_end = 50 , 100
x_label = 'discriminator loss weight λ₄'
draw_three_linegraph( axs[ 1 , 3 ] , x_FLO, resultS2, resultH2, resultU2, x_FLO_begin, x_FLO_end, y_FLO_begin, y_FLO_end, x_label)
plt. tight_layout( )
plt. savefig( '2_4_figure_2.0.png' )
plt. show( )
