使用ECharts来完成一些花里胡哨的图表吧,一般这种需求我们在我们的客户端不太常见,但是,我们在后端进行各种数据统计的时候就会发现ECharts的优点了,比如我们常常做的柱状图,折线图,雷达图等可视化形式,可以更加直观的展示和分析运营我们对系统运行状态的情况。
那么ECharts究竟是啥?
ECharts是一个基于JavaScript的开源可视化库,用于创建交互式的图表和数据可视化。它由百度开发并维护,提供了丰富的图表类型和灵活的配置选项,使开发者能够轻松地在网页中展示各种数据。
ECharts支持常见的图表类型,如折线图、柱状图、饼图、散点图、雷达图等,并且提供了丰富的交互功能,如数据缩放、数据筛选、图例切换等。它还支持动画效果和响应式设计,可以适应不同的屏幕尺寸和设备。
ECharts提供了一个强大的配置项,可以通过JavaScript代码来定义图表的样式、数据和交互行为。它还支持使用JSON格式的数据,方便与后端数据接口进行交互。
ECharts可以与各种前端框架和库集成,包括Vue.js、React、Angular等,也可以在纯JavaScript环境中使用。它的文档详细且易于理解,提供了丰富的示例和API参考,方便开发者学习和使用。
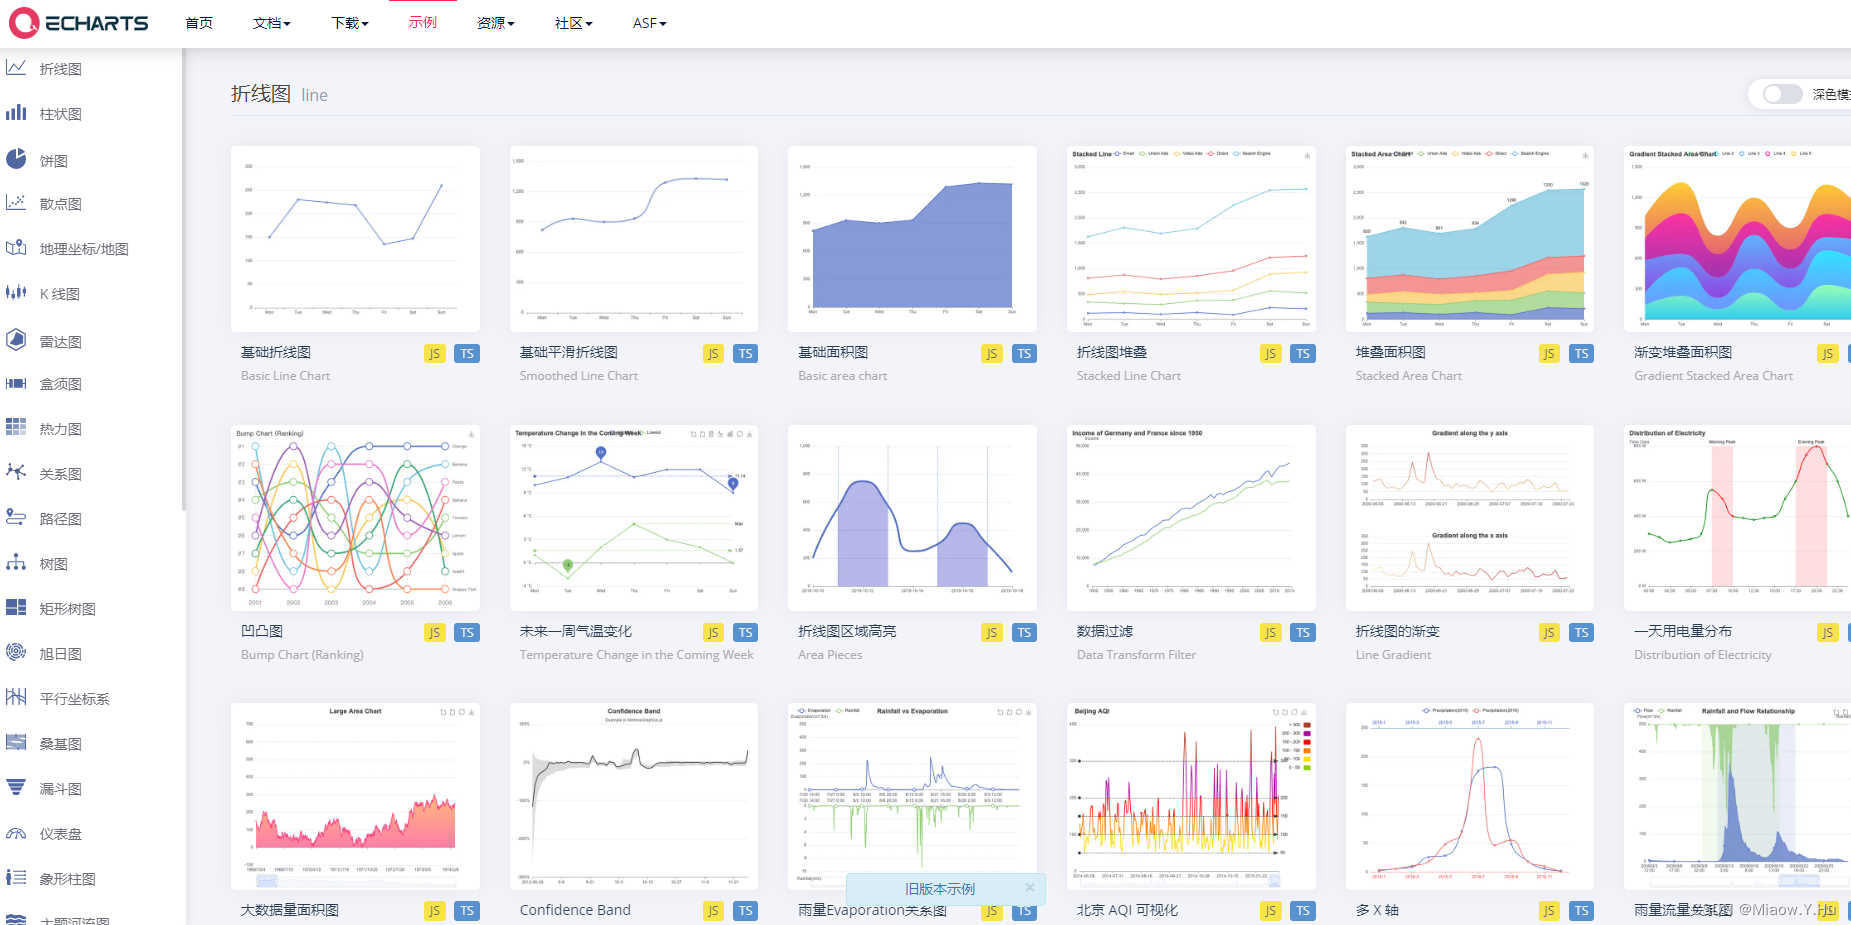
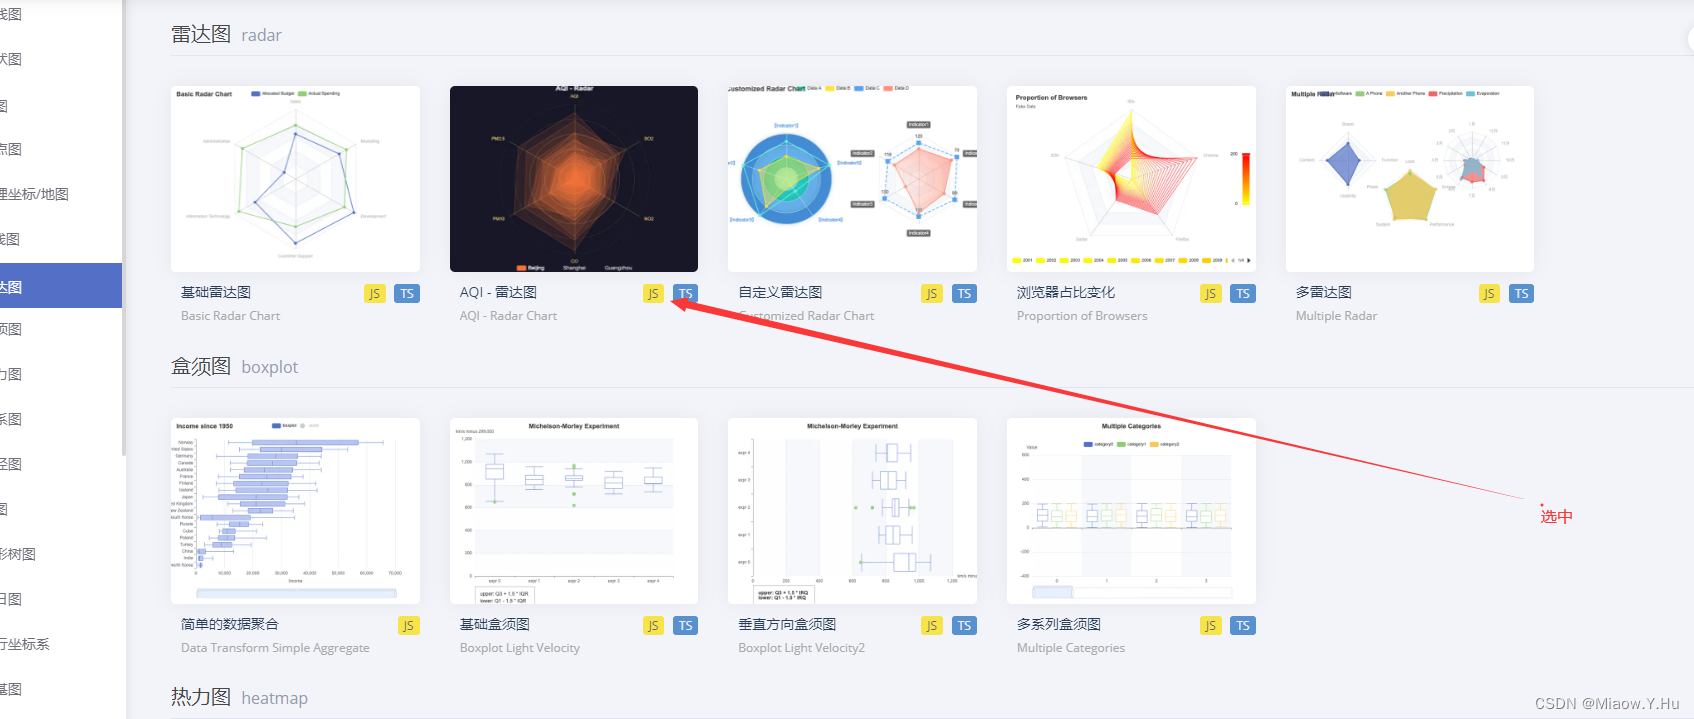
ECharts官网:https://echarts.apache.org/examples/zh/index.html
我们在Spring Boot中使用ECharts绘制表格的第一步还是创建一个Spring Boot项目然后引入ECharts的依赖,在我们的项目中使用pom.xml或者build.gradle文件中添加相关依赖。
<!-- 如果使用Maven -->
<dependency><groupId>org.webjars</groupId><artifactId>echarts</artifactId><version>4.9.0</version>
</dependency>
当然,在后端使用主要在于我们用来传递数据罢了,我们可以通过创建一个控制类,然后再控制类里边处理我们的相关代码逻辑,例如:
@RestController
@RequestMapping("/chart")
public class ChartController {@GetMapping("/data")public Object getChartData() {// 在这里编写代码来获取图表数据// 返回的数据可以是一个包含图表配置的JSON对象return yourChartData;}
}
之后,我们在HTML中引入一个ECharts的javaScript文件,可以通过WebJars来引入我们的ECharts;
<script src="/webjars/echarts/4.9.0/echarts.min.js"></script>
在我们的HtML中创建一个div用来存储ECharts图表,例如:
<div id="chartContainer"></div>
之后,我们可以通过向后端得到我们的数据,用来展示图表数据,并通过ECharts的API进行绘制表格。
// 使用Ajax从服务器获取图表数据
$.ajax({url: '/chart/data',success: function(data) {// 使用ECharts绘制图表var chart = echarts.init(document.getElementById('chartContainer'));chart.setOption(data);}
});
以上是我们在Spring Boot中使用ECharts的相关案例。以下我将采用直接在前端将数据渲染出来,不经过后台。
我们使用Thymeleaf进行,第一步引入依赖:
<dependency><groupId>org.springframework.boot</groupId><artifactId>spring-boot-starter-web</artifactId></dependency><dependency><groupId>org.springframework.boot</groupId><artifactId>spring-boot-starter-thymeleaf</artifactId></dependency><dependency><groupId>org.projectlombok</groupId><artifactId>lombok</artifactId><scope>provided</scope></dependency>
第二步,创建一个index.html文件在resources/template下
<!DOCTYPE html>
<html>
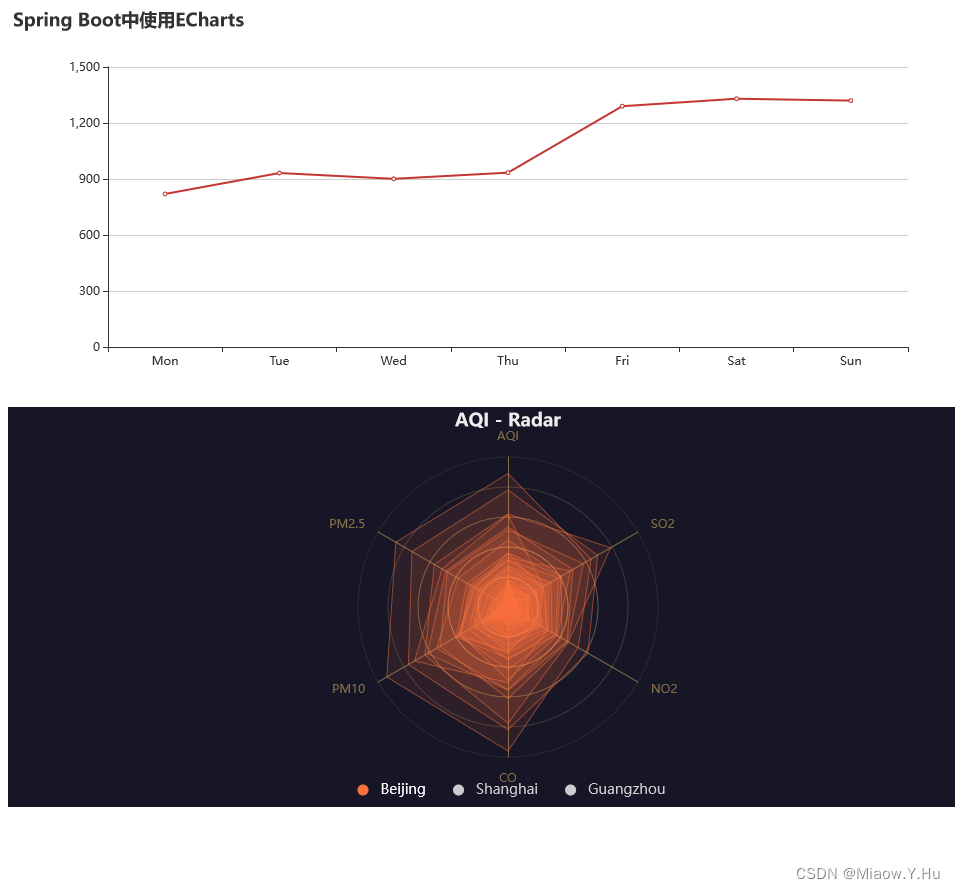
<head lang="en"><meta charset="UTF-8" /><title>Spring Boot中使用ECharts</title><script src="https://cdn.bootcss.com/echarts/4.6.0/echarts.min.js"></script>
</head>
<body>
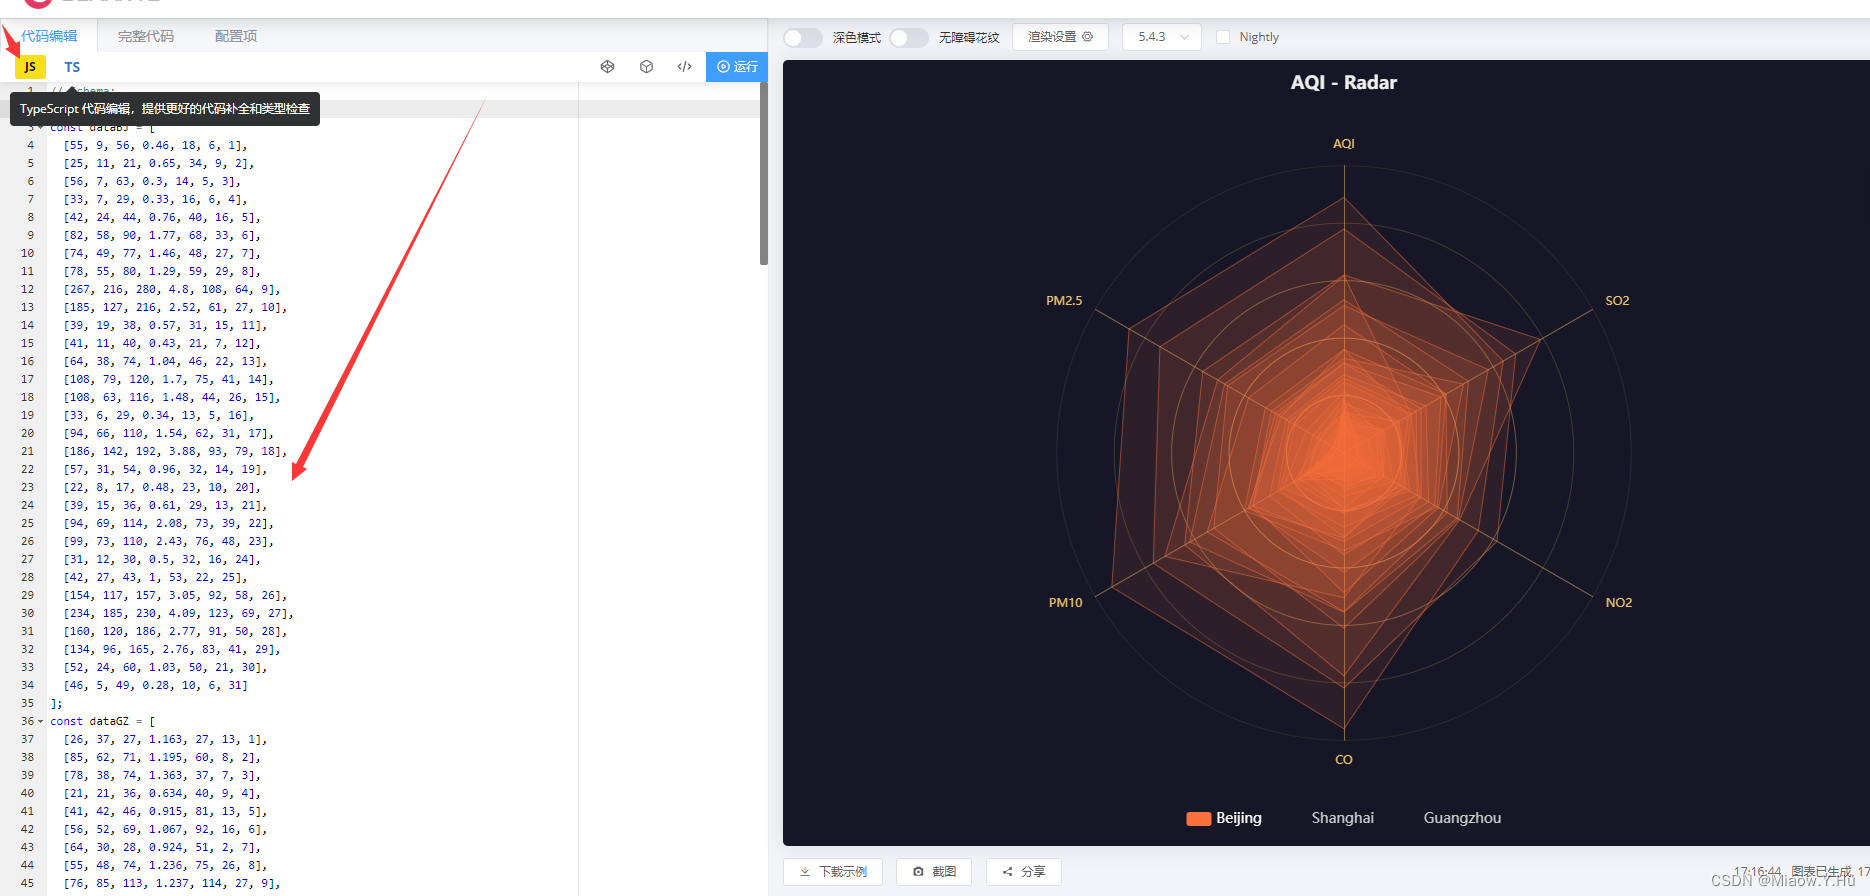
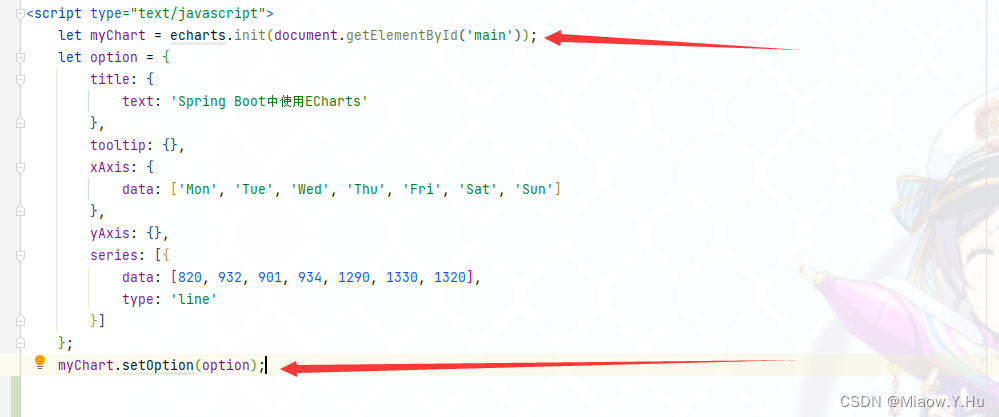
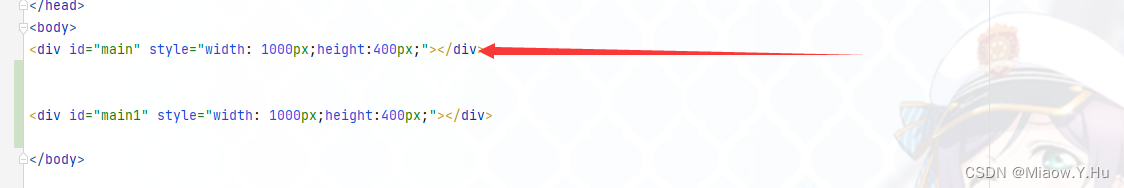
<div id="main" style="width: 1000px;height:400px;"></div><div id="main1" style="width: 1000px;height:400px;"></div></body><script type="text/javascript">let myChart = echarts.init(document.getElementById('main'));let option = {title: {text: 'Spring Boot中使用ECharts'},tooltip: {},xAxis: {data: ['Mon', 'Tue', 'Wed', 'Thu', 'Fri', 'Sat', 'Sun']},yAxis: {},series: [{data: [820, 932, 901, 934, 1290, 1330, 1320],type: 'line'}]};myChart.setOption(option);let myChart1 = echarts.init(document.getElementById('main1'));const dataBJ = [[55, 9, 56, 0.46, 18, 6, 1],[25, 11, 21, 0.65, 34, 9, 2],[56, 7, 63, 0.3, 14, 5, 3],[33, 7, 29, 0.33, 16, 6, 4],[42, 24, 44, 0.76, 40, 16, 5],[82, 58, 90, 1.77, 68, 33, 6],[74, 49, 77, 1.46, 48, 27, 7],[78, 55, 80, 1.29, 59, 29, 8],[267, 216, 280, 4.8, 108, 64, 9],[185, 127, 216, 2.52, 61, 27, 10],[39, 19, 38, 0.57, 31, 15, 11],[41, 11, 40, 0.43, 21, 7, 12],[64, 38, 74, 1.04, 46, 22, 13],[108, 79, 120, 1.7, 75, 41, 14],[108, 63, 116, 1.48, 44, 26, 15],[33, 6, 29, 0.34, 13, 5, 16],[94, 66, 110, 1.54, 62, 31, 17],[186, 142, 192, 3.88, 93, 79, 18],[57, 31, 54, 0.96, 32, 14, 19],[22, 8, 17, 0.48, 23, 10, 20],[39, 15, 36, 0.61, 29, 13, 21],[94, 69, 114, 2.08, 73, 39, 22],[99, 73, 110, 2.43, 76, 48, 23],[31, 12, 30, 0.5, 32, 16, 24],[42, 27, 43, 1, 53, 22, 25],[154, 117, 157, 3.05, 92, 58, 26],[234, 185, 230, 4.09, 123, 69, 27],[160, 120, 186, 2.77, 91, 50, 28],[134, 96, 165, 2.76, 83, 41, 29],[52, 24, 60, 1.03, 50, 21, 30],[46, 5, 49, 0.28, 10, 6, 31]];const dataGZ = [[26, 37, 27, 1.163, 27, 13, 1],[85, 62, 71, 1.195, 60, 8, 2],[78, 38, 74, 1.363, 37, 7, 3],[21, 21, 36, 0.634, 40, 9, 4],[41, 42, 46, 0.915, 81, 13, 5],[56, 52, 69, 1.067, 92, 16, 6],[64, 30, 28, 0.924, 51, 2, 7],[55, 48, 74, 1.236, 75, 26, 8],[76, 85, 113, 1.237, 114, 27, 9],[91, 81, 104, 1.041, 56, 40, 10],[84, 39, 60, 0.964, 25, 11, 11],[64, 51, 101, 0.862, 58, 23, 12],[70, 69, 120, 1.198, 65, 36, 13],[77, 105, 178, 2.549, 64, 16, 14],[109, 68, 87, 0.996, 74, 29, 15],[73, 68, 97, 0.905, 51, 34, 16],[54, 27, 47, 0.592, 53, 12, 17],[51, 61, 97, 0.811, 65, 19, 18],[91, 71, 121, 1.374, 43, 18, 19],[73, 102, 182, 2.787, 44, 19, 20],[73, 50, 76, 0.717, 31, 20, 21],[84, 94, 140, 2.238, 68, 18, 22],[93, 77, 104, 1.165, 53, 7, 23],[99, 130, 227, 3.97, 55, 15, 24],[146, 84, 139, 1.094, 40, 17, 25],[113, 108, 137, 1.481, 48, 15, 26],[81, 48, 62, 1.619, 26, 3, 27],[56, 48, 68, 1.336, 37, 9, 28],[82, 92, 174, 3.29, 0, 13, 29],[106, 116, 188, 3.628, 101, 16, 30],[118, 50, 0, 1.383, 76, 11, 31]];const dataSH = [[91, 45, 125, 0.82, 34, 23, 1],[65, 27, 78, 0.86, 45, 29, 2],[83, 60, 84, 1.09, 73, 27, 3],[109, 81, 121, 1.28, 68, 51, 4],[106, 77, 114, 1.07, 55, 51, 5],[109, 81, 121, 1.28, 68, 51, 6],[106, 77, 114, 1.07, 55, 51, 7],[89, 65, 78, 0.86, 51, 26, 8],[53, 33, 47, 0.64, 50, 17, 9],[80, 55, 80, 1.01, 75, 24, 10],[117, 81, 124, 1.03, 45, 24, 11],[99, 71, 142, 1.1, 62, 42, 12],[95, 69, 130, 1.28, 74, 50, 13],[116, 87, 131, 1.47, 84, 40, 14],[108, 80, 121, 1.3, 85, 37, 15],[134, 83, 167, 1.16, 57, 43, 16],[79, 43, 107, 1.05, 59, 37, 17],[71, 46, 89, 0.86, 64, 25, 18],[97, 71, 113, 1.17, 88, 31, 19],[84, 57, 91, 0.85, 55, 31, 20],[87, 63, 101, 0.9, 56, 41, 21],[104, 77, 119, 1.09, 73, 48, 22],[87, 62, 100, 1, 72, 28, 23],[168, 128, 172, 1.49, 97, 56, 24],[65, 45, 51, 0.74, 39, 17, 25],[39, 24, 38, 0.61, 47, 17, 26],[39, 24, 39, 0.59, 50, 19, 27],[93, 68, 96, 1.05, 79, 29, 28],[188, 143, 197, 1.66, 99, 51, 29],[174, 131, 174, 1.55, 108, 50, 30],[187, 143, 201, 1.39, 89, 53, 31]];const lineStyle = {width: 1,opacity: 0.5};option = {backgroundColor: '#161627',title: {text: 'AQI - Radar',left: 'center',textStyle: {color: '#eee'}},legend: {bottom: 5,data: ['Beijing', 'Shanghai', 'Guangzhou'],itemGap: 20,textStyle: {color: '#fff',fontSize: 14},selectedMode: 'single'},radar: {indicator: [{ name: 'AQI', max: 300 },{ name: 'PM2.5', max: 250 },{ name: 'PM10', max: 300 },{ name: 'CO', max: 5 },{ name: 'NO2', max: 200 },{ name: 'SO2', max: 100 }],shape: 'circle',splitNumber: 5,axisName: {color: 'rgb(238, 197, 102)'},splitLine: {lineStyle: {color: ['rgba(238, 197, 102, 0.1)','rgba(238, 197, 102, 0.2)','rgba(238, 197, 102, 0.4)','rgba(238, 197, 102, 0.6)','rgba(238, 197, 102, 0.8)','rgba(238, 197, 102, 1)'].reverse()}},splitArea: {show: false},axisLine: {lineStyle: {color: 'rgba(238, 197, 102, 0.5)'}}},series: [{name: 'Beijing',type: 'radar',lineStyle: lineStyle,data: dataBJ,symbol: 'none',itemStyle: {color: '#F9713C'},areaStyle: {opacity: 0.1}},{name: 'Shanghai',type: 'radar',lineStyle: lineStyle,data: dataSH,symbol: 'none',itemStyle: {color: '#B3E4A1'},areaStyle: {opacity: 0.05}},{name: 'Guangzhou',type: 'radar',lineStyle: lineStyle,data: dataGZ,symbol: 'none',itemStyle: {color: 'rgb(238, 197, 102)'},areaStyle: {opacity: 0.05}}]};myChart1.setOption(option);</script>
</html>
创建一个控制类,用来帮助我们访问前端界面。
@Controller
public class HelloController {@GetMapping("/")public String index(ModelMap map) {// return模板文件的名称,对应src/main/resources/templates/index.htmlreturn "index";}}
通过http://localhost:8080
具体的更多图的引入: