普罗米修斯下载网址: Download | Prometheus
准备两台机器:
192.168.58.152 prometheus
192.168.58.142 node_exporter
关闭防火墙和selinux:
[root@localhost ~]# setenforce 0 && systemctl stop firewalld[root@localhost ~]# setenforce 0 && systemctl stop firewalld
给服务器改名:
[root@localhost ~]# hostnamectl set-hostname prometheus[root@localhost ~]# hostnamectl set-hostname node_exporter
服务端操作:
下载安装prometheus
# 下载prometheus
[root@prometheus ~]#  wget https://github.com/prometheus/prometheus/releases/download/v2.47.2/prometheus-2.47.2.linux-amd64.tar.gz
[root@prometheus ~]# tar xvfz prometheus-2.47.2.linux-amd64.tar.gz -C /usr/local/
[root@prometheus ~]# cd /usr/local/
[root@prometheus local]# mv prometheus-2.47.2.linux-amd64 prometheus
[root@prometheus local]# cd prometheus
[root@prometheus prometheus]# ls
console_libraries  consoles  data  LICENSE  NOTICE  prometheus  prometheus.yml  promtool# 查看版本信息
[root@prometheus prometheus]# ./prometheus --version
prometheus, version 2.47.2 (branch: HEAD, revision: 3f3172cde1ee37f1c7b3a5f3d9b031190509b3ad)build user:       root@79f2ad339b75build date:       20231012-16:07:10go version:       go1.21.3platform:         linux/amd64tags:             netgo,builtinassets,stringlabels
# 查看帮助
[root@prometheus prometheus]# ./prometheus --help
prometheus, version 2.47.2 (branch: HEAD, revision: 3f3172cde1ee37f1c7b3a5f3d9b031190509b3ad)build user:       root@79f2ad339b75build date:       20231012-16:07:10go version:       go1.21.3platform:         linux/amd64tags:             netgo,builtinassets,stringlabels…………
prometheus.yml 配置文件解释
[root@prometheus prometheus]# cat prometheus.yml
# my global config
global:# 默认情况下,每15s拉取一次目标采样点数据。scrape_interval:     15s # Set the scrape interval to every 15 seconds. Default is every 1 minute.# 每15秒评估一次规则。默认值为每1分钟。evaluation_interval: 15s # Evaluate rules every 15 seconds. The default is every 1 minute.# scrape_timeout is set to the global default (10s).# Alertmanager configuration
alerting:alertmanagers:- static_configs:- targets:# - alertmanager:9093# Load rules once and periodically evaluate them according to the global 'evaluation_interval'.
rule_files:# - "first_rules.yml"# - "second_rules.yml"# A scrape configuration containing exactly one endpoint to scrape:
# Here it's Prometheus itself.
scrape_configs:# job名称会增加到拉取到的所有采样点上,同时还有一个instance目标服务的host:port标签也会增加到采样点上- job_name: 'prometheus'# 覆盖global的采样点,拉取时间间隔5sscrape_interval: 5sstatic_configs:- targets: ['localhost:9090']
启动prometheus
[root@prometheus prometheus]# ./prometheus --config.file=prometheus.yml可指定的启动参数
# 指定配置文件
--config.file="prometheus.yml"
# 默认指定监听地址端口,可修改端口
--web.listen-address="0.0.0.0:9090"
# 最大连接数
--web.max-connections=512
# tsdb数据存储的目录,默认当前data/
--storage.tsdb.path="data/"
# premetheus 存储数据的时间,默认保存15天
--storage.tsdb.retention=15d
# 通过命令热加载无需重启 curl -XPOST 192.168.2.45:9090/-/reload
--web.enable-lifecycle
# 可以启用 TLS 或 身份验证 的配置文件的路径
--web.config.file=""启动选项了解:./prometheus --help
浏览器访问: http://192.168.58.152:9090/

浏览器访问: http://192.168.58.152:9090/metrics

将Prometheus配置为systemd管理
# 配置Prometheus启动文件
[root@prometheus ~]# vim /usr/lib/systemd/system/prometheus.service
[Unit]
Description=https://prometheus.io[Service]
Restart=on-failure
ExecStart=/usr/local/prometheus/prometheus --config.file=/usr/local/prometheus/prometheus.yml --web.listen-address=:9090[Install]
WantedBy=multi-user.target# 重新加载system配置
[root@prometheus ~]# systemctl daemon-reload
[root@prometheus ~]# systemctl start prometheus
[root@prometheus ~]# ss -tlanp |grep 9090
LISTEN     0      1024      [::]:9090                  [::]:*                   users:(("prometheus",pid=9318,fd=7))
客户端操作:
配置服务发现监控linux主机及相关服务
# 安装node_exporter
[root@node ~]# wget https://github.com/prometheus/node_exporter/releases/download/v1.7.0/node_exporter-1.7.0.linux-amd64.tar.gz
[root@node ~]# tar -xr node_exporter-1.7.0.linux-amd64.tar.gz -C /usr/local/
[root@node ~]# cd /usr/local/
[root@node local]# mv node_exporter-1.7.0.linux-amd64/ node_exporter
[root@node local]# cd node_exporter/
[root@node node_exporter]# ls
LICENSE  node_exporter  NOTICE
[root@node node_exporter]# ./node_exporter &…………
ts=2023-11-16T09:52:04.979Z caller=tls_config.go:274 level=info msg="Listening on" address=[::]:9100
ts=2023-11-16T09:52:04.979Z caller=tls_config.go:277 level=info msg="TLS is disabled." http2=false address=[::]:9100[root@node node_exporter]# ss -tlnp  | grep 9100
LISTEN     0      1024      [::]:9100                  [::]:*                   users:(("node_exporter",pid=8414,fd=3))
配置node_exporter为systemd管理
[root@node node_exporter]# vim /usr/lib/systemd/system/node_exporter.service
[Unit]
Description=node_exporter
After=network.target [Service]
ExecStart=/usr/local/node_exporter/node_exporter
Restart=on-failure[Install]
WantedBy=multi-user.target[root@node node_exporter]# systemctl daemon-reload
[root@node node_exporter]# systemctl start node_exporter
[root@node node_exporter]# ss -tlnp  | grep 9100
LISTEN     0      1024      [::]:9100                  [::]:*                   users:(("node_exporter",pid=8675,fd=3))
服务端配置文件添加监控项:
普罗米修斯服务端配置文件添加监控项
[root@prometheus prometheus]# vim prometheus.yml
……
scrape_configs:# The job name is added as a label `job=<job_name>` to any timeseries scraped from this config.- job_name: "prometheus"# metrics_path defaults to '/metrics'# scheme defaults to 'http'.static_configs:- targets: ["localhost:9090"]# 添加以下内容- job_name: "node_exporter"static_configs:# 如果有多个机器,用','分开- targets: ['192.168.58.142:9100']# 重启prometheus服务
[root@prometheus prometheus]# systemctl restart prometheus
浏览器刷新查看

监控mysql(mysqld-exporter):
客户端安装mysql:
# 安装mysqld-exporter
[root@node ~]# wget https://github.com/prometheus/mysqld_exporter/releases/download/v0.15.0/mysqld_exporter-0.15.0.linux-amd64.tar.gz
[root@node ~]# tar xf mysqld_exporter-0.15.0.linux-amd64.tar.gz -C /usr/local/
[root@node ~]# cd  /usr/local
[root@node local]# mv mysqld_exporter-0.15.0.linux-amd64 mysqld_exporter
[root@node local]# cd  mysqld_exporter
[root@node mysqld_exporter]# vim my.cnf
[client]
user=root
password=123456# 启动mysqld-exporter
[root@node mysqld_exporter]# ./mysqld_exporter --config.my-cnf="/usr/local/mysqld_exporter/my.cnf" &
[root@node mysqld_exporter]# ps -ef |grep mysqld_exporter
root       3447   3398  0 01:31 pts/1    00:00:02 ./node_exporter
root       4647   3398  0 02:13 pts/1    00:00:00 ./mysqld_exporter --config.my-cnf=/usr/local/mysqld_exporter/my.cnf[root@node /usr/local/mysqld_exporter]# ss -lntp |grep 4647
LISTEN     0      128         :::9104                    :::*                   users:(("mysqld_exporter",pid=4647,fd=3))
# 启动后会监听9104端口普罗米修斯服务端配置文件添加监控项
[root@prometheus prometheus]# vim prometheus.yml - job_name: 'mysql'static_configs:- targets: ['192.168.58.142:9104']
[root@prometheus prometheus]# systemctl restart prometheus
使用Grafana展示Prometheus 数据
下载并安装Grafana安装包
[root@prometheus ~]# wget https://mirrors.tuna.tsinghua.edu.cn/grafana/yum/rpm/Packages/grafana-10.0.0-1.x86_64.rpm
[root@prometheus ~]# yum install initscripts fontconfig -y
[root@prometheus ~]# yum install -y grafana-10.0.0-1.x86_64.rpm
[root@prometheus ~]# systemctl status grafana-server.service
[root@prometheus ~]# systemctl start grafana-server.service
[root@prometheus ~]# ss -tlnp |grep grafana |grep LISTEN
LISTEN     0      128       [::]:3000                  [::]:*                   users:(("grafana",pid=40768,fd=9))
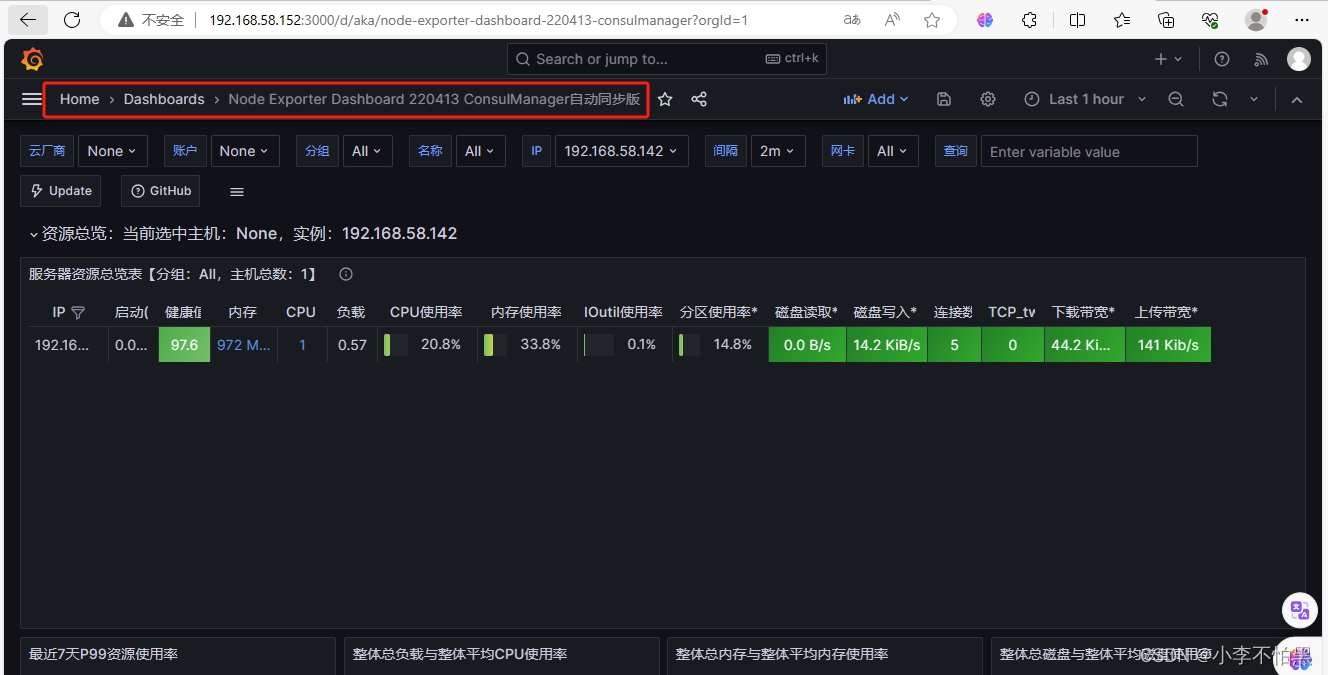
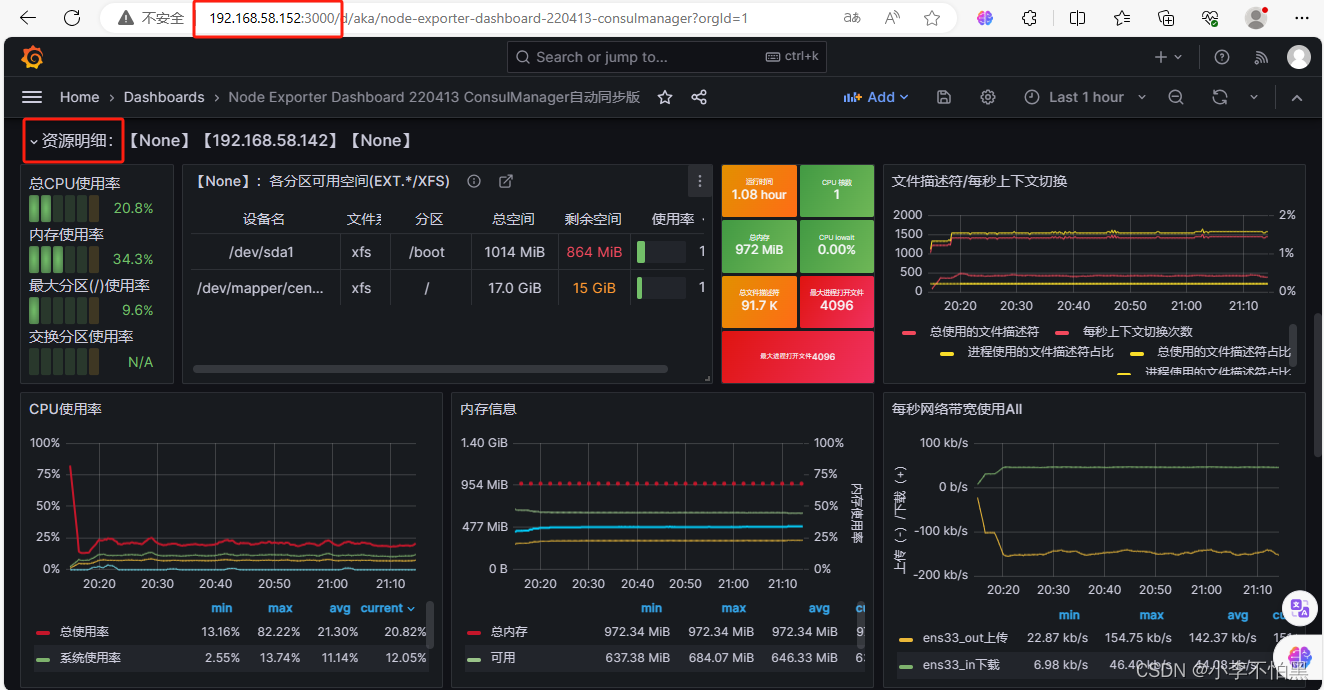
浏览器访问:192.168.58.152:3000
用户名: admin 密码: admin
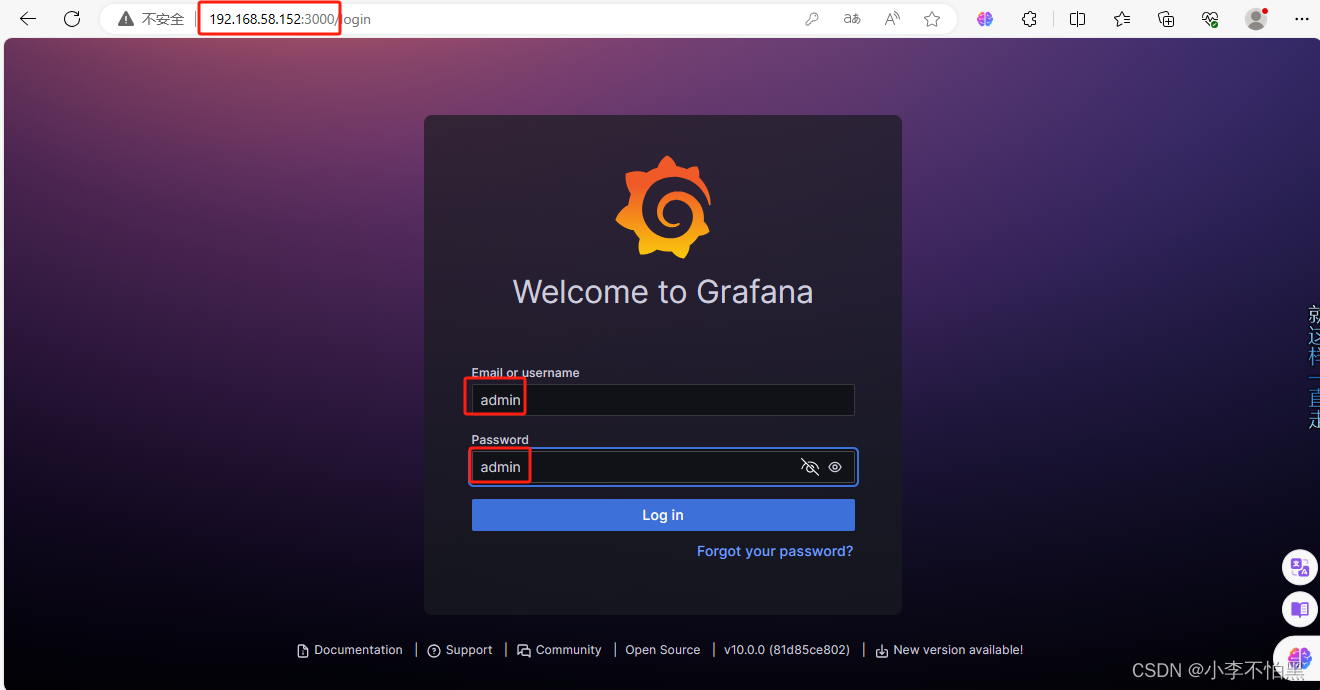
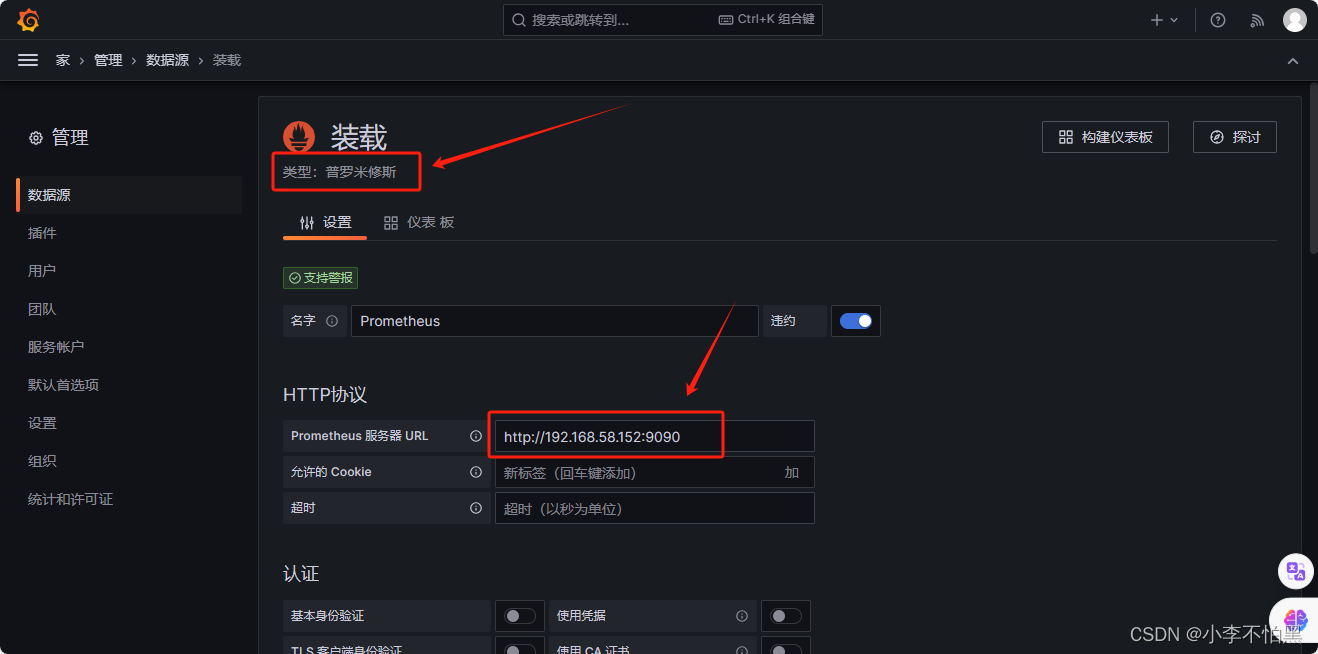
登录成功之后添加数据源


填写prometheus的地址,然后点击最下面的save & test
-
dashboards查找地址:
https://grafana.com/grafana/dashboards/ -
例如:8919,12227;输入id: 然后点击Load
在仪表盘导入