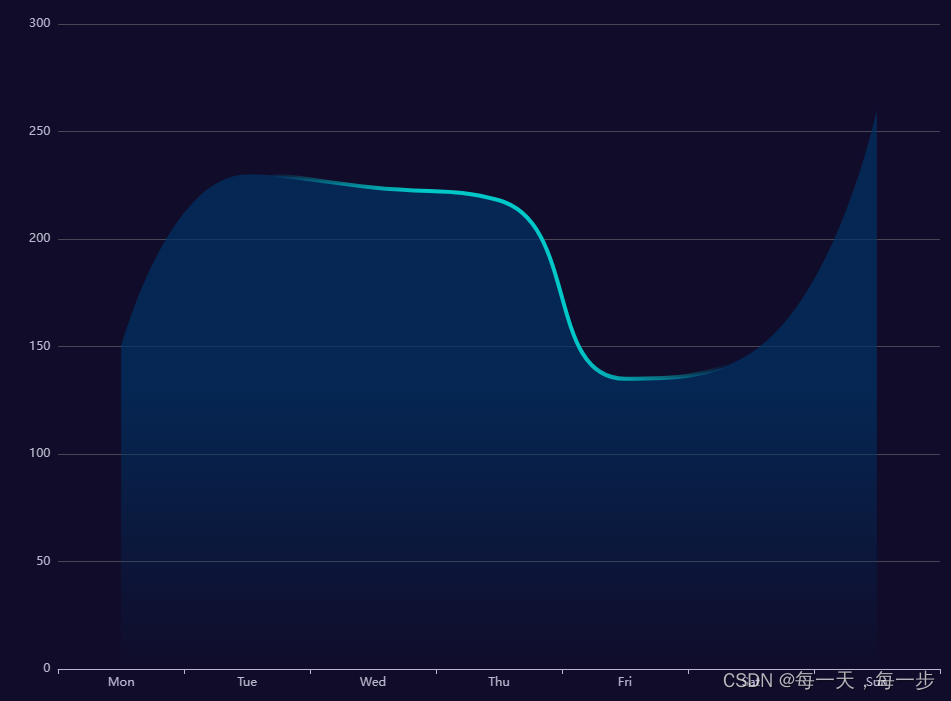
想要如图所示的折线图,折线线条为渐变颜色,两边颜色接近区域面积的颜色,中间颜色亮度高一些,在series中使用lineStyle,将其color设置为渐变色:
option = {xAxis: {type: 'category',data: ['Mon', 'Tue', 'Wed', 'Thu', 'Fri', 'Sat', 'Sun']},yAxis: {type: 'value'},series: [{smooth: true,showSymbol: false, // 只有在 tooltip hover 的时候显示symbollineStyle: { // 线条样式normal: {width: 4,color: new echarts.graphic.LinearGradient(0, 0, 1, 0, [ // 颜色渐变{offset: 0,color: 'rgb(0, 255, 255, 0)'},{offset: 0.2,color: 'rgb(0, 255, 255, 0)'},{offset: 0.4,color: 'rgb(0, 200, 200, 80)'},{offset: 0.6,color: 'rgb(0, 200, 200, 80)'},{offset: 0.8,color: 'rgb(0, 255, 255, 0)'},{offset: 1,color: 'rgb(0, 255, 255, 0)'}])}},areaStyle: { // 区域面积color: {type: 'linear',x: 0,y: 0,x2: 0,y2: 1,colorStops: [{offset: 0,color: 'rgb(0, 50, 100)' // 0% 处的颜色},{offset: 0.5,color: 'rgb(0, 50, 100, 50)' // 50% 处的颜色},{offset: 1,color: 'rgb(0, 50, 100, 0)' // 100% 处的颜色}]}},data: [150, 230, 224, 218, 135, 147, 260],type: 'line'}]
};
