x=20:20:140;a=[0.85, 2.2, 3.45, 2.65, 1.5, 1.9, 1.25]; plot(x,a,'-*b');
axis([0,160,0,4])
set(gca,'XTick',[0:20:160])
set(gca,'YTick',[0:1:4])
legend('position1');
xlabel('爬行量(cm)')
ylabel('误差(%)')

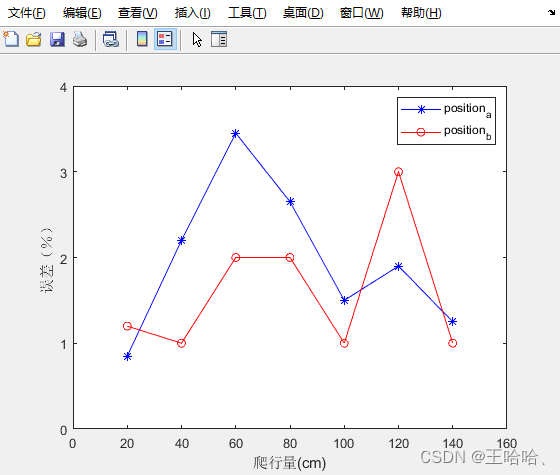
x=20:20:140;
a=[0.85, 2.2, 3.45, 2.65, 1.5, 1.9, 1.25];
b=[1.2, 1, 2, 2, 1, 3, 1];
plot(x,a,'-*b', x,b,'-or');
axis([0,160,0,4])
set(gca,'XTick',[0:20:160])
set(gca,'YTick',[0:1:4])
legend('position_a','position_b');
xlabel('爬行量(cm)')
ylabel('误差(%)')

x=120:120:840;
a=[0.17, 0.38, 0.44, 0.30, 0.36, 0.49, 0.32];
b=[0.01, 0.03, 0.12, 0.22, 0.12, 0.13, 0.02];
plot(x,a,'-*b', x,b,'-or');
axis([0,840,0,0.6])
set(gca,'XTick',[0:120:840])
set(gca,'YTick',[0:0.1:0.6])
legend('人工测量方法','本文测量方法');
xlabel('爬行量(mm)')
ylabel('误差绝对值(mm)')


