1、代码
<!DOCTYPE html>
<html>
<head><meta charset="utf-8"><title>第一个 ECharts 实例</title><!-- 引入 echarts.js --><script src="https://cdn.staticfile.org/echarts/4.3.0/echarts.min.js"></script>
</head>
<body><!-- 为ECharts准备一个具备大小(宽高)的Dom --><div id="main" style="width: 600px;height:400px;"></div><script type="text/javascript">// 基于准备好的dom,初始化echarts实例var myChart = echarts.init(document.getElementById('main'));// 指定图表的配置项和数据var option = {title: {text: '动态数据',subtext: '纯属虚构'},color:['#966F57','#DADE99','#B3CAFF','#526482','#92A2BD'],tooltip: {trigger: 'axis',axisPointer: {type: 'cross',label: {backgroundColor: '#283b56'}}},legend: {data:['不良率','队列','队列2','不良率2','不良率3','不良率4']},dataZoom: {show: false,start: 0,end: 100},xAxis: [{type: 'category',boundaryGap: true,data: (function (){var now = new Date();var res = [];var len = 10;while (len--) {res.unshift(now.toLocaleTimeString().replace(/^\D*/,''));now = new Date(now - 2000);}return res;})()}],yAxis: [{type: 'value',scale: true,name: '不良率',min: 0,boundaryGap: [0.2, 0.2],axisLabel: {formatter: function (value) {return value.toFixed(2)+'%';}}},{type: 'value',scale: true,name: '预购量',min: 0,boundaryGap: [0.2, 0.2],splitLine:{show:false}}],series: [{name:'队列',type:'bar',yAxisIndex: 1,stack:'one',data:(function (){var res = [];var len = 10;while (len--) {res.push(Math.round(Math.random() * 1000));}return res;})()},{name:'队列2',type:'bar',yAxisIndex: 1,stack:'one',data:(function (){var res = [];var len = 10;while (len--) {res.push(Math.round(Math.random() * 1000));}return res;})()},{name:'不良率',type:'line',data:(function (){var res = [];var len = 0;while (len < 10) {res.push((Math.random()*10 + 5).toFixed(1) - 0);len++;}return res;})(),label:{show:true,formatter: '{c}%'  }},{name:'不良率2',type:'line',data:(function (){var res = [];var len = 0;while (len < 10) {res.push((Math.random()*10 + 5).toFixed(1) - 0);len++;}return res;})(),label:{show:true,formatter: '{c}%'  }},{name:'不良率3',type:'line',data:(function (){var res = [];var len = 0;while (len < 10) {res.push((Math.random()*10 + 5).toFixed(1) - 0);len++;}return res;})(),label:{show:true,formatter: '{c}%'  }},{name:'不良率4',type:'line',data:(function (){var res = [];var len = 0;while (len < 10) {res.push((Math.random()*10 + 5).toFixed(1) - 0);len++;}return res;})(),label:{show:true,formatter: '{c}%'  }}]
};// 使用刚指定的配置项和数据显示图表。myChart.setOption(option);</script>
</body>
</html>
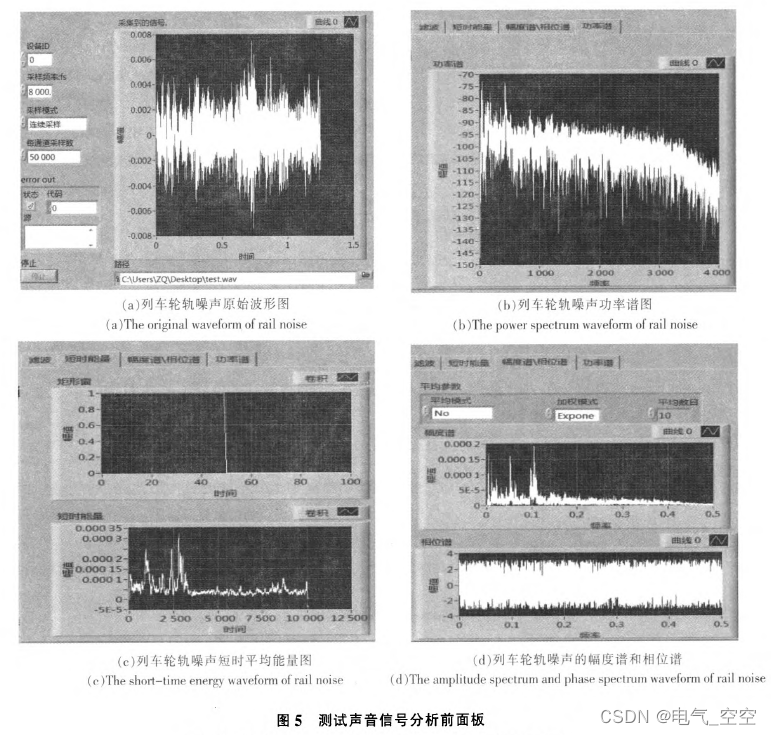
2、预览图


