公众号:尤而小屋
作者:Peter
编辑:Peter
大家好,我是Peter~
好久没有更新关于plotly的文章。
什么是Plotly?
Plotly是一个基于JavaScript的绘图库,可以创建各种类型的图表,包括散点图、折线图、面积图、条形图、误差线、箱线图、直方图、热图、子图、多轴图、极坐标图和气泡图等。
它提供了非常多的编程接口,使用户能够自定义数据、形状、颜色等属性。
1 基于plotly绘制金融图形
https://plainenglish.io/blog/a-simple-guide-to-plotly-for-plotting-financial-chart-54986c996682
本文就给大家介绍如何使用plotly绘制各种金融图形,具体内容:

In [1]:
import pandas as pd
import numpy as npimport plotly_express as px
import plotly.graph_objects as gofrom datetime import datetime# yfinance 是一个流行的开源库,用于访问雅虎财经上可用的财务数据
import yfinance as yf
2 导入数据
网络OK的话,可以使用下面的代码直接从yfinance直接下载数据,然后保存到data.csv文件中。
In [2]:
# name = "AAPL"  # 指定公司名字# apple = yf.download(name, start="2021-01-01",end="2023-11-15")
# apple.to_csv("data.csv",index=False)
在这里直接读取已经保存的data.csv:
In [3]:
df = pd.read_csv("data.csv")
df.head()

3 线型图-Close
3.1 基础线型图
观察指标随着时间的变化趋势
In [4]:
fig = px.line(df,x="Date",y="Close")# 设置图表的标题和其他参数
fig.update_layout(title='Close of APPLE', xaxis=dict(title='Date'), yaxis=dict(title='Close'),title_x=0.5,  # X位置 title_y=0.95)  # Y位置  fig.show()

基于graph_objects实现
In [5]:
fig = go.Figure(data=[go.Scatter(x=df["Date"].tolist(), y=df["Close"].tolist())])# 设置图表的标题和其他参数
fig.update_layout(title='Close of APPLE', xaxis=dict(title='Date'), # x-y标题的两种写法yaxis_title='Close',title_x=0.5,  # X位置 title_y=0.9)  # Y位置  fig.show()

3.2 进阶线型图:指定x轴区间
In [6]:
fig = px.line(df,x="Date",y="Close",range_x = ["2021-06-01","2021-11-17"] # 优化点:指定x轴显示范围)fig.update_layout(title='Close of APPLE', xaxis=dict(title='Date'), yaxis=dict(title='Close'),title_x=0.5, title_y=0.95) fig.show()

上图中,x轴在指定的区间内显示
3.3 进阶线型图:隐藏日期或时间段
可以是隐藏具体的某天,也可以是隐藏周末,或者每天中的非交易时间段等:
In [7]:
# 1-隐藏时间段fig = px.line(df,x="Date",y="Close",range_x = ["2021-06-01", "2021-07-15"]  # 指定区间
)fig.update_xaxes(rangebreaks=[dict(bounds=["sat","sun"]),  #  优化点:隐藏周六和周日dict(values=["2021-06-04","2021-06-09","2021-06-22","2021-07-05"]) # 隐藏具体日期])fig.show()

# 2-隐藏非交易时间段fig = px.line(df,x="Date",y="Close",range_x = ["2021-06-01", "2021-07-15"]
)fig.update_xaxes(rangebreaks=[dict(bounds=[15,9]),  #  优化点:排除下午15点到第二天9点的时间h])fig.show()

因为本文的数据是以日为单位,没有精确到小时,所以没有看到实际效果。
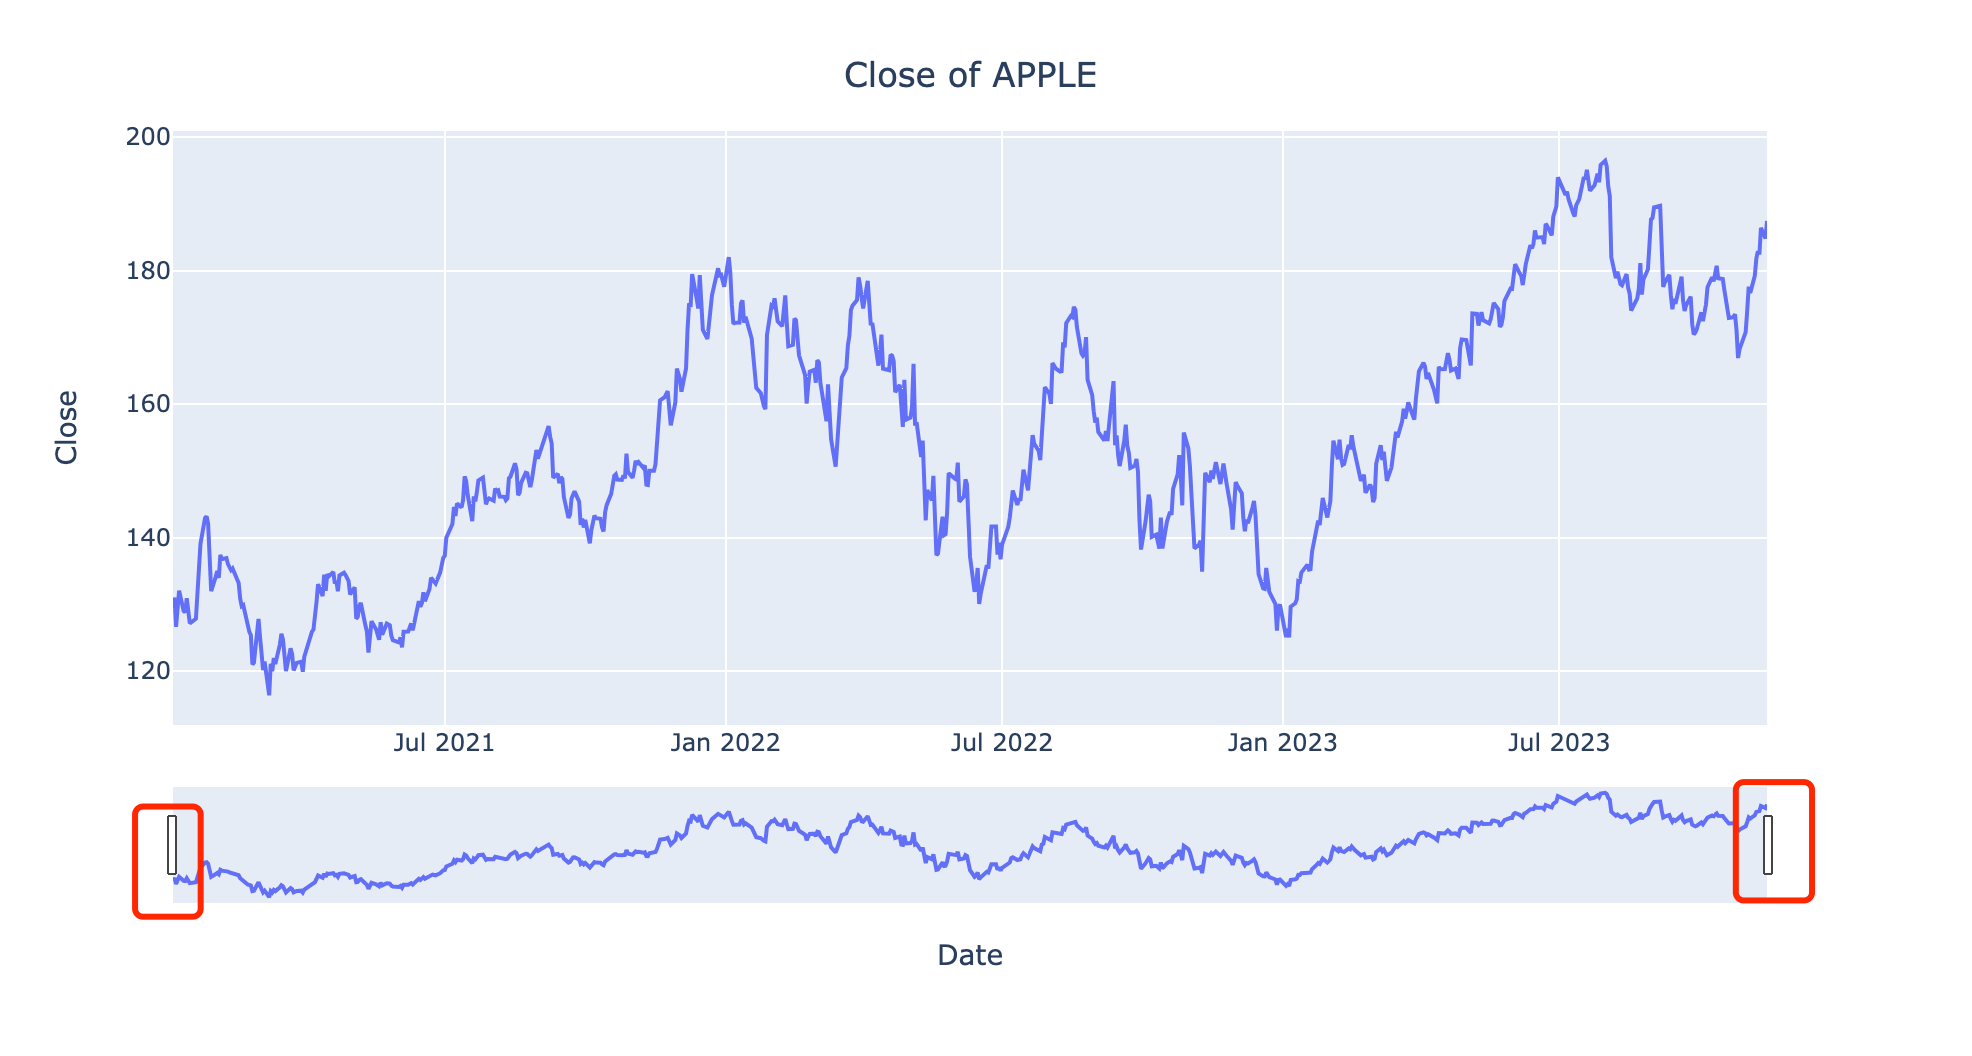
3.4 进阶线型图:是否开启区间滑块
In [9]:
fig = px.line(df,x="Date",y="Close")# 区间滑块的开启或者关闭;【默认】关闭滑动区间
fig.update_xaxes(rangeslider_visible=True)  fig.update_layout(title='Close of APPLE', xaxis=dict(title='Date'), yaxis=dict(title='Close'),title_x=0.5,  title_y=0.95)  fig.show()
3.5 进阶线型图:滑块和时间按钮显示
In [10]:
fig = px.line(df,x="Date",y="Close")fig.update_xaxes(rangeslider_visible=True, # 优化1: 区间滑块【默认】关闭滑动区间rangeselector=dict(buttons=list([ # 优化2:时间按钮dict(count=1, label="1m", step="month", stepmode="backward"), # 往前推一个月dict(count=6, label="6m", step="month", stepmode="backward"), # 往前推6个月dict(count=1, label="YTD", step="year", stepmode="todate"), # 只显示今年数据dict(count=1, label="1y", step="year", stepmode="backward"), # 显示过去一年的数据dict(step="all") # 显示全部数据]))) fig.update_layout(title='Close of APPLE with Rangeslider & Buttons', xaxis=dict(title='Date'), yaxis=dict(title='Close'),title_x=0.5, title_y=0.95) fig.show()

4 柱状图-Volume
Volume一般用柱状图来显示
4.1 基础柱状图
In [11]:
# 为了显示方便,在这里取了前面100个数据点
fig = px.bar(df[:100],x="Date",y="Volume")   # 设置标题及参数
fig.update_layout(title='Volume of APPLE', xaxis=dict(title='Date'), yaxis=dict(title='Volume'),title_x=0.5,  # X位置 title_y=0.95)  # Y位置  fig.show()

下面是基于基于graph_objects的实现:
In [12]:
# 基于graph_objects实现:使用完整数据fig = go.Figure(data=[go.Bar(x=df["Date"].tolist(), y=df["Volume"].tolist())])fig.update_layout(title='Volume of APPLE', xaxis=dict(title='Date'), yaxis_title='Volume',title_x=0.5, title_y=0.9) fig.show()

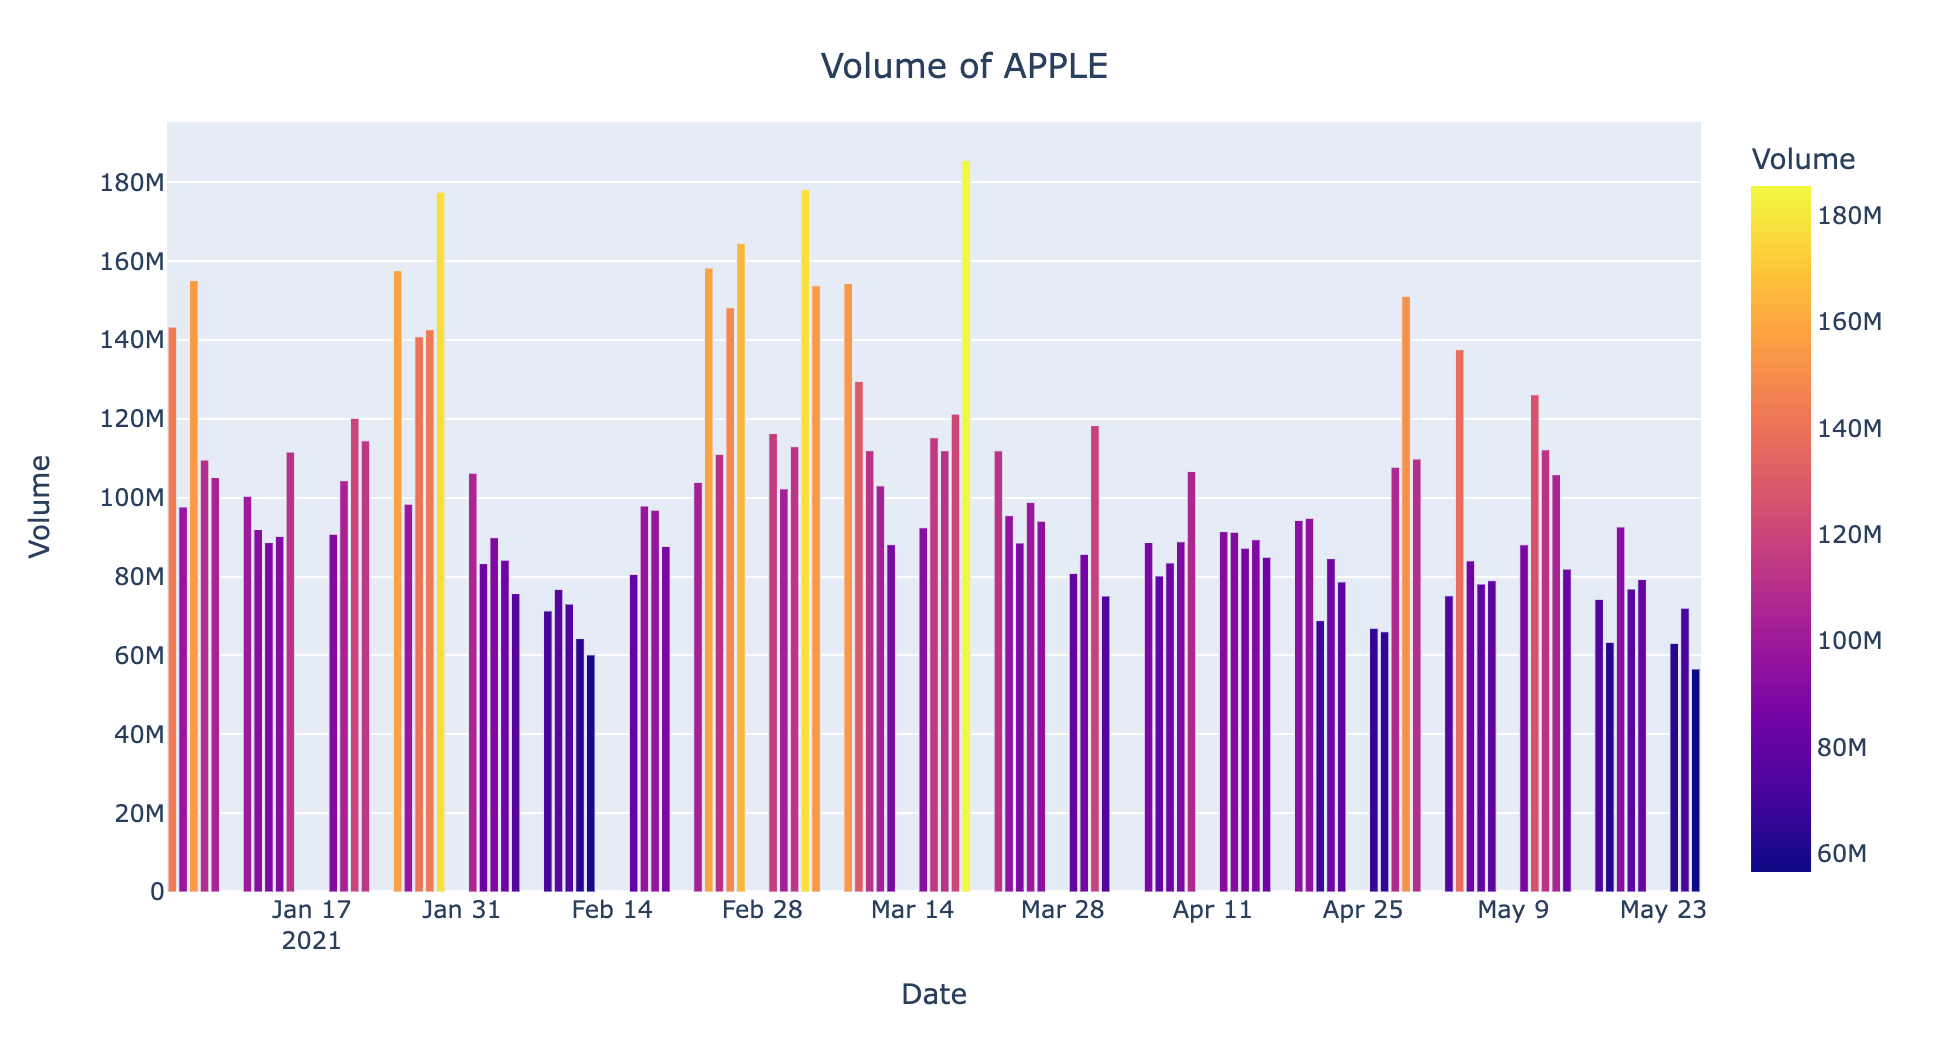
4.2 进阶柱状图
柱子的颜色深浅代表成交量的大小
In [13]:
# 为了显示方便,在这里取前100个数据点
fig = px.bar(df[:100], x="Date", y="Volume", color="Volume")     # 设置标题及参数
fig.update_layout(title='Volume of APPLE', xaxis=dict(title='Date'), yaxis=dict(title='Volume'),title_x=0.5,  # X位置 title_y=0.95)  # Y位置  fig.show()
5 直方图-Open
5.1 基础直方图histogram
In [14]:
fig = px.histogram(df,x="Date",y="Open",histfunc="avg"
)fig.update_layout(title='Open of APPLE with Histogram', xaxis=dict(title='Date'), yaxis_title='Open',title_x=0.5,  title_y=0.95
)  fig.show()

可以看到上面的图形很紧凑,展示效果很差;下面我们进行调整:
5.2 进阶直方图:柱体设置
In [15]:
fig = px.histogram(df,x="Date",y="Open",histfunc="avg"
)# 优化点:x轴按月显示
fig.update_traces(xbins_size="M1")  # 优化点:x轴刻度设置
fig.update_xaxes(showgrid=False, dtick="M1",  # 按月显示ticklabelmode="period",   # instant  periodtickformat="%b\n%Y"   # 标签显示模式
)fig.update_layout(title='Open of APPLE with Histogram', xaxis=dict(title='Date'), yaxis_title='Open',title_x=0.5,  title_y=0.95,bargap=0.1  # 优化点:每个柱状图间隔
)  fig.show()

5.3 进阶直方图:添加轨迹图
In [16]:
fig = px.histogram(df,x="Date",y="Open",histfunc="avg"
)# 优化点:x轴按月显示
fig.update_traces(xbins_size="M1")  # 优化点:x轴刻度设置
fig.update_xaxes(showgrid=False, dtick="M1",  # 按月显示ticklabelmode="period",   # instant  periodtickformat="%b\n%Y"   # 标签显示模式
)fig.update_layout(title='Open of APPLE with Histogram', xaxis=dict(title='Date'), yaxis_title='Open',title_x=0.5,  title_y=0.95,bargap=0.05  # 优化点:每个柱状图间隔
)  # 重点优化:添加轨迹
fig.add_trace(go.Scatter(mode="lines",x=df["Date"],y=df["Open"],name="Open Trace of APPLE"
))fig.show()

6 Candlestick图
In [17]:
df.columns
Out[17]:
Index(['Date', 'Open', 'High', 'Low', 'Close', 'Adj Close', 'Volume'], dtype='object')
6.1 默认图形
In [18]:
fig = go.Figure(data=[go.Candlestick(x=df['Date'], # 日期open=df['Open'], # 开盘、最高价、最低价、收盘价high=df['High'],low=df['Low'],close=df['Close'])])fig.show()

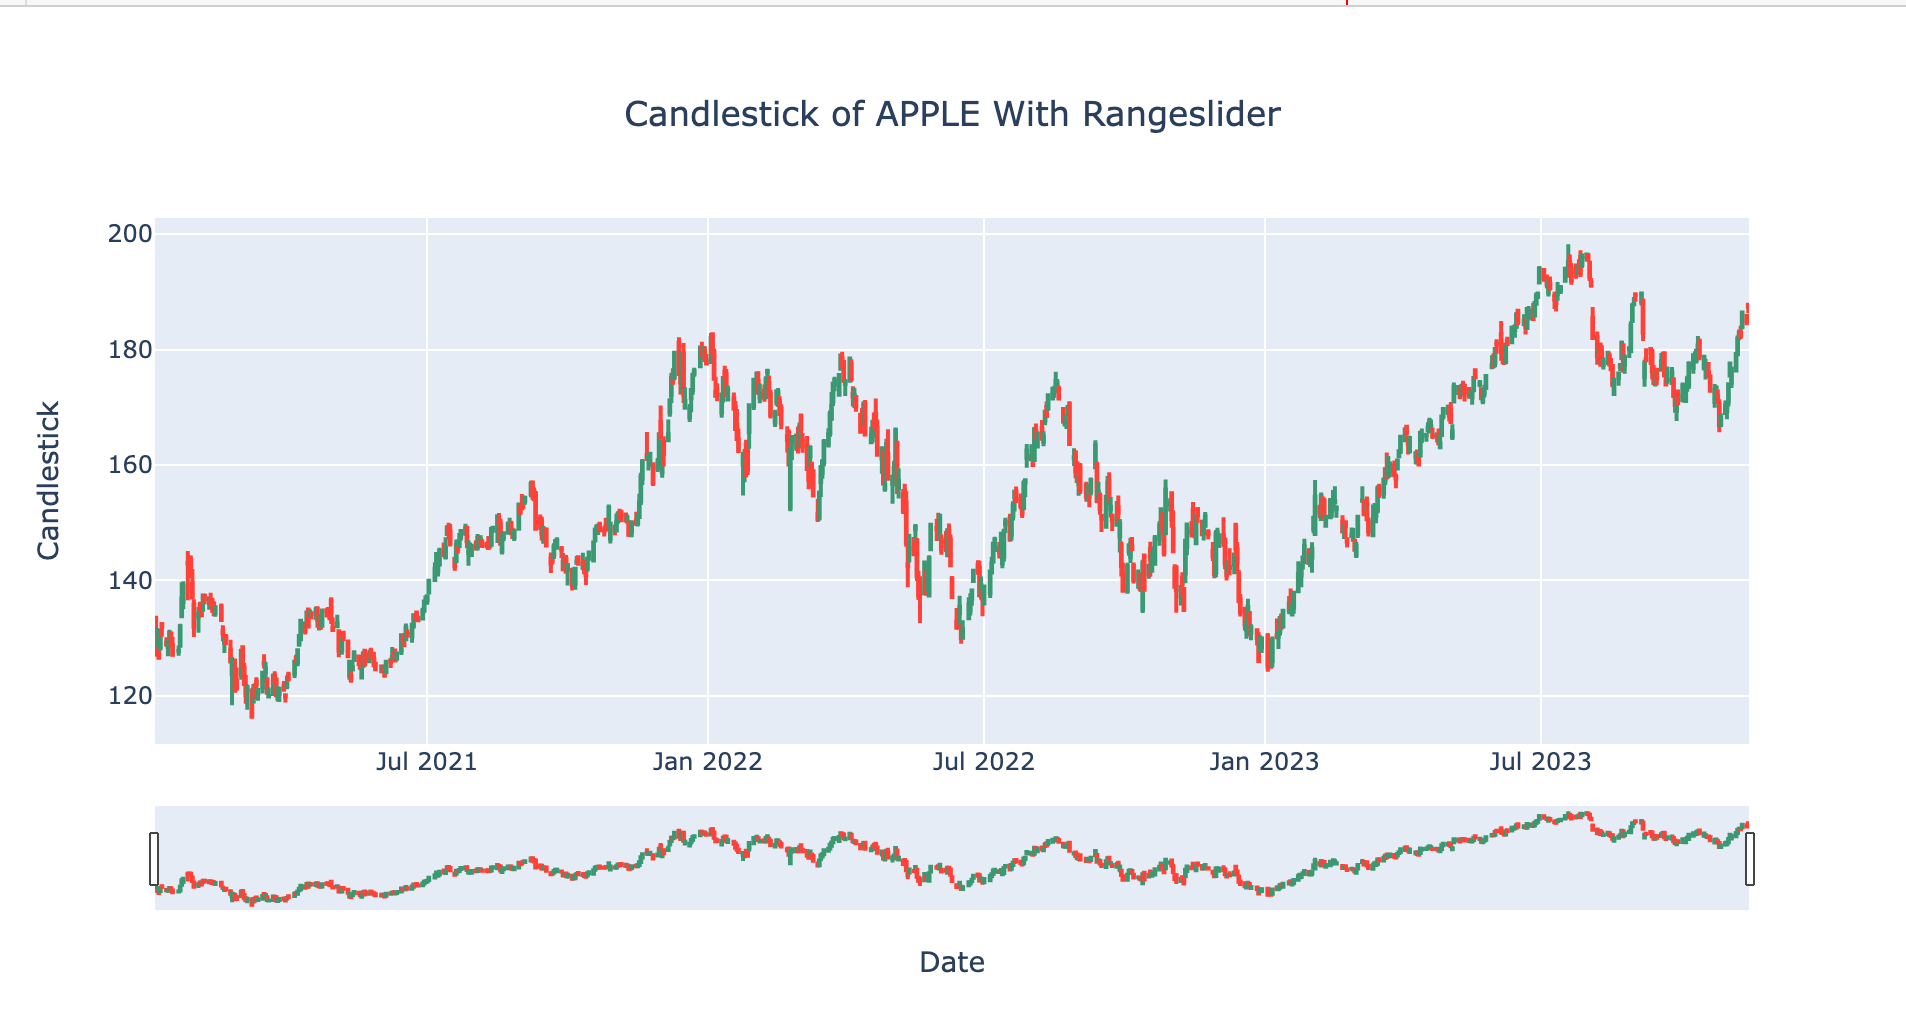
6.2 自定义xy轴信息
In [19]:
fig = go.Figure(data=[go.Candlestick(x=df['Date'],  # 日期open=df['Open'],  # 开盘、最高价、最低价、收盘价high=df['High'],low=df['Low'],close=df['Close'])])fig.update_layout(title='Candlestick of APPLE With Rangeslider', xaxis=dict(title='Date'), yaxis=dict(title='Candlestick'),title_x=0.5,  title_y=0.92,xaxis_rangeslider_visible=True  # 【默认】显示x轴的滑动条
)  fig.show()
6.3 不带滑动块的K线
In [20]:
fig = go.Figure(data=[go.Candlestick(x=df['Date'],open=df['Open'], high=df['High'],low=df['Low'], close=df['Close']
)])fig.update_layout(title='Candlestick of APPLE Without Rangeslider', xaxis=dict(title='Date'), yaxis=dict(title='Candlestick'),title_x=0.5,  title_y=0.92,xaxis_rangeslider_visible=False  # 隐藏x轴的滑动条
)  fig.show()

6.4 自定义颜色
在绘制k线图的时候,默认每天的涨跌使用的是红绿色,其实可以使用自定义的颜色:
In [21]:
fig = go.Figure(data=[go.Candlestick(x=df['Date'],open=df['Open'], high=df['High'],low=df['Low'], close=df['Close'],increasing_line_color="cyan",  # 自定义涨跌颜色decreasing_line_color="gray"
)])fig.update_layout(title='Candlestick of APPLE With Custom Colors', xaxis=dict(title='Date'), yaxis=dict(title='Candlestick'),title_x=0.5,  title_y=0.92
)  fig.show()

6.5 添加自定义区间、文本和标注
In [22]:
fig = go.Figure(data=[go.Candlestick(x=df['Date'],open=df['Open'], high=df['High'],low=df['Low'], close=df['Close']
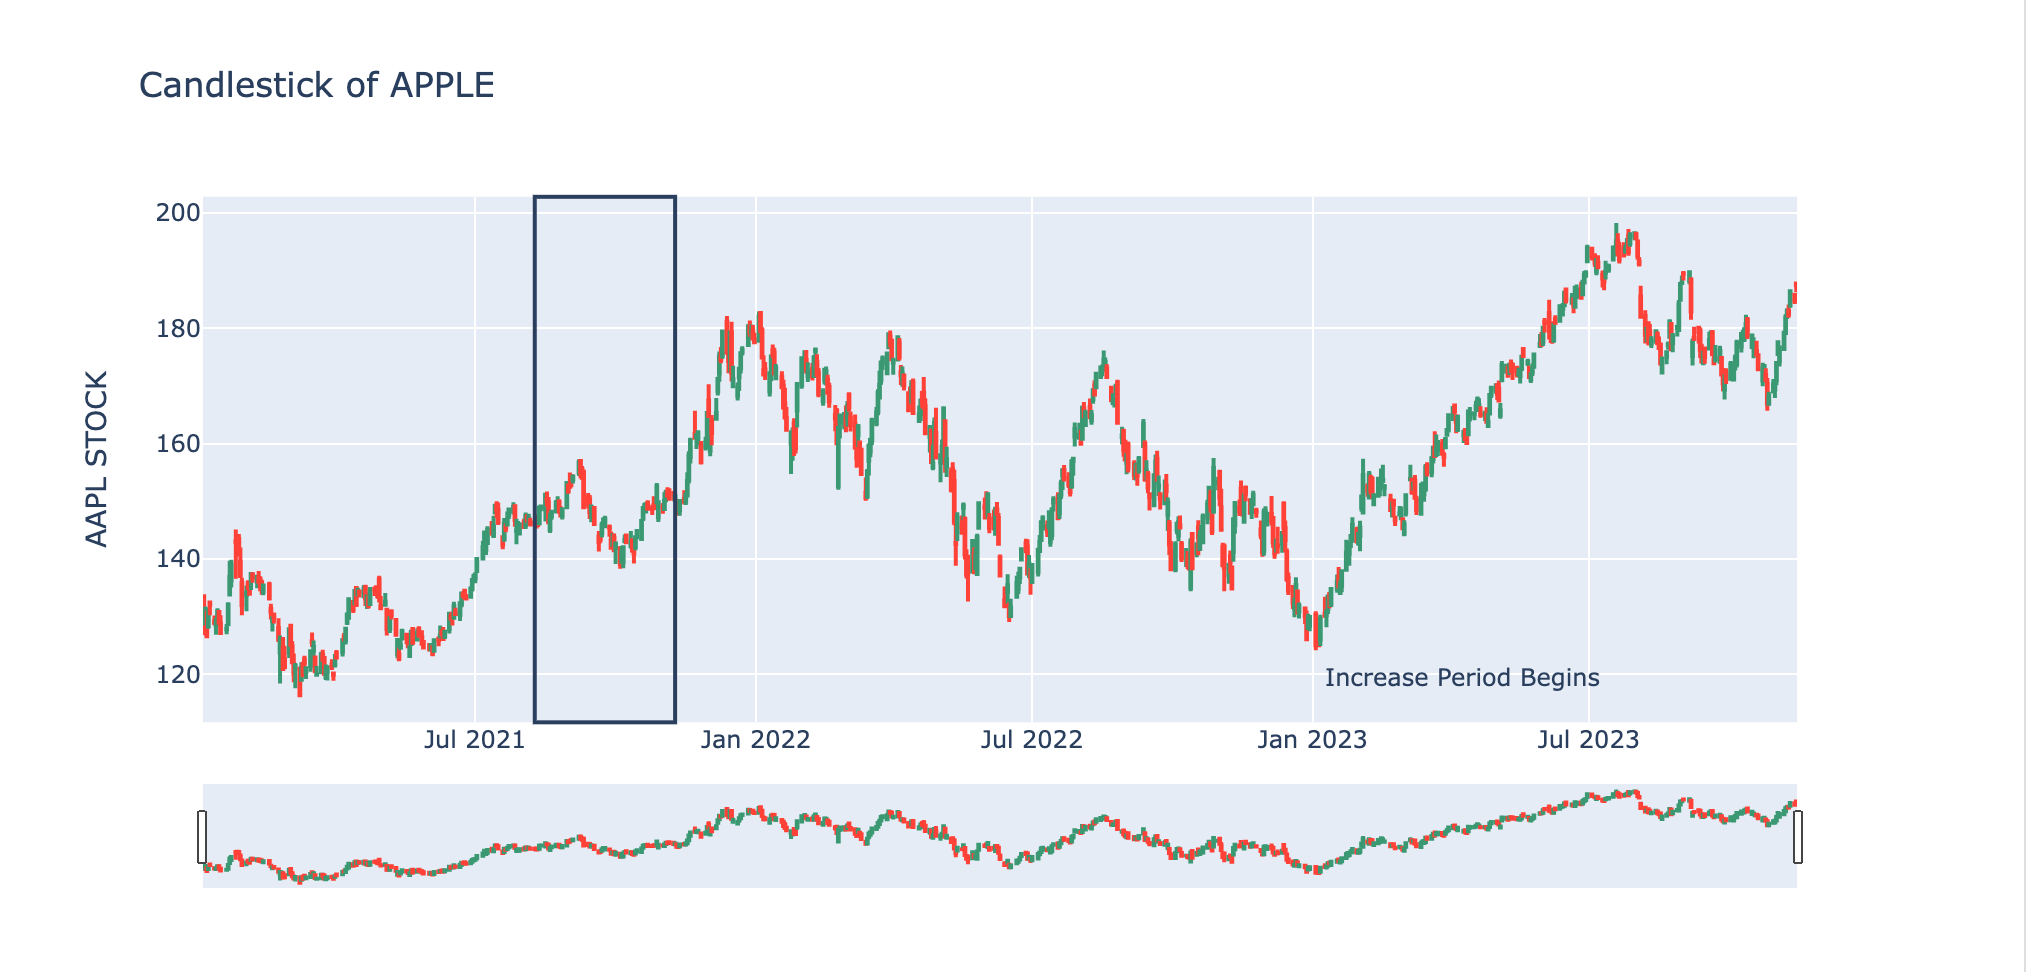
)])fig.update_layout(title="Candlestick of APPLE",yaxis_title="AAPL STOCK",# 添加shapeshapes = [dict(x0='2021-08-09', x1='2021-11-09', # x轴范围y0=0, y1=1, xref='x', yref='paper',line_width=2)],# 添加文本annotations=[dict(x='2023-01-06', y=0.05, xref='x', yref='paper',showarrow=False, xanchor='left', text='Increase Period Begins')])  fig.show()
6.6 隐藏周六周日
In [23]:
fig = go.Figure(data=[go.Candlestick(x=df['Date'], # 日期open=df['Open'], # 开盘、最高价、最低价、收盘价high=df['High'],low=df['Low'],close=df['Close'])])fig.update_layout(xaxis_rangeslider_visible=False) # x轴滑动块不显示fig.update_xaxes(rangebreaks=[dict(bounds=["sat", "mon"])]) # 隐藏周六周日fig.show()

7 添加滑动均值Moving
In [24]:
df['MA20'] = df['Close'].rolling(window=3).mean()
df['MA5'] = df['Close'].rolling(window=3).mean()
In [25]:
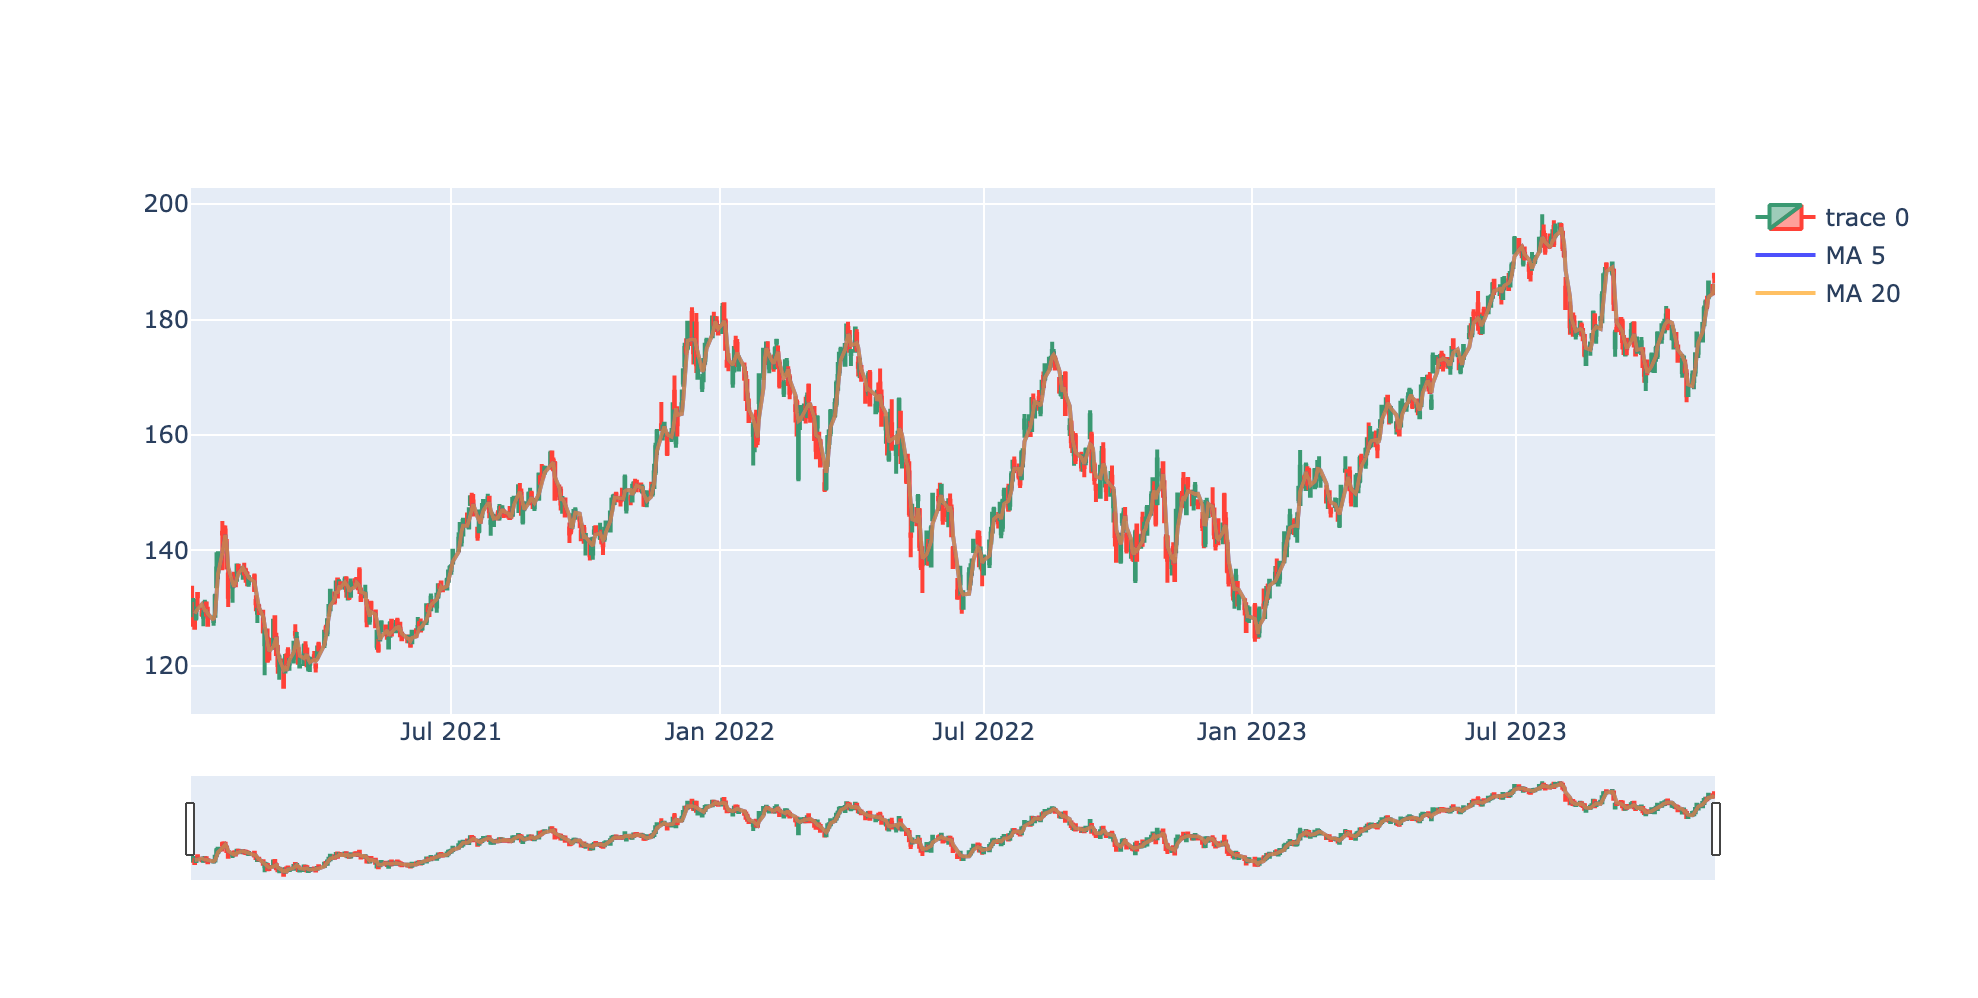
fig = go.Figure(data=[go.Candlestick(x=df['Date'],  # 日期open=df['Open'],  # 开盘、最高价、最低价、收盘价high=df['High'],low=df['Low'],close=df['Close'],# showlegend=False  # 如果想不显示图例trace0,使用该语句
)])fig.add_trace(go.Scatter(x=df['Date'], y=df['MA5'],opacity=0.7,line=dict(color='blue', width=2),name='MA 5'))
fig.add_trace(go.Scatter(x=df['Date'], y=df['MA20'],opacity=0.7,line=dict(color='orange', width=2),name='MA 20'))fig.show()
8 MACD指标
MACD图是一种股票技术分析图,其计算方法是根据收盘时股价或指数的快速(短期,一般是12天)和慢速(长期,一般是26天)移动平均值(EMA)之间的差值来得出。它表示股票市场趋势的变化:
- 当MACD线上穿信号线(零线)时,表示中短期上涨信号;
- 当MACD线下穿信号线时,表示中短期下跌信号
pandas中是通过使用pd.ewm计算移动平均值。
In [26]:
# 针对收盘价Close的操作short = 12
long = 26  df["Short_EWM"] = df["Close"].ewm(span=short).mean()
df["Long_EWM"] = df["Close"].ewm(span=long).mean()
In [27]:
df["MACD"] = df["Short_EWM"] - df["Long_EWM"]
然后根据MACD曲线计算信号线:
signal_line是MACD指标中的一部分,表示的是讯号线。它是将MACD线(即DIF和DEM的差异)通过一个特定长度(一般是9)的EMA平滑处理后得到的曲线。讯号线的作用是用来反映市场趋势的变化,当讯号线向上穿过MACD线时,通常被认为是买入信号;当讯号线向下穿过MACD线时,通常被认为是卖出信号。
In [28]:
m = 9df['Signal_Line'] = df['MACD'].ewm(span=m).mean()
In [29]:
df["Flag"] = df['MACD'] - df['Signal_Line']
In [30]:
# fig.add_trace(go.Scatter(x=df['Date'], y=df['MACD'], name='MACD Line'))
# fig.add_trace(go.Scatter(x=df['Date'], y=df['Signal_Line'], name='Signal Line'))
# fig.add_trace(go.Bar(x=df['Date'], y=df["Flag"],name='Histogram', marker_color="green"))
In [31]:
# 绘制MACD曲线图
trace1 = go.Scatter(x=df['Date'], y=df['MACD'], mode='lines', name='MACD Line')
trace2 = go.Scatter(x=df['Date'], y=df['Signal_Line'], mode='lines', name='Signal Line')
trace3 = go.Bar(x=df['Date'], y=df["Flag"],name='Histogram', marker_color=(df["Flag"].apply(lambda x: "green" if x >= 0 else "red")))
layout = go.Layout(title='MACD Curve', xaxis=dict(title='Date'), yaxis=dict(title='Value'))fig = go.Figure(data=[trace1, trace2,trace3], layout=layout)    fig.show()

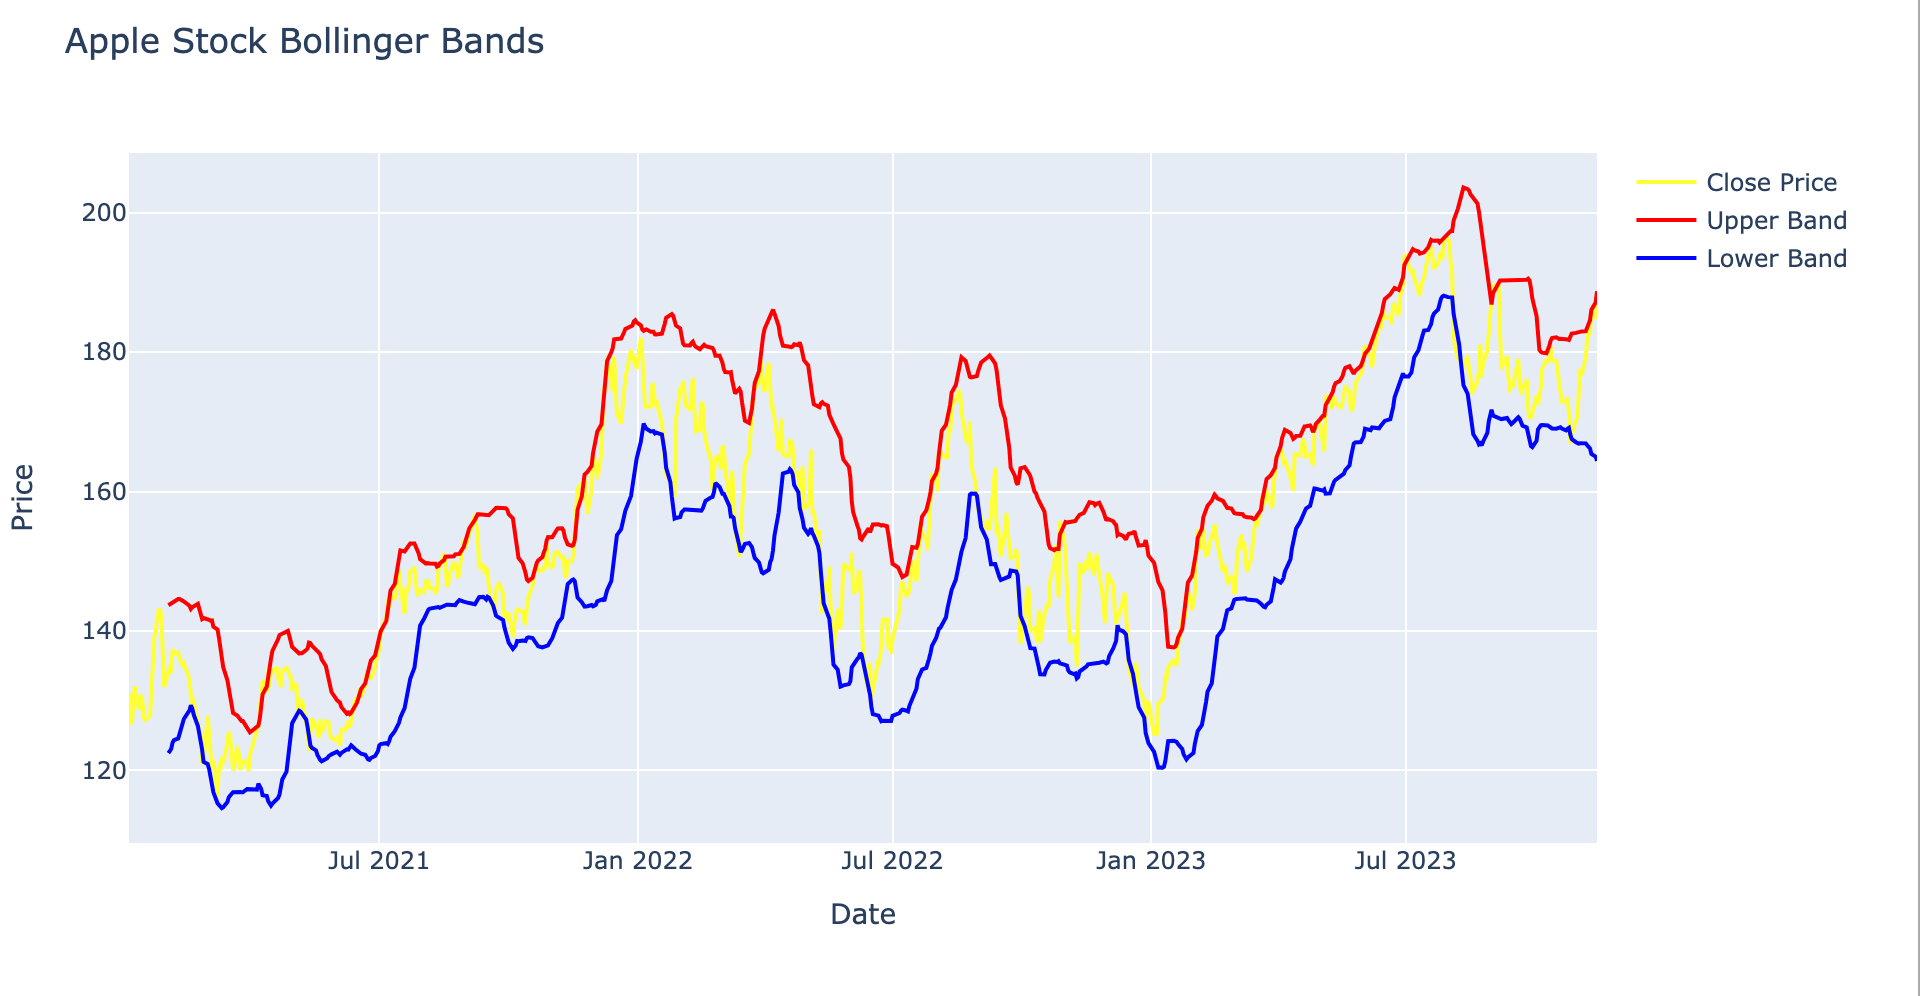
9 布林线
布林线(Boll)指标是股市技术分析的常用工具之一,通过计算股价的“标准差”,再求股价的“信赖区间”。
该线通常由上、中、下三条线组成,其中上下两条线指的就是股票价格的压力线以及支撑线,而中间的一条线是股价平均线。
在股票行情图中,这三条线会随着股价的波动而波动。布林线指标的应用可以反映股票价格的波动情况。
In [32]:
def calculate_bollinger_bands(df, window_size=20, num_std=2):"""功能:计算布林线的上、下限参数:df:给定数据window_size:表示计算移动平均线和标准差时所使用的时间窗口大小num_std:标准差倍数-用于确定上轨和下轨的宽度"""rolling_mean = df['Close'].rolling(window=window_size).mean() rolling_std = df['Close'].rolling(window=window_size).std()upper_band = rolling_mean + (rolling_std * num_std)lower_band = rolling_mean - (rolling_std * num_std)return upper_band, lower_band
In [33]:
upper_band, lower_band = calculate_bollinger_bands(df)fig = go.Figure()# 添加收盘价Close折线图
fig.add_trace(go.Scatter(x=df.Date, y=df['Close'], name='Close Price',line=dict(color="yellow")))  # 黄色-均线
# 添加上、下轨迹 upper_band, lower_band
fig.add_trace(go.Scatter(x=df.Date, y=upper_band, name='Upper Band', line=dict(color='red')))    # 上限-红色
fig.add_trace(go.Scatter(x=df.Date, y=lower_band, name='Lower Band', line=dict(color='blue')))  # 下限-蓝色# 设置图形布局
fig.update_layout(title='Apple Stock Bollinger Bands', xaxis_title='Date', yaxis_title='Price')# 显示图形
fig.show()
