抄大神杰作:QCustomplot(五)QCPAxisRect进行子绘图-CSDN博客
需求来源:试验数据需要多轴对比。
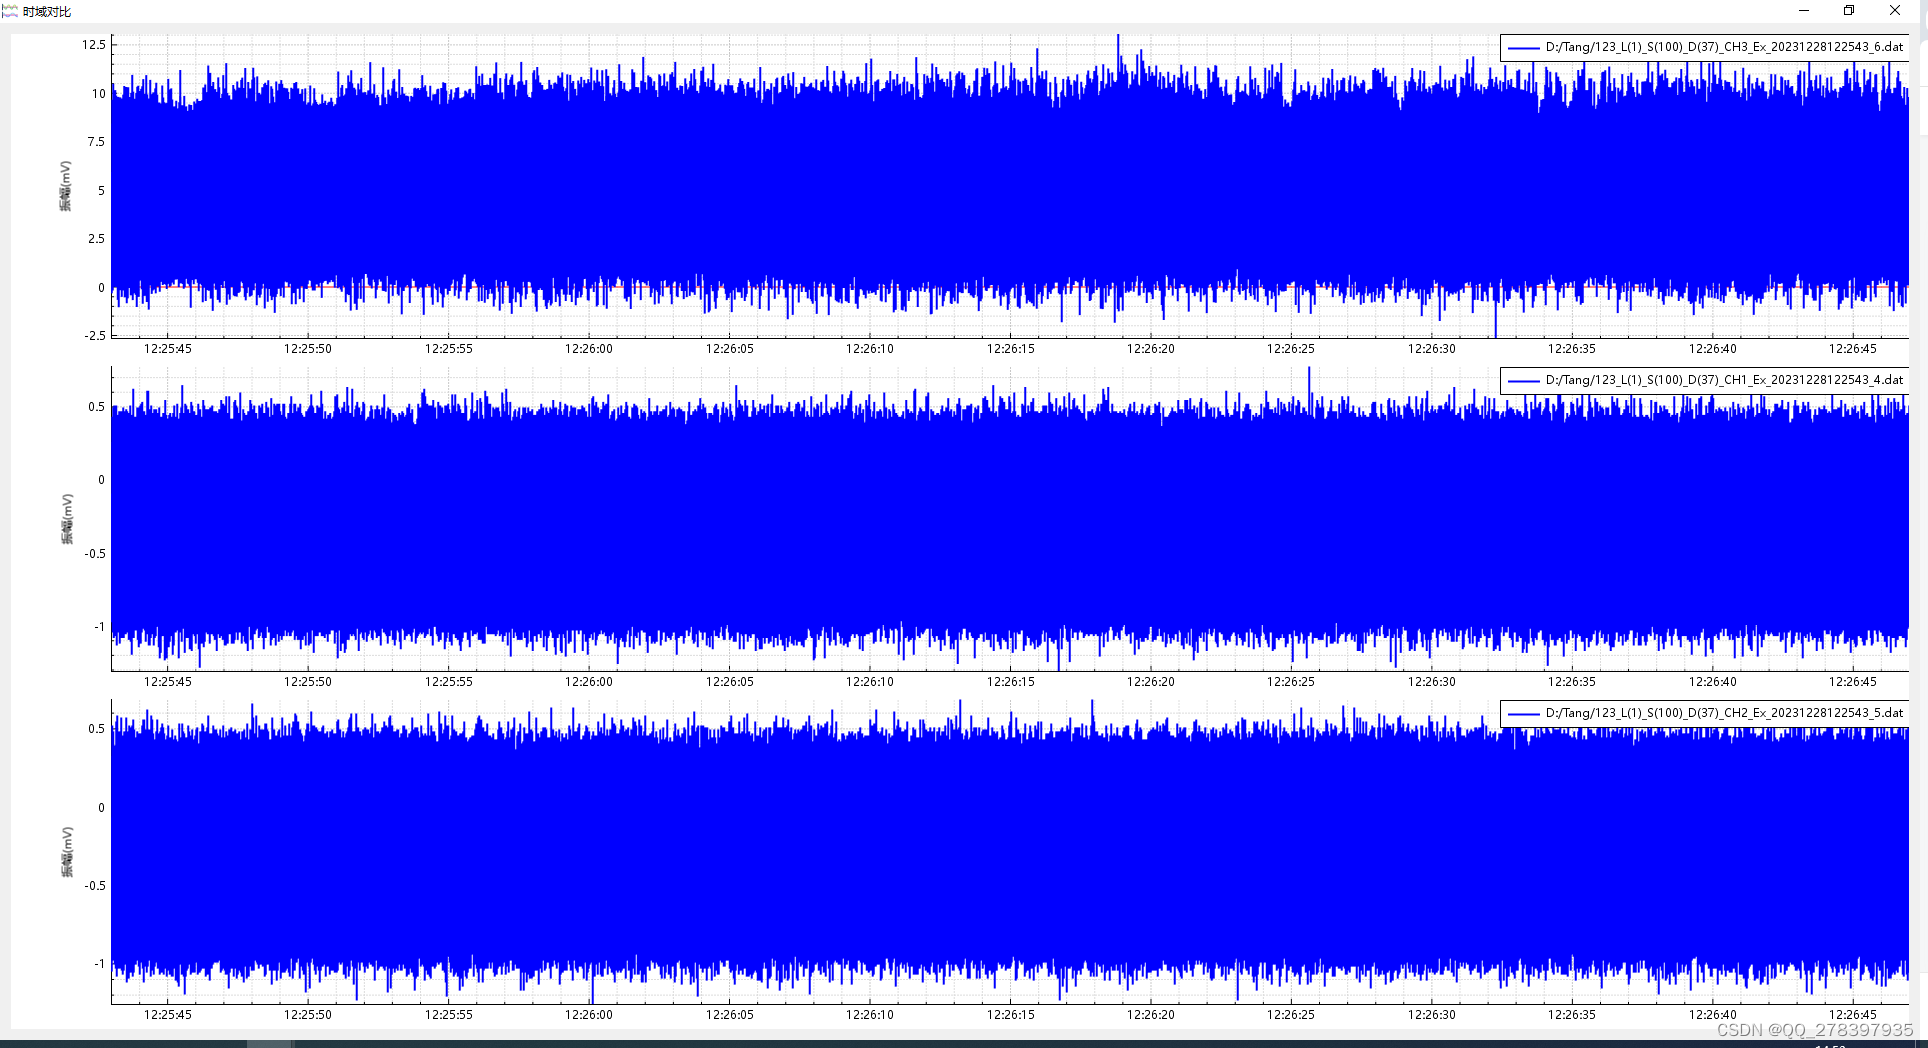
实现多Y轴、单X轴、X轴是时间轴、X轴range联动、rect之间的间距是0,每个图上有legend(这里有个疑问,每添加个rect在这个rect上添加graph,再添加legend,第一个rect上就有多个legend,其他rect上就只有一个。);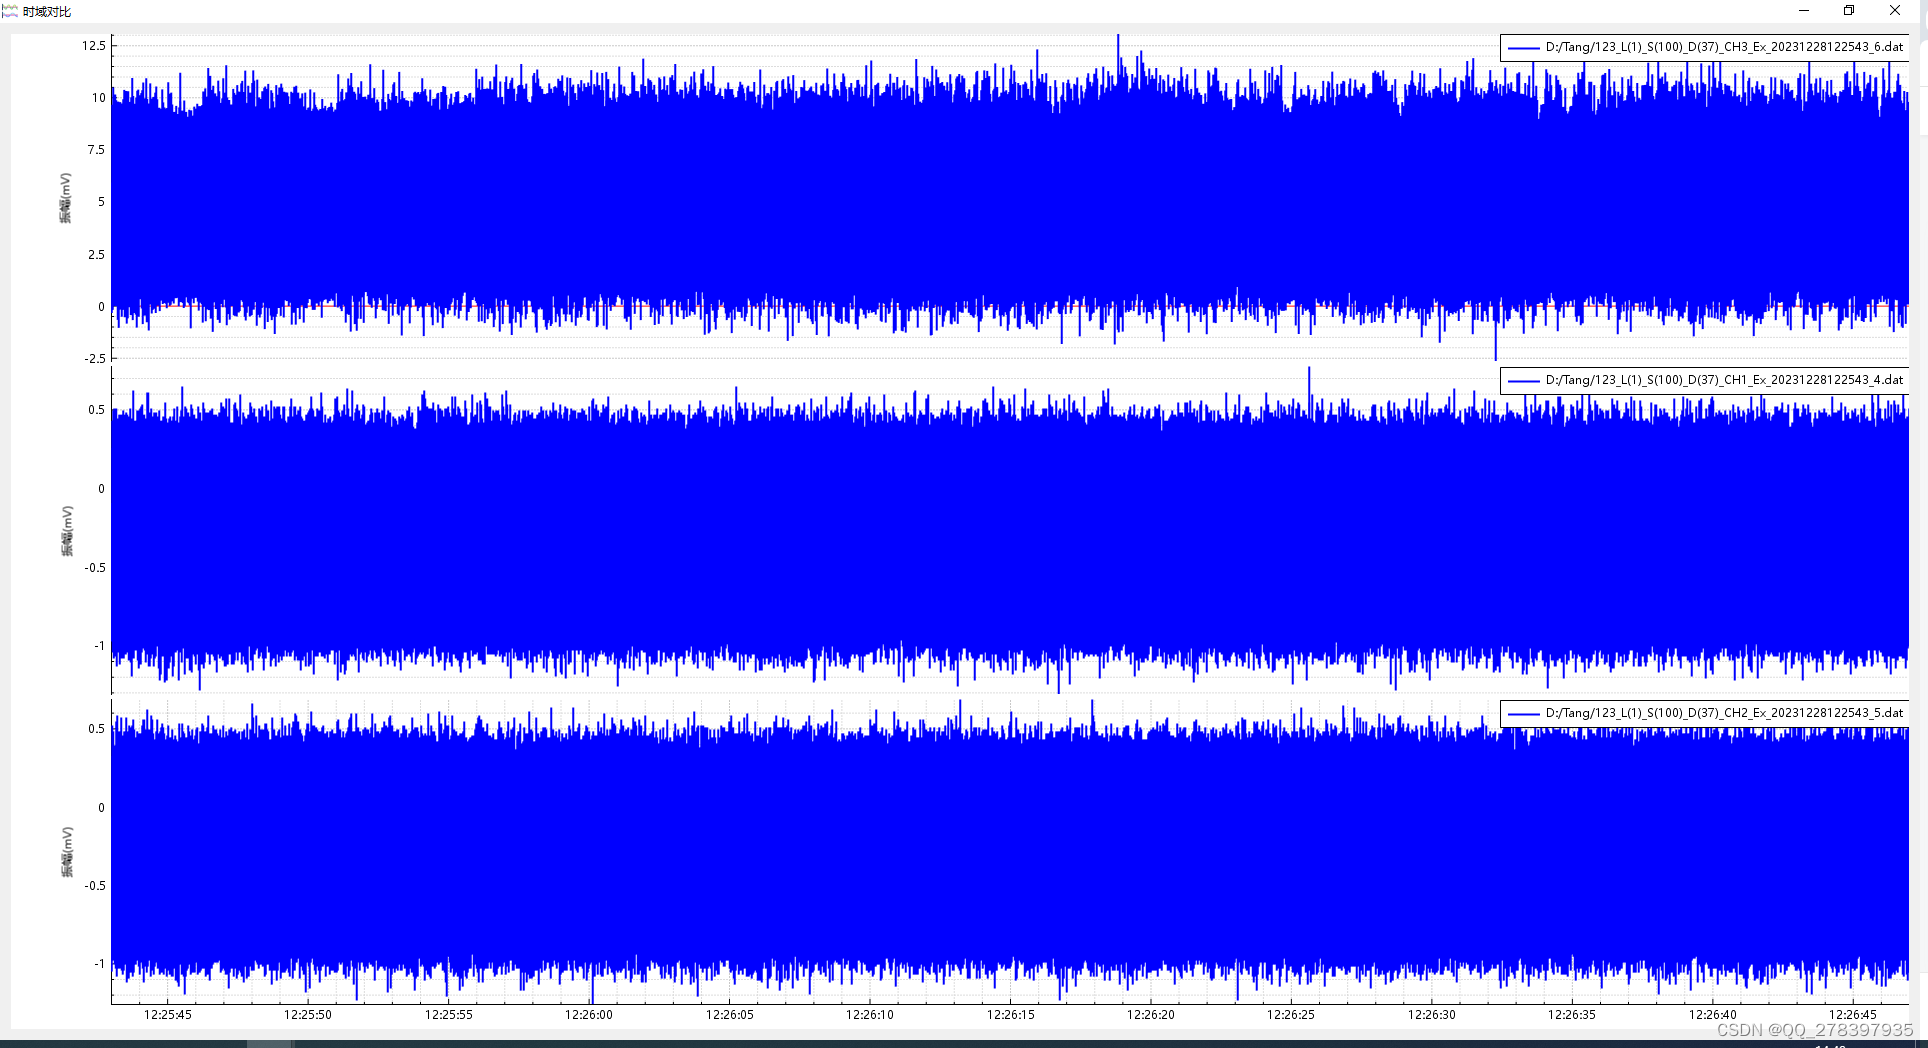
实现多Y轴、多X轴,x轴不联动。
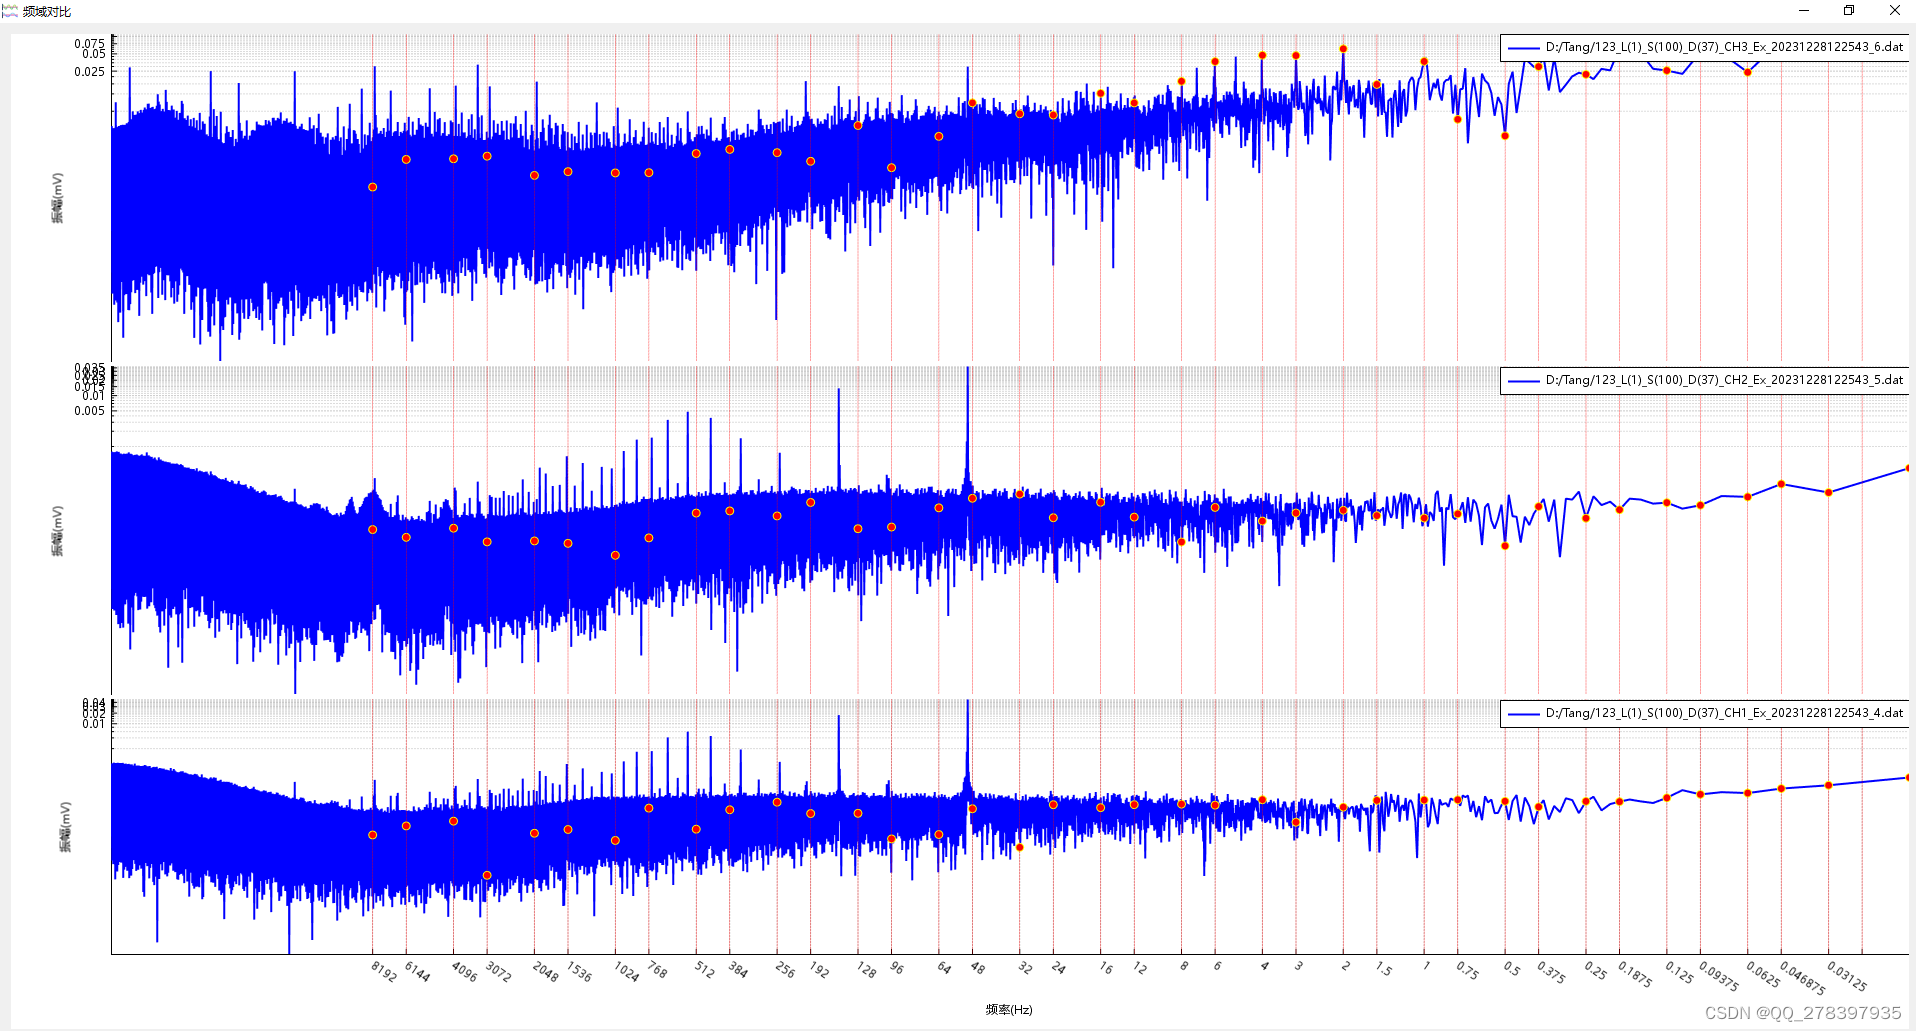
频谱图,多Y轴,单X轴
关键代码如下,请大佬们多多指正:
//时域图
void MultiAxisWidget::recvRawData(int iRow, QString oStrLabel, QVector<double> adX, QVector<double> adY)
{QCPAxisRect* poAxisRect = new QCPAxisRect(ui->plot);poAxisRect->setAutoMargins(QCP::msNone);poAxisRect->setMargins(QMargins(100, 0, 0, 0));ui->plot->plotLayout()->addElement(iCntIndex, 0, poAxisRect);QCPAxis* poAxisX = poAxisRect->axis(QCPAxis::atBottom);QCPAxis* poAxisY = poAxisRect->axis(QCPAxis::atLeft);poAxisX->setVisible(false);poAxisY->grid()->setZeroLinePen(QPen(Qt::red));poAxisX->grid()->setSubGridVisible(true);poAxisY->grid()->setSubGridVisible(true);QList<QCPAxis*> aaxisField;aaxisField << poAxisX;poAxisRect->setRangeZoomAxes(aaxisField);poAxisY->setVisible(true);poAxisY->setLabel("振幅(mV)");auto poGraph = ui->plot->addGraph(poAxisX, poAxisY);poGraph->setName(oStrLabel);poGraph->setData(adX, adY);poGraph->setLineStyle(QCPGraph::lsLine);poGraph->setPen(QPen(Qt::blue, 2));poGraph->rescaleKeyAxis(true);poGraph->rescaleValueAxis(true, true);poGraph->rescaleAxes();auto poThread = new QThread;poGraph->setParent(nullptr);poGraph->moveToThread(poThread);poGraph->setVisible(true);QPair<QCPAxisRect*, QCPGraph*> pairContent(poAxisRect, poGraph) ;aopContent.append(pairContent);++iCntIndex;QSharedPointer<QCPAxisTickerDateTime> dateTicker(new QCPAxisTickerDateTime);//日期做X轴dateTicker->setDateTimeFormat("HH:mm:ss");//日期格式(可参考QDateTime::fromString()函数)dateTicker->setTickCount(12);switch(eAxisType){case AXIS_X_M:poAxisRect->setAutoMargins(QCP::msBottom);poAxisX->setVisible(true);poAxisX->setTicker(dateTicker);//设置X轴为时间轴break;case AXIS_X_S:if(iCntIndex == iCnt){poAxisRect->setAutoMargins(QCP::msBottom);poAxisX->setVisible(true);poAxisX->setTicker(dateTicker);//设置X轴为时间轴QTimer::singleShot(1000, this, [ = ](){this->linkage();});}break;}if(iCntIndex == iCnt){for(QPair<QCPAxisRect*, QCPGraph*> pairContent : aopContent){QCPLegend* poLegend = new QCPLegend;pairContent.first->insetLayout()->addElement(poLegend, Qt::AlignTop | Qt::AlignRight);poLegend->setLayer("legend");poLegend->addItem(new QCPPlottableLegendItem(poLegend, pairContent.second));}}ui->plot->replot();
}//频谱图
void MultiAxisWidget::recvSpectrum(QString oStrLabel, QVector<double> x, QVector<double> y, QList<double> adTargetF)
{QCPAxisRect* poAxisRect = new QCPAxisRect(ui->plot);poAxisRect->setAutoMargins(QCP::msNone);poAxisRect->setMargins(QMargins(100, 0, 0, 0));ui->plot->plotLayout()->addElement(iCntIndex, 0, poAxisRect);QCPAxis* poAxisX = poAxisRect->axis(QCPAxis::atBottom);QCPAxis* poAxisY = poAxisRect->axis(QCPAxis::atLeft);poAxisX->setVisible(false);QList<QCPAxis*> aaxisField;aaxisField << poAxisX;poAxisRect->setRangeZoomAxes(aaxisField);poAxisX->setLabel("频率(Hz)");          //X轴文字显示poAxisY->setLabel("振幅(mV)");          //Y轴文字显示poAxisY->grid()->setZeroLinePen(QPen(Qt::red));poAxisX->setRangeReversed(true);poAxisX->setScaleType(QCPAxis::stLogarithmic);poAxisY->setScaleType(QCPAxis::stLogarithmic);ui->plot->xAxis->grid()->setSubGridVisible(true);poAxisY->grid()->setSubGridVisible(true);auto poGraph = ui->plot->addGraph(poAxisX, poAxisY);poGraph->setName(oStrLabel);poGraph->setData(x, y);poGraph->setLineStyle(QCPGraph::lsLine);poGraph->setPen(QPen(Qt::blue, 2));poGraph->rescaleKeyAxis(true);poGraph->rescaleValueAxis(true, true);poGraph->rescaleAxes();auto poThread = new QThread;poGraph->setParent(nullptr);poGraph->moveToThread(poThread);poGraph->setVisible(true);for(int i = 0; i < adTargetF.count(); i++){QCPItemTracer* poTracer = new QCPItemTracer(ui->plot);poTracer->setGraphKey(adTargetF.at(i));poTracer->setInterpolating(false);poTracer->setStyle(QCPItemTracer::tsCircle);poTracer->setPen(QPen(Qt::yellow));poTracer->setBrush(Qt::red);poTracer->position->setType(QCPItemPosition::ptPlotCoords);poTracer->setSize(8);poTracer->setClipAxisRect(poAxisRect);//设置裁剪的坐标轴poTracer->setGraph(poGraph);QCPItemStraightLine* poLine = new QCPItemStraightLine(ui->plot);poLine->setPen(QPen(Qt::red, 0.5, Qt::DotLine));//垂直参考线,就是两点一线//m_pHorReffer_DG->setClipToAxisRect(false);//裁剪,让外部也要看到poLine->setClipAxisRect(poAxisRect);//设置裁剪的坐标轴poLine->point1->setAxes(poAxisRect->axis(QCPAxis::atBottom), poAxisRect->axis(QCPAxis::atLeft)); //绑定坐标poLine->point2->setAxes(poAxisRect->axis(QCPAxis::atBottom), poAxisRect->axis(QCPAxis::atLeft));poLine->point1->setCoords(adTargetF.at(i), 1);poLine->point2->setCoords(adTargetF.at(i), 2);}QPair<QCPAxisRect*, QCPGraph*> pairContent(poAxisRect, poGraph) ;aopContent.append(pairContent);++iCntIndex;if(iCntIndex == iCnt){poAxisRect->setAutoMargins(QCP::msBottom);QSharedPointer<QCPAxisTickerText> textTicker = QSharedPointer<QCPAxisTickerText>(new QCPAxisTickerText);textTicker.data()->clear();foreach(double dF, adTargetF){textTicker->addTick(dF, QString("%1").arg(dF));}poAxisX->setTicker(textTicker);poAxisX->setTickLabelRotation(34.38);poAxisX->setVisible(true);QTimer::singleShot(1000, this, [ = ](){this->linkage();});for(QPair<QCPAxisRect*, QCPGraph*> pairContent : aopContent){QCPLegend* poLegend = new QCPLegend;pairContent.first->insetLayout()->addElement(poLegend, Qt::AlignTop | Qt::AlignRight);poLegend->setLayer("legend");poLegend->addItem(new QCPPlottableLegendItem(poLegend, pairContent.second));}}ui->plot->replot();
}//多  x轴联动
void MultiAxisWidget::linkage()
{for(QPair<QCPAxisRect*, QCPGraph*> pairContent : aopContent){for(QPair<QCPAxisRect*, QCPGraph*> pairContentOther : aopContent){if(pairContentOther.first == pairContent.first){continue;}connect(pairContent.first->axis(QCPAxis::atBottom), QOverload<const QCPRange&>::of(&QCPAxis::rangeChanged),pairContentOther.first->axis(QCPAxis::atBottom), QOverload<const QCPRange&>::of(&QCPAxis::setRange));}}//鼠标双击曲线,在颜色对话框中给被点击的曲线设置颜色connect(ui->plot, &QCustomPlot::plottableDoubleClick, this, [ = ](QCPAbstractPlottable * plottable, int dataIndex, QMouseEvent * event){QColorDialog colorDialog;colorDialog.setCurrentColor(Qt::red);// 显示对话框int result = colorDialog.exec();// 检查用户是否选择了颜色if (result == QDialog::Accepted){// 获取选择的颜色QColor selectedColor = colorDialog.selectedColor();plottable->setPen(QPen(selectedColor, 2));ui->plot->replot();}});ui->plot->replot();
}