1.简介
GoJS是一个可视化JavaScript库,用于浏览器中创建交互图形,(比如流程图,树图,关系图,力导图等等)。允许您为用户构建各种图表,从简单的流程图、组织图到图表、SCADA和BPMN图表、医学图表(如基因组图)等等。GoJS使用可定制的模板和布局,可以轻松构建复杂节点、链接和组的JavaScript图。为用户提供了许多高级功能,如拖放、复制粘贴、就地文本编辑、工具提示、上下文菜单、自动布局和操作。
GoJS不依赖于任何JS库或框架,可与任何HTML或JS框架配合工作,甚至可以不用框架。GoJS依赖于HTML5,所以请保证您的浏览器版本支持HTML5,当然还要加载这个库。
2.使用
使用的话需要去官网下载对应的js文件:GoJS - Build Interactive Diagrams for the Web
下载之后并不是所有的js文件都用的到,我们需要了解到只有三个
"""
go.js				 正常必须要导入的文件
go-debug.js  会展示报错消息 类似于debug模式 线上肯定不会使用
Figures.js	 扩展图表(go.js自带的图表比较少,如果出现图标显示不出来的情况)
"""
# 总结:使用的时候导入go.js和Figures.js就不会有任何问题了
官方文档: Production Process Viewer
中文文档: GoJS 图形组件简介 | GoJS
1. 安装依赖
npm i gojs2. 引入
import go from 'gojs' 3. 创建画布
<div class="inCharts" id="myDiagramDiv"></div>4. 挂载
var myDiagram = $(go.Diagram, "myDiagramDiv",//为DIV.HTML元素创建一个画布{//设置画布配置initialAutoScale: go.Diagram.Uniform, // 缩放以显示所有内容maxSelectionCount: 1, // 不要让用户一次选择多于一个的东西isReadOnly: true, // 只读 不可拖动contentAlignment: go.Spot.Center, // 位置在中间// layout: $(go.TreeLayout,// { angle: 90, layerSpacing: 35 })});5.框架中用法示例
<template><div><div id="myDiagramDiv"class="diagram-box"></div><ul id="contextMenu"class="menu"><li id="cut"class="menu-item"@click="cxcommand($event)">Cut</li><li id="copy"class="menu-item"@click="cxcommand($event)">Copy</li><li id="paste"class="menu-item"@click="cxcommand($event)">Paste</li><li id="delete"class="menu-item"@click="cxcommand($event)">Delete</li></ul></div>
</template>
import go from 'gojs';
export default {computed: {},data() {return {myDiagram: {},};},created() {},mounted() {this.init();},methods: {init() {/*图表(Diagram)基本元素:点(Node)、线(Link)点和线自由组合就是 组(Group)所有的元素都处在 图层(Layer) 上,并且可以对他们进行 布局(Layout)每一个点和线都是通过模板来描述他们的文本、形状、颜色等信息以及交互行为。每一个模板其实就是一个 面板(Panel)每个图表都是通过 数据模型(Model) 来填充和确定 点 的信息和 线 的所属关系并且我们只需创建好 点 和 线 的模板以及数据模型,其他事情都交给gojs处理Model又分为了以下三种类型:Model:最基本的(不带连线)GraphLinksModel :高级点的动态连线图TreeModel:树形图的模型gojs通过Model.nodeDataArray方法和GraphLinksModel.linkDataArray方法自动加载模型并构建元素通过ToolManager对象管理工具类(交互行为),譬如管理CommandHandler对象用来添加一些键盘命令gojs定义了一个用于创建GraphObject对象的静态函数GraphObject.makeGraphObject是所有图形对象的抽象类,这个类的子类包括Panel、Shape、TextBlock、Picture和Placeholder。其中Panel派生的子类Part是Node和Link的父类Part是一个图表对象,它继承自Panel。它是所有用户操作级别对象的基类Shape:形状——Rectangle(矩形)、RoundedRectangle(圆角矩形),Ellipse(椭圆形),Triangle(三角形),Diamond(菱形),Circle(圆形)等TextBlock:文本域(可编辑)Picture:图片Panel:容器来保存其他Node的集合*/var $ = go.GraphObject.make; // 给go.GraphObject.make起简称// var diagram = new go.Diagram('myDiagramDiv');// diagram.model = new go.GraphLinksModel([{ key: 'Hello' }, { key: 'World!' }], [{ from: 'Hello', to: 'World!' }]);// 创建Diagram对象 定义画布的基本属性var myDiagram = (this.myDiagram = $(go.Diagram,'myDiagramDiv', // 必须命名或引用DIV HTML元素 画布绑定的Div的ID{LinkDrawn: showLinkLabel, // 监听线生成事件LinkRelinked: showLinkLabel, // 线重新连接事件initialContentAlignment: go.Spot.Center, // 任何初始图都位于视口中的中心InitialLayoutCompleted: loadDiagramProperties, // 在加载新模型之前不要初始化一些属性'toolManager.mouseWheelBehavior': go.ToolManager.WheelZoom, // 鼠标滚轮事件放大和缩小,而不是向上和向下滚动// 允许通过双击创建一个新节点,与nodeTemplate里TextBlock绑定的属性值new go.Binding('text', 'key')有关'clickCreatingTool.archetypeNodeData': { key: 'new node', color: 'white' },'undoManager.isEnabled': true, // 允许取消和重做 undo & redoallowZoom: false, // 不允许用户改变图表的规模'grid.visible': true, // 画布上面是否出现网格}));function loadDiagramProperties(e) {}// TextBlock案例myDiagram.add($(go.Part,'Vertical',$(go.Panel,'Vertical',// TextBlock是用于显示文本信息的对象 font属性设置文本的字体 stroke属性设置文本字体的颜色$(go.TextBlock, {text: 'a Text Block\nwith three logical lines\nof text',background: 'lightgreen',margin: 2,stroke: 'red',isMultiline: false, // 设置是否开启内嵌文本中的换行符作用}),$(go.TextBlock, {text: 'a Text Block\nwith three logical lines\nof text',background: 'lightgreen',margin: 2,isMultiline: true,}),$(go.TextBlock, {text: '文本块\n中有三行居中\n文本',background: 'lightgreen',margin: 2,isMultiline: true,textAlign: 'center', // 对齐方式font: 'bold 14pt serif',}),$(go.TextBlock, {text: 'a single line of centered text that should wrap because we will limit the width',background: 'lightgreen',margin: 2,width: 80,wrap: go.TextBlock.WrapFit, // 根据TextBlock的尺寸自动对文本进行换行textAlign: 'center',})),$(go.Panel,'Vertical',{ width: 150, defaultStretch: go.GraphObject.None },$(go.TextBlock, { text: 'alignment: Left', background: 'lightgreen', margin: 2, alignment: go.Spot.Left }),$(go.TextBlock, { text: 'alignment: Center', background: 'lightgreen', margin: 2, alignment: go.Spot.Center }),$(go.TextBlock, { text: 'alignment: Right', background: 'lightgreen', margin: 2, alignment: go.Spot.Right })),// editable对TextBlock文本的编辑功能// 设置TextBlock.textValidation属性编写验证规则,该属性的值为function。设置TextBlock.textEditor属性更换文本编辑器$(go.TextBlock, { text: 'select and then click to edit', background: 'lightblue', editable: true, isMultiline: false }),$(go.TextBlock, { text: 'this one allows embedded newlines', background: 'lightblue', editable: true })));// 单独创建能够复用的对象,比如样式刷(Brush)var violetbrush = $(go.Brush, go.Brush.Linear, { 0.0: 'Violet', 1.0: 'Lavender' });// Shape案例myDiagram.add($(go.Part,'Table',// 通过Shape可以构建一个几何图形// fill属性设置填充颜色。// 如果设置为null,那么只能点击图形的轮廓才能选中,点击图形里面是无法选中的。而如设置为transparent,点击图形的任何地方都可以选中该图形。$(go.Shape, 'RoundedRectangle', { row: 0, column: 0, width: 40, height: 40, margin: 4, fill: violetbrush }),$(go.TextBlock, 'green', { row: 1, column: 0 }),$(go.Shape, { row: 0, column: 1, figure: 'RoundedRectangle', width: 40, height: 40, margin: 4, fill: 'white' }),$(go.TextBlock, 'white', { row: 1, column: 1 }),$(go.Shape, { row: 0, column: 2, figure: 'Ellipse', width: 40, height: 40, margin: 4, fill: 'transparent' }),$(go.TextBlock, 'transparent', { row: 1, column: 2 }),// angle和.scale属性设置Shape的角度和比例$(go.Shape, { row: 0, column: 3, figure: 'Ellipse', width: 40, height: 40, margin: 4, fill: null, angle: 30, scale: 1.5 }),$(go.TextBlock, 'null', { row: 1, column: 3 })));// 右键菜单var cxElement = document.getElementById('contextMenu');var myContextMenu = $(go.HTMLInfo, {show: showContextMenu,hide: hideContextMenu,});cxElement.addEventListener('contextmenu',function (e) {e.preventDefault();return false;},false);// 显示右键菜单回调函数function showContextMenu(obj, diagram, tool) {// 只显示当前状态下的相关按钮。var cmd = diagram.commandHandler;var hasMenuItem = false;function maybeShowItem(elt, pred) {if (pred) {elt.style.display = 'block';hasMenuItem = true;} else {elt.style.display = 'none';}}// 重写键盘工具类commandHandler,去拦截调用deleteSelection 实现取消删除的功能maybeShowItem(document.getElementById('cut'), cmd.canCutSelection());maybeShowItem(document.getElementById('copy'), cmd.canCopySelection());maybeShowItem(document.getElementById('paste'), cmd.canPasteSelection(diagram.toolManager.contextMenuTool.mouseDownPoint));maybeShowItem(document.getElementById('delete'), cmd.canDeleteSelection());// Now show the whole context menu elementif (hasMenuItem) {cxElement.classList.add('show-menu');// we don't bother overriding positionContextMenu, we just do it here:var mousePt = diagram.lastInput.viewPoint;cxElement.style.left = mousePt.x + 5 + 'px';cxElement.style.top = mousePt.y + 'px';}// 可选:使用' window '的单击监听与事件捕获// 如果用户单击页面上其他地方,则删除上下文菜单window.addEventListener('click', hideCX, true);}function hideCX() {if (myDiagram.currentTool instanceof go.ContextMenuTool) {myDiagram.currentTool.doCancel();}}// 隐藏右键菜单回调函数function hideContextMenu() {cxElement.classList.remove('show-menu');// 可选:使用' window '的单击监听与事件捕获// 如果用户单击页面上其他地方,则删除上下文菜单window.removeEventListener('click', hideCX, true);}// 全局(图表空白处)绑定自定义右键菜单myDiagram.contextMenu = myContextMenu;// 定义一个函数来创建一个新连线用来连接两个节点function makePort(name, align, spot, output, input) {var horizontal = align.equals(go.Spot.Top) || align.equals(go.Spot.Bottom);return $(go.Shape, {fill: 'transparent', // 定义锚点颜色strokeWidth: 0, // no strokewidth: horizontal ? NaN : 8, // if not stretching horizontally, just 8 wideheight: !horizontal ? NaN : 8, // if not stretching vertically, just 8 tallalignment: align, // 规定锚点的位置stretch: horizontal ? go.GraphObject.Horizontal : go.GraphObject.Vertical,portId: name, // 规定锚点的名称fromSpot: spot, // 输出点fromLinkable: output, // 是否可以作为新连线的末节点toSpot: spot, // 输入点toLinkable: input, // 是否可以作为新连线的初始节点cursor: 'pointer', // 显示不同的光标以指示潜在的链接点mouseEnter: function (e, port) {// the PORT argument will be this Shape 鼠标移入if (!e.diagram.isReadOnly) port.fill = 'rgba(255,0,255,1)';},mouseLeave: function (e, port) {port.fill = 'transparent';},});}// 监听线生成和重新连接事件function showLinkLabel(e) {var label = e.subject.findObject('LABEL');if (label !== null) label.visible = e.subject.fromNode.data.category === 'Conditional';}// Link案例// 自定义Nodes案例// 节点面板子元素布局定义// Auto:子元素叠加布局、Vertical:子元素垂直布局、Horizontal:子元素水平布局、Position:子元素坐标布局、Table:子元素表格布局// Spot: Node里的元素都排列在这个Node中的各个锚点上myDiagram.nodeTemplate = $(go.Node,'Auto',new go.Binding('location', 'loc', go.Point.parse), // 申明动态绑定指定属性,将数据源中提供指定字段的值赋值给当前的指定属性// new go.Binding("location", "loc", go.Point.parse).makeTwoWay(go.Point.stringify) 双向绑定$(go.Shape, 'RoundedRectangle', {fill: 'white',portId: '',cursor: 'pointer',// 允许可以更改连线的端口,配合linkTemplate的relinkableFrom和relinkableTo属性使用fromLinkable: true,fromLinkableSelfNode: true,fromLinkableDuplicates: true,toLinkable: true,toLinkableSelfNode: true,toLinkableDuplicates: true,}),$(go.Picture, { maxSize: new go.Size(50, 50) }, new go.Binding('source', 'img')),$(go.TextBlock, { margin: new go.Margin(65, 0, 0, 0) }, new go.Binding('text', 'key')),{// 鼠标悬浮titletoolTip: $(go.Adornment,'Auto',$(go.Shape,{ fill: '#F3F3C3' },new go.Binding('visible', 'info', function (i) {return i ? true : false;})),$(go.TextBlock, { margin: 4 }, new go.Binding('text', 'info'))),},{ contextMenu: myContextMenu },makePort('T', go.Spot.Top, go.Spot.TopSide, false, true),makePort('L', go.Spot.Left, go.Spot.LeftSide, true, true),makePort('R', go.Spot.Right, go.Spot.RightSide, true, true),makePort('B', go.Spot.Bottom, go.Spot.BottomSide, true, false));// 构建一个连线模板myDiagram.linkTemplate = $(go.Link,{routing: go.Link.AvoidsNodes, // 设置默认规则,可被后续绑定的new go.Binding覆盖curve: go.Link.JumpOver, // 当两条连线相交时,JumpOver:一条线越过了交叉的另一条线。Bezier:设置连线的弯曲度;JumpGap:在相交处会断开corner: 10, // 设置连线折角的弧度toShortLength: 4,relinkableFrom: true, // 可以更改线的初始点relinkableTo: true, // 可以更改线的末端点reshapable: true, // 重塑(改变shape形状边界时使用,将影响节点大小)resegmentable: true, // 连线中直线可更改// mouse-overs subtly highlight links: 鼠标移入事件mouseEnter: function (e, link) {link.findObject('HIGHLIGHT').stroke = 'rgba(30,144,255,0.2)';link.findObject('HIGHLIGHT').strokeWidth = 5;},mouseLeave: function (e, link) {link.findObject('HIGHLIGHT').stroke = '#000';link.findObject('HIGHLIGHT').strokeWidth = 1;},selectionAdorned: true, // 显示选中边框},{ contextMenu: myContextMenu },$(go.Shape, // 线的悬浮高亮{isPanelMain: true,strokeWidth: 1,name: 'HIGHLIGHT',}),new go.Binding('routing', 'routing'),$(go.Shape, // 箭头OpenTriangle{ toArrow: 'standard', fill: null }),$(go.Panel,'Auto', // 连线标签,默认不可见{visible: true,name: 'LABEL',segmentIndex: 2,segmentFraction: 0.5,},new go.Binding('visible', 'visible').makeTwoWay(),$(go.Shape, 'RoundedRectangle', { fill: '#F8F8F8', strokeWidth: 0 }),$(go.TextBlock,'标签',{textAlign: 'center',font: '10pt helvetica, arial, sans-serif',stroke: '#333333',editable: true,},new go.Binding('text').makeTwoWay())));// 为图表背景定义行为:function diagramInfo(model) {// diagram's model工具提示信息return '模板:\n' + model.nodeDataArray.length + ' 节点(node), ' + model.linkDataArray.length + ' 连线(Links)';}// 当不在任何Part上时,为Diagram的背景提供工具提示myDiagram.toolTip = $('ToolTip', $(go.TextBlock, { margin: 4 }, new go.Binding('text', '', diagramInfo)));var nodeDataArray = [{ key: 'Alpha', loc: '0 0', img: require('assets/logo.png'), info: '' },{ key: 'Beta', loc: '200 350', img: require('assets/logo.png'), info: 'shredded curtains' },{ key: 'Gamma', loc: '300 125', img: require('assets/logo.png'), info: 'shredded' },];var linkDataArray = [{ from: 'Alpha', to: 'Beta', routing: go.Link.Normal }, // routing改变连线的路径,Orthogonal:正交,AvoidsNodes:自动避开Node{ from: 'Alpha', to: 'Beta', routing: go.Link.Normal },{ from: 'Alpha', to: 'Beta', routing: go.Link.Normal },{ from: 'Alpha', to: 'Gamma', routing: go.Link.Orthogonal },{ from: 'Beta', to: 'Gamma', routing: go.Link.AvoidsNodes },];myDiagram.model = new go.GraphLinksModel(nodeDataArray, linkDataArray);},// 右键菜单点击事件cxcommand(event) {var val = event.currentTarget.id;var diagram = this.myDiagram;switch (val) {case 'cut':diagram.commandHandler.cutSelection();break;case 'copy':diagram.commandHandler.copySelection();break;case 'paste':diagram.commandHandler.pasteSelection(diagram.toolManager.contextMenuTool.mouseDownPoint);break;case 'delete':diagram.commandHandler.deleteSelection(); // 删除选中的节点或线break;}diagram.currentTool.stopTool();},},
};简单的样式
.diagram-box {border: solid 1px blue;width: 1500px;height: 650px;margin-top: 100px;
}#myDiagramDiv {flex: 1;border: 1px solid rgb(212, 212, 212);
}
.menu {display: none;position: absolute;opacity: 0;margin: 0;padding: 8px 0;z-index: 999;box-shadow: 0 5px 5px -3px rgba(0, 0, 0, 0.2), 0 8px 10px 1px rgba(0, 0, 0, 0.14), 0 3px 14px 2px rgba(0, 0, 0, 0.12);list-style: none;background-color: #ffffff;border-radius: 4px;
}.menu-item {display: block;position: relative;min-width: 60px;margin: 0;padding: 6px 16px;font: bold 12px sans-serif;color: rgba(0, 0, 0, 0.87);cursor: pointer;
}.menu-item::before {position: absolute;top: 0;left: 0;opacity: 0;pointer-events: none;content: '';width: 100%;height: 100%;background-color: #000000;
}.menu-item:hover::before {opacity: 0.04;
}.menu .menu {top: -8px;left: 100%;
}.show-menu,
.menu-item:hover > .menu {display: block;opacity: 1;
}
方法:先用div在页面上划定区域,之后所有的gojs图表渲染全部在该div内部进行。
<!-- 划定用来渲染gojs图标的div区域,背景颜色等参数 -->
<div id="myDiagramDiv" style="width:500px; height:350px; background-color: #DAE4E4;"></div><script src="go.js"></script>
<script>var $ = go.GraphObject.make;// 第一步:创建图表,用于在页面上画图var myDiagram = $(go.Diagram, "myDiagramDiv");// 第二步:创建一个节点,内容为donnervar node = $(go.Node, $(go.TextBlock, {text: "donner"}));// 第三步:将节点添加到div区域中myDiagram.add(node)
</script>
3.重要概念
- TextBlock创建文本
- Shape图形
- Node节点(文本与图形结合)
- Link箭头
1、TextBlock创建文本
<div id="myDiagramDiv" style="width:500px; height:350px; background-color: #DAE4E4;"></div>
<script src="go.js"></script>
<script>var $ = go.GraphObject.make;// 第一步:创建图表var myDiagram = $(go.Diagram, "myDiagramDiv"); // 创建图表,用于在页面上画图var node1 = $(go.Node, $(go.TextBlock, {text: "jason"}));myDiagram.add(node1);var node2 = $(go.Node, $(go.TextBlock, {text: "jason", stroke: 'red'}));myDiagram.add(node2);var node3 = $(go.Node, $(go.TextBlock, {text: "jason", background: 'lightblue'}));myDiagram.add(node3);
</script>
2、Shape图形
<div id="myDiagramDiv" style="width:500px; height:350px; background-color: #DAE4E4;"></div>
<script src="go.js"></script>
<script src="Figures.js"></script>
<script>var $ = go.GraphObject.make;// 第一步:创建图表var myDiagram = $(go.Diagram, "myDiagramDiv"); // 创建图表,用于在页面上画图var node1 = $(go.Node,$(go.Shape, {figure: "Ellipse", width: 40, height: 40}));myDiagram.add(node1);var node2 = $(go.Node,$(go.Shape, {figure: "RoundedRectangle", width: 40, height: 40, fill: 'green',stroke:'red'}));myDiagram.add(node2);var node3 = $(go.Node,$(go.Shape, {figure: "Rectangle", width: 40, height: 40, fill: null}));myDiagram.add(node3);var node5 = $(go.Node,$(go.Shape, {figure: "Club", width: 40, height: 40, fill: 'red'}));myDiagram.add(node5);
</script>
3、Node节点(文本与图形结合)
<div id="myDiagramDiv" style="width:500px; height:350px; background-color: #DAE4E4;"></div>
<script src="go.js"></script>
<script src="Figures.js"></script>
<script>var $ = go.GraphObject.make;// 第一步:创建图表var myDiagram = $(go.Diagram, "myDiagramDiv"); // 创建图表,用于在页面上画图var node1 = $(go.Node,"Vertical",  // 垂直方向{background: 'yellow',padding: 8},$(go.Shape, {figure: "Ellipse", width: 40, height: 40,fill:null}),$(go.TextBlock, {text: "jason"}));myDiagram.add(node1);var node2 = $(go.Node,"Horizontal",  // 水平方向{background: 'white',padding: 5},$(go.Shape, {figure: "RoundedRectangle", width: 40, height: 40}),$(go.TextBlock, {text: "jason"}));myDiagram.add(node2);var node3 = $(go.Node,"Auto",  // 居中$(go.Shape, {figure: "Ellipse", width: 80, height: 80, background: 'green', fill: 'red'}),$(go.TextBlock, {text: "jason"}));myDiagram.add(node3);</script>
4、Link箭头
<div id="myDiagramDiv" style="width:500px; min-height:450px; background-color: #DAE4E4;"></div><script src="go.js"></script><script>var $ = go.GraphObject.make;var myDiagram = $(go.Diagram, "myDiagramDiv",{layout: $(go.TreeLayout, {angle: 0})}); // 创建图表,用于在页面上画图var startNode = $(go.Node, "Auto",$(go.Shape, {figure: "Ellipse", width: 40, height: 40, fill: '#79C900', stroke: '#79C900'}),$(go.TextBlock, {text: '开始', stroke: 'white'}));myDiagram.add(startNode);var downloadNode = $(go.Node, "Auto",$(go.Shape, {figure: "RoundedRectangle", height: 40, fill: 'red', stroke: '#79C900'}),$(go.TextBlock, {text: '下载代码', stroke: 'white'}));myDiagram.add(downloadNode);var startToDownloadLink = $(go.Link,{fromNode:downloadNode, toNode:startNode,},$(go.Shape, {strokeWidth: 1}),$(go.Shape, {toArrow: "OpenTriangle", fill: null, strokeWidth: 1}));myDiagram.add(startToDownloadLink);</script>
我们想动态生成图表并且动态的修改图标消息和状态,数据应该来自于后端。
所以解析来提供一个可以前后端数据交互的写法。
4、数据绑定(前后端交互数据渲染)
<div id="diagramDiv" style="width:100%; min-height:450px; background-color: #DAE4E4;"></div><script src="go.js"></script><script>var $ = go.GraphObject.make;var diagram = $(go.Diagram, "diagramDiv",{layout: $(go.TreeLayout, {angle: 0,nodeSpacing: 20,layerSpacing: 70})});// 生成一个节点模版diagram.nodeTemplate = $(go.Node, "Auto",$(go.Shape, {figure: "RoundedRectangle",fill: 'yellow',stroke: 'yellow'}, new go.Binding("figure", "figure"), new go.Binding("fill", "color"), new go.Binding("stroke", "color")),$(go.TextBlock, {margin: 8}, new go.Binding("text", "text")));// 生成一个箭头模版diagram.linkTemplate = $(go.Link,{routing: go.Link.Orthogonal},$(go.Shape, {stroke: 'yellow'}, new go.Binding('stroke', 'link_color')),$(go.Shape, {toArrow: "OpenTriangle", stroke: 'yellow'}, new go.Binding('stroke', 'link_color')));// 数据集合 以后替换ajax请求 注意使用key和parent来规定箭头的指向var nodeDataArray = [{key: "start", text: '开始', figure: 'Ellipse', color: "lightgreen"},{key: "download", parent: 'start', text: '下载代码', color: "lightgreen", link_text: '执行中...'},{key: "compile", parent: 'download', text: '本地编译', color: "lightgreen"},{key: "zip", parent: 'compile', text: '打包', color: "red", link_color: 'red'},{key: "c1", text: '服务器1', parent: "zip"},{key: "c11", text: '服务重启', parent: "c1"},{key: "c2", text: '服务器2', parent: "zip"},{key: "c21", text: '服务重启', parent: "c2"},{key: "c3", text: '服务器3', parent: "zip"},{key: "c31", text: '服务重启', parent: "c3"},];diagram.model = new go.TreeModel(nodeDataArray);// 动态控制节点颜色变化 后端给一个key值 即可查找图表并修改var node = diagram.model.findNodeDataForKey("zip");diagram.model.setDataProperty(node, "color", "lightgreen");</script>
通过数据绑定的方式就可以实现前后端交互的形式。
5、去除水印
需要修改js文件源码
查找js文件中固定的字符串7eba17a4ca3b1a8346
/*a.kr=b.V[Ra("7eba17a4ca3b1a8346")][Ra("78a118b7")](b.V,Jk,4,4);*/
注释该字符串所在的一行代码
并添加一行新的代码
a.kr=function(){return false};
或
a.br=function(){return true}
6.系统化常用的api学习
GoJS 绘图 (一) :入门
GoJS 绘图 (二) :TextBlocks
GoJS 绘图 (三) :shapes
GoJS 绘图 (四) :构建节点与GraphObjects
GoJS 绘图 (五) :定位面板与垂直面板(Panel)
GoJS 绘图 (六) :横向面板(panel)
GoJS 绘图 (七) :表面板(tablePanel)
GoJS 绘图 (八) :模型和模版
GoJS 绘图 (九) :数据绑定
GoJS 绘图 (十) :链接(完结)
7.修改连线样式
比方做成官网这种动态线
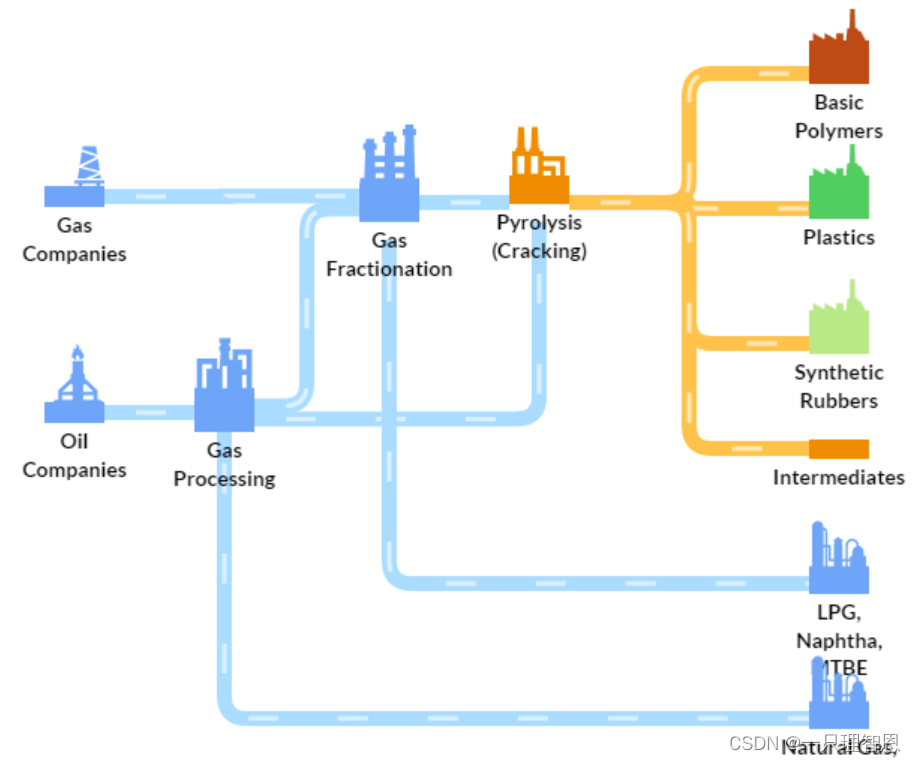
myDiagram.linkTemplate =$(go.Link,{layerName: "Background",routing: go.Link.Orthogonal,corner: 15,reshapable: true,resegmentable: true,},$(go.Shape, new go.Binding("stroke", "color"), { isPanelMain: true, strokeWidth: 10 }),$(go.Shape, { isPanelMain: true, stroke: "white", strokeWidth: 3, name: "PIPE", strokeDashArray: [20, 40] }));var opacity = 1;var down = true;function loop() {var diagram = myDiagram;setTimeout(() => {var oldskips = diagram.skipsUndoManager;diagram.skipsUndoManager = true;diagram.links.each(link => {var shape = link.findObject("PIPE");var off = shape.strokeDashOffset - 3;// animate (move) the stroke dashshape.strokeDashOffset = (off <= 0) ? 60 : off;// animte (strobe) the opacity:if (down) opacity = opacity - 0.01;else opacity = opacity + 0.003;if (opacity <= 0) { down = !down; opacity = 0; }if (opacity > 1) { down = !down; opacity = 1; }shape.opacity = opacity;});diagram.skipsUndoManager = oldskips;loop();}, 60);}
loop()8.添加节点
myDiagram.nodeTemplate = $(go.Node, "auto",)$(go.Panel,) // 相当于一个div
$(go.Picture,) // 图片
$(go.TextBlock) // 文本
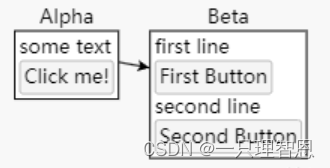
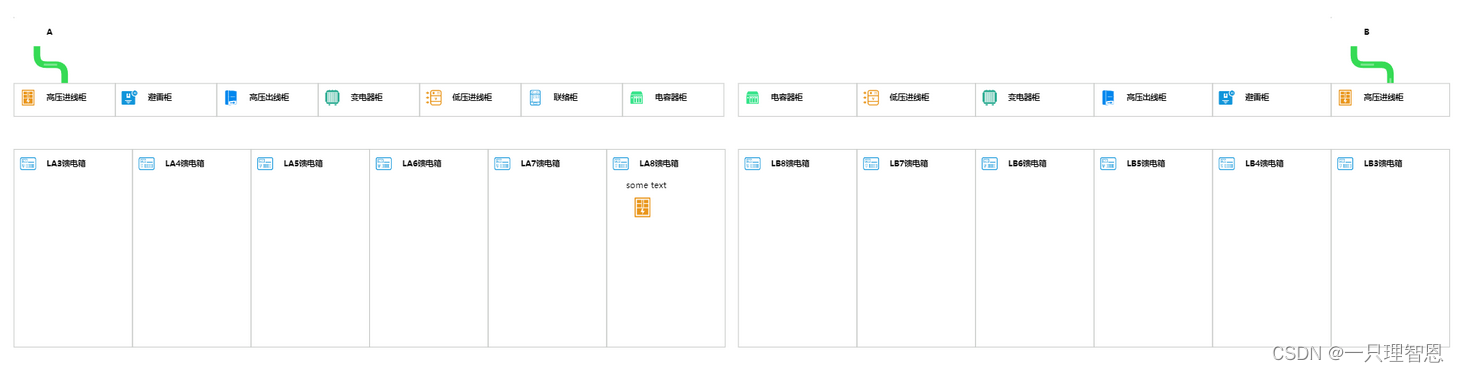
$("Button") // 按钮9.插槽
每个节点下方的内容会不同 这个时候就出现了节点这个概念
var itemtemplates = new go.Map()
// 如果状态为pic 则新增一个图片
itemtemplates.add("pic",$(go.Panel,$(go.Picture,{ margin: 10, width: 30, height: 30, background: 'transparent' },new go.Binding("source")))
);
// 如果状态为text  则新增一个文本
itemtemplates.add("text",$(go.Panel,$(go.TextBlock,new go.Binding("text"))));
数据
diagram.model = new go.GraphLinksModel( [{ key: "Alpha",info: [{ type: "text", text: "some text" },{ type: "button", text: "Click me!", handler: "alert"}]},{ key: "Beta",info: [{ type: "text", text: "first line" },{ type: "button", text: "First Button", handler: "alert"},{ type: "text", text: "second line" },{ type: "button", text: "Second Button", handler: "alert" }]}],[{ from: "Alpha", to: "Beta" }]);10.组
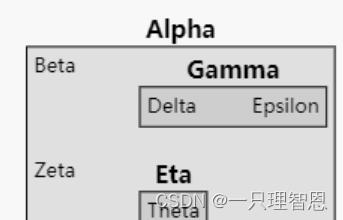
diagram.model.nodeDataArray = [{ key: "Alpha", isGroup: true },{ key: "Beta", group: "Alpha" },{ key: "Gamma", group: "Alpha", isGroup: true },{ key: "Delta", group: "Gamma" },{ key: "Epsilon", group: "Gamma" },{ key: "Zeta", group: "Alpha" },{ key: "Eta", group: "Alpha", isGroup: true},{ key: "Theta", group: "Eta" }];组样式 当在数据中 这行数据设置了 isGroup: true 则他使用的样式为下方
diagram.groupTemplate =$(go.Group, "Vertical",$(go.Panel, "Auto",$(go.Shape, "RoundedRectangle", // 围绕着占位符Placeholder{ parameter1: 14,fill: "rgba(128,128,128,0.33)" }),$(go.Placeholder, //占位符,表示所有构件的面积,{ padding: 5}) // 添加内边距),$(go.TextBlock, // group title{ alignment: go.Spot.Right, font: "Bold 12pt Sans-Serif" },new go.Binding("text", "key")));11.实例代码
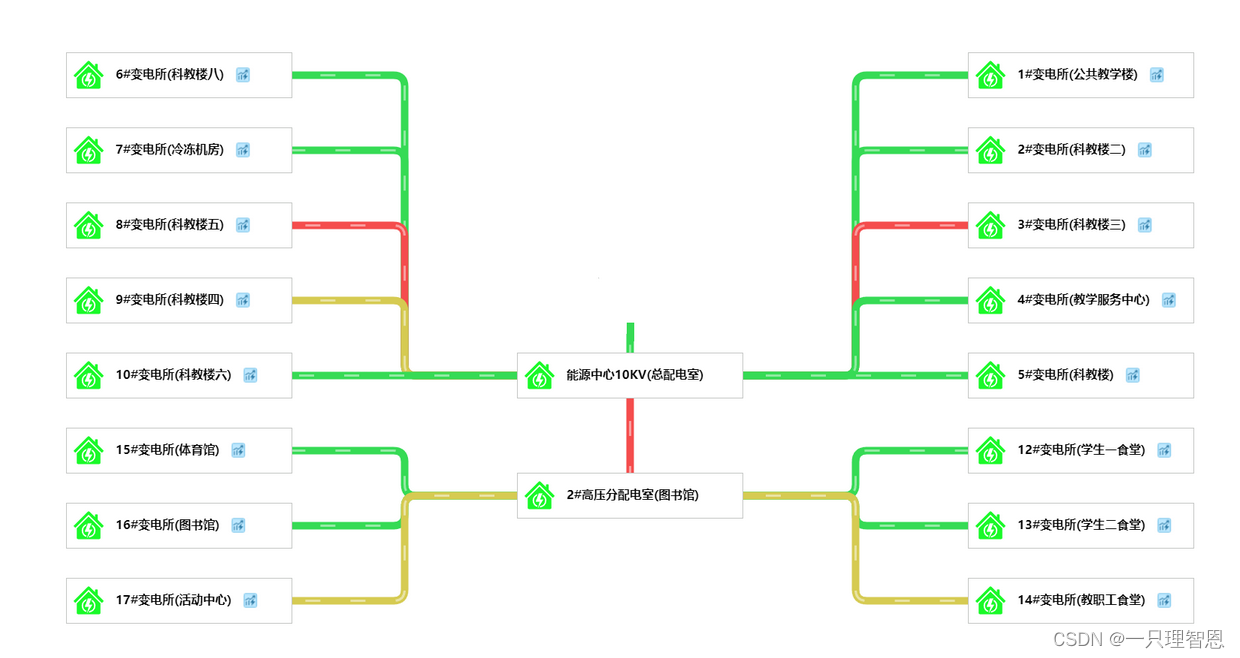
实例一
<template><div class="charts" id="charts"><div class="inCharts" id="myDiagramDiv"></div><el-dialog v-model="isShow" width="500" draggable :modal="false"><div style="margin-bottom: 20px;"><el-radio-group v-model="nowChoow"><el-radio-button v-for="(item, index) in allData" :label="item.lineDescribe" :key="index"@click="changeData(item)" /></el-radio-group></div><table style="width: 100%;" border="1" cellspacing="1"><thead><tr><th colspan="2" id="lineTd"><span style="float:left;margin-top:6px;">名称</span><span style="float:right;margin-top:-4px;">相</span></th><th>A</th><th>B</th><th>C</th><th>总</th></tr></thead><tbody><tr><td colspan="2">电流(A)</td><td class="orange">{{ tableData.ycIa }}</td><td class="green">{{ tableData.ycIb }}</td><td class="red">{{ tableData.ycIc }}</td><td>-</td></tr><tr><td colspan="2">电压(V)</td><td class="orange">{{ tableData.ycUa }}</td><td class="green">{{ tableData.ycUb }}</td><td class="red">{{ tableData.ycUc }}</td><td>-</td></tr><tr><td colspan="2"><div>电压(V)</div><div>AB/BC/CA</div></td><td class="orange">{{ tableData.ycUab }}</td><td class="green">{{ tableData.ycUbc }}</td><td class="red">{{ tableData.ycUca }}</td><td>-</td></tr><tr><td colspan="2">有功功率(kW)</td><td class="orange">{{ tableData.ycPa }}</td><td class="green">{{ tableData.ycPb }}</td><td class="red">{{ tableData.ycPc }}</td><td class="fff">{{ (tableData.ycPa + tableData.ycPb + tableData.ycPc).toFixed(2) }}</td></tr><tr><td colspan="2">无功功率(kVar)</td><td class="orange">{{ tableData.ycQa }}</td><td class="green">{{ tableData.ycQb }}</td><td class="red">{{ tableData.ycQc }}</td><td class="fff">{{ (tableData.ycQa + tableData.ycQb + tableData.ycQc).toFixed(2) }}</td></tr><!-- <tr><td colspan="2">视在功率(kVA)</td><td class="orange"></td><td  class="green"></td><td class="red"></td><td class="fff"></td></tr><tr><td rowspan="2">总谐波</td><td>电流(%)</td><td class="orange"></td><td  class="green"></td><td class="red"></td><td class="fff"></td></tr><tr><td>电压(%)</td><td class="orange"></td><td  class="green"></td><td class="red"></td><td class="fff"></td></tr><tr><td colspan="2">功率因数</td><td class="orange"></td><td  class="green"></td><td class="red"></td><td class="fff"></td></tr><tr><td colspan="2">本月电度(kwh)</td><td class="fff" colspan="4"></td></tr><tr><td colspan="2">有功总电度(kWh)</td><td class="fff" colspan="4"></td></tr><tr><td colspan="2">频率(Hz)</td><td class="fff" colspan="4"></td></tr> --></tbody></table></el-dialog><el-dialog v-model="showDetail" :title="title" width="500" draggable :modal="false" :show-close="false"><el-form :model="form" label-width="120px"><el-form-item label="用电量"><span v-if="form.thisYearTotal">{{ form.thisYearTotal }}</span></el-form-item><el-form-item label="用电损耗"><span v-if="form.thisYearLoss">{{ form.thisYearLoss }}</span></el-form-item><el-form-item label="温度"><span v-if="form.temperature">{{ form.temperature }}</span></el-form-item><el-form-item label="湿度"><span v-if="form.humidity">{{ form.humidity }}</span></el-form-item></el-form></el-dialog></div>
</template><script setup>// 引入 ref
import { ref, onMounted } from 'vue'
import { getDataYCRealTime, getEnergyLossTemperature } from "@/api/index"
import go from 'gojs' //在export default前
import { useRouter } from "vue-router";
const router = useRouter();
const nowChoow = ref("")
const allData = ref([])
const $ = go.GraphObject.make;
const width = ref('840px')
const height = ref("180px")
const isShow = ref(false)
const showDetail = ref(false)
const tableData = ref({})
const timeOut = ref('')
const form = ref({})
const title = ref("")
const mapPicSrc = ref(new URL(`@/assets/charts/bdf.png`, import.meta.url).href)
const DetailSrc = ref(new URL(`@/assets/charts/detail.png`, import.meta.url).href)
const data = ref([{ key: "0", name: "国家电网", source: '', loc: '100 -100', width: 0, height: 0 },{key: "19", parent: "0", name: "能源中心10KV(总配电室)", source: mapPicSrc.value, loc: '0 0', color: '#36DB55', width: 300, height: 60},{key: "1", parent: "19", name: "1#变电所(公共教学楼)", source: mapPicSrc.value, loc: '600 -400', color: '#36DB55', lineCode: "A01,B01", width: 300, height: 60, info: [{ type: "button", source: DetailSrc.value }]},{key: "2", parent: "19", name: "2#变电所(科教楼二)", source: mapPicSrc.value, loc: '600 -300', color: '#36DB55', lineCode: "A02,B02", width: 300, height: 60, info: [{ type: "button", source: DetailSrc.value }]},{key: "3", parent: "19", name: "3#变电所(科教楼三)", source: mapPicSrc.value, loc: '600 -200', color: '#F54D4D', lineCode: "B03,A03", width: 300, height: 60, info: [{ type: "button", source: DetailSrc.value }]},{key: "4", parent: "19", name: "4#变电所(教学服务中心)", source: mapPicSrc.value, loc: '600 -100', color: '#36DB55', lineCode: "B04,A04", width: 300, height: 60, info: [{ type: "button", source: DetailSrc.value }]},{key: "5", parent: "19", name: "5#变电所(科教楼)", source: mapPicSrc.value, loc: '600 0', color: '#36DB55', lineCode: "B05,A05", width: 300, height: 60, info: [{ type: "button", source: DetailSrc.value }]},{key: "6", parent: "19", name: "6#变电所(科教楼八)", source: mapPicSrc.value, loc: '-600 -400', color: '#36DB55', lineCode: "A06,B06", width: 300, height: 60, info: [{ type: "button", source: DetailSrc.value }]},{key: "7", parent: "19", name: "7#变电所(冷冻机房)", source: mapPicSrc.value, loc: '-600 -300', color: '#36DB55', lineCode: "B07,A07", width: 300, height: 60, info: [{ type: "button", source: DetailSrc.value }]},{key: "8", parent: "19", name: "8#变电所(科教楼五)", source: mapPicSrc.value, loc: '-600 -200', color: '#F54D4D', lineCode: "B08,A08", width: 300, height: 60, info: [{ type: "button", source: DetailSrc.value }]},{key: "9", parent: "19", name: "9#变电所(科教楼四)", source: mapPicSrc.value, loc: '-600 -100', color: '#D6CB52', lineCode: "B09,A09", width: 300, height: 60, info: [{ type: "button", source: DetailSrc.value }]},{key: "10", parent: "19", name: "10#变电所(科教楼六)", source: mapPicSrc.value, loc: '-600 0', color: '#36DB55', lineCode: "B10,A10", width: 300, height: 60, info: [{ type: "button", source: DetailSrc.value }]},{key: "18", parent: "19", name: "2#高压分配电室(图书馆)", source: mapPicSrc.value, loc: '0 160', color: '#F54D4D', lineCode: "A20,B20", width: 300, height: 60},{key: "12", parent: "18", name: "12#变电所(学生一食堂)", source: mapPicSrc.value, loc: '600 100', color: '#36DB55', lineCode: "A12,B12", width: 300, height: 60, info: [{ type: "button", source: DetailSrc.value }]},{key: "13", parent: "18", name: "13#变电所(学生二食堂)", source: mapPicSrc.value, loc: '600 200', color: '#36DB55', lineCode: "A13,B13", width: 300, height: 60, info: [{ type: "button", source: DetailSrc.value }]},{key: "14", parent: "18", name: "14#变电所(教职工食堂)", source: mapPicSrc.value, loc: '600 300', color: '#D6CB52', lineCode: "A14,B14", width: 300, height: 60, info: [{ type: "button", source: DetailSrc.value }]},{key: "15", parent: "18", name: "15#变电所(体育馆)", source: mapPicSrc.value, loc: '-600 100', color: '#36DB55', lineCode: "B15,A15", width: 300, height: 60, info: [{ type: "button", source: DetailSrc.value }]},{key: "16", parent: "18", name: "16#变电所(图书馆)", source: mapPicSrc.value, loc: '-600 200', color: '#36DB55', lineCode: "B16,A16", width: 300, height: 60, info: [{ type: "button", source: DetailSrc.value }]},{key: "17", parent: "18", name: "17#变电所(活动中心)", source: mapPicSrc.value, loc: '-600 300', color: '#D6CB52', lineCode: "B17,A17", width: 300, height: 60, info: [{ type: "button", source: DetailSrc.value }]}
])const changeData = (data) => {tableData.value = data
}const inTk = (e, obj) => {// 阻止单机事件clearTimeout(timeOut.value)title.value = obj.part.data.name// console.log(obj.part.data);getEnergyLossTemperature(obj.part.data.key).then(({ data }) => {if (data) {form.value = data} else {form.value = {}}showDetail.value = true})}const init = () => {var myDiagram = $(go.Diagram, "myDiagramDiv",//为DIV.HTML元素创建一个画布{//设置画布配置initialAutoScale: go.Diagram.Uniform,  // 缩放以显示所有内容maxSelectionCount: 1,  // 不要让用户一次选择多于一个的东西isReadOnly: true,contentAlignment: go.Spot.Center,// layout: $(go.TreeLayout,//     { angle: 90, layerSpacing: 35 })});// Horizontalvar itemtemplates = new go.Map()itemtemplates.add("text",$(go.Panel,$(go.TextBlock,new go.Binding("text"))));// the template when type == "button"itemtemplates.add("button",$("Button",{margin: 2,'ButtonBorder.strokeWidth': 0,'ButtonBorder.fill': '#fff',click: inTk,},$(go.Picture, new go.Binding("source"), { margin: 1, width: 20, height: 20, background: 'transparent' },)),);myDiagram.nodeTemplate =$(go.Node, "auto",$(go.Shape,new go.Binding("width"),new go.Binding("height"),{figure: "Rectangle", margin: 0, fill: 'transparent', stroke: "#C4C6C4", strokeWidth: 1,}),new go.Binding("location", "loc", go.Point.parse),$(go.Panel, 'Horizontal',{ background: "transparent", },$(go.Picture,{ margin: 10, background: 'transparent' },new go.Binding("source")),$(go.TextBlock, "Default Text",{ margin: 6, stroke: "#000", font: "bold 16px sans-serif" },new go.Binding("text", "name")),$(go.Panel, "Vertical",{margin: 3,defaultAlignment: go.Spot.Left,itemCategoryProperty: "type",  // this property controls the template useditemTemplateMap: itemtemplates  // map was defined above},new go.Binding("itemArray", "info"))// $("Button",//     {//         margin: 2,//         click: inTk//     },//     $(go.Picture, new go.Binding("source"), { margin: 1, width: 12, height: 12, background: 'transparent' },)),),// $("TreeExpanderButton",//     { alignment: go.Spot.Bottom, alignmentFocus: go.Spot.Top },//     { visible: true }));var opacity = 1;var down = true;function loop() {var diagram = myDiagram;setTimeout(() => {var oldskips = diagram.skipsUndoManager;diagram.skipsUndoManager = true;diagram.links.each(link => {var shape = link.findObject("PIPE");var off = shape.strokeDashOffset - 3;// animate (move) the stroke dashshape.strokeDashOffset = (off <= 0) ? 60 : off;// animte (strobe) the opacity:if (down) opacity = opacity - 0.01;else opacity = opacity + 0.003;if (opacity <= 0) { down = !down; opacity = 0; }if (opacity > 1) { down = !down; opacity = 1; }shape.opacity = opacity;});diagram.skipsUndoManager = oldskips;loop();}, 60);}myDiagram.linkTemplate =$(go.Link,{layerName: "Background",routing: go.Link.Orthogonal,corner: 15,reshapable: true,resegmentable: true,},$(go.Shape, new go.Binding("stroke", "color"), { isPanelMain: true, strokeWidth: 10 }),$(go.Shape, { isPanelMain: true, stroke: "white", strokeWidth: 3, name: "PIPE", strokeDashArray: [20, 40] }));var model = $(go.TreeModel);model.nodeDataArray = data.value// 单击事件myDiagram.addDiagramListener("ObjectSingleClicked",(e) => {timeOut.value = setTimeout(() => {var part = e.subject.part;if (!(part instanceof go.Link)) {console.log(part.data.key);if (part.data.name == '1#变电所(公共教学楼)') {router.push("oneCharts");}} else {if (part.data.key != 19) {let arr = e.subject.part.data.lineCode.split(",")getDataYCRealTime(arr).then(({ data }) => {if (data.length) {allData.value = datanowChoow.value = data[0].lineDescribetableData.value = data[0]}setTimeout(() => {isShow.value = true})})}}}, 300);});myDiagram.model = modelloop()// setTimeout(() => {//     data.value[1].color = 'red'//     myDiagram.div = null;//     init()// }, 3000)
}onMounted(() => {init()
})
</script><style scoped lang="scss">
.fff {color: #000;font-weight: 600;
}.orange {color: #E6A72E;font-weight: 600;
}.green {color: #2ED31B;font-weight: 600;
}.red {color: #D52524;font-weight: 600;
}table {border-collapse: collapse; //合并为一个单一的边框border-color: #dfe6ec; //边框颜色按实际自定义即可text-align: center;
}thead tr th {background-color: #f8f8f9; //设置表格标题背景色padding: 12px;text-align: center;
}tbody tr td {padding: 6px;text-align: center;height: 34px; //设置单元格最小高度
}.charts {height: 100%;width: 100%;overflow: hidden;position: relative;
}.inCharts {height: 100%;width: 100%;
}.info {position: absolute;width: v-bind(width);height: v-bind(height);z-index: 1000;padding: 4px;background: url('@/assets/charts/bg.png');background-size: 100% 100%;
}#lineTd {background: #fff url(data:image/svg+xml;base64,PHN2ZyB4bWxucz0iaHR0cDovL3d3dy53My5vcmcvMjAwMC9zdmciIHdpZHRoPSIxMDAlIiBoZWlnaHQ9IjEwMCUiPjxsaW5lIHgxPSIwIiB5MT0iMCIgeDI9IjEwMCUiIHkyPSIxMDAlIiBzdHJva2U9ImJsYWNrIiBzdHJva2Utd2lkdGg9IjEiLz48L3N2Zz4=) no-repeat 100% center;
}
</style>
实例二
<template><div class="charts"><div class="inCharts" id="myDiagramDiv"></div><el-dialog v-model="isShow" :title="title" width="500" draggable :modal="false" :show-close="false"><table style="width: 100%;" border="1" cellspacing="1"><thead><tr><th colspan="2" id="lineTd"><span style="float:left;margin-top:6px;">名称</span><span style="float:right;margin-top:-4px;">相</span></th><th>A</th><th>B</th><th>C</th><th>总</th></tr></thead><tbody><tr><td colspan="2">电流(A)</td><td class="orange">{{ form.yc_ia }}</td><td class="green">{{ form.yc_ib }}</td><td class="red">{{ form.yc_ic }}</td><td>-</td></tr><tr><td colspan="2">电压(V)</td><td class="orange">{{ form.yc_ua }}</td><td class="green">{{ form.yc_ub }}</td><td class="red">{{ form.yc_uc }}</td><td>-</td></tr><tr><td colspan="2"><div>电压(V)</div><div>AB/BC/CA</div></td><td class="orange">{{ form.yc_uab }}</td><td class="green">{{ form.yc_ubc }}</td><td class="red">{{ form.yc_uca }}</td><td>-</td></tr><tr><td colspan="2">有功功率(kW)</td><td class="orange">{{ form.yc_pa }}</td><td class="green">{{ form.yc_pb }}</td><td class="red">{{ form.yc_pc }}</td><td class="fff">{{ (form.yc_pa + form.yc_pb + form.yc_pc).toFixed(2) }}</td></tr><tr><td colspan="2">无功功率(kVar)</td><td class="orange">{{ form.yc_qa }}</td><td class="green">{{ form.yc_qb }}</td><td class="red">{{ form.yc_qc }}</td><td class="fff">{{ (form.yc_qa + form.yc_qb + form.yc_qc).toFixed(2) }}</td></tr><!-- <tr><td colspan="2">视在功率(kVA)</td><td class="orange"></td><td  class="green"></td><td class="red"></td><td class="fff"></td></tr><tr><td rowspan="2">总谐波</td><td>电流(%)</td><td class="orange"></td><td  class="green"></td><td class="red"></td><td class="fff"></td></tr><tr><td>电压(%)</td><td class="orange"></td><td  class="green"></td><td class="red"></td><td class="fff"></td></tr><tr><td colspan="2">功率因数</td><td class="orange"></td><td  class="green"></td><td class="red"></td><td class="fff"></td></tr><tr><td colspan="2">本月电度(kwh)</td><td class="fff" colspan="4"></td></tr><tr><td colspan="2">有功总电度(kWh)</td><td class="fff" colspan="4"></td></tr><tr><td colspan="2">频率(Hz)</td><td class="fff" colspan="4"></td></tr> --></tbody></table></el-dialog><el-dialog v-model="showNormol" width="500" draggable :modal="false" :show-close="false"></el-dialog></div>
</template><script setup>
import { getDataYxRealtimeYxon, getDataYcRealtimeABC } from "@/api"
// 引入 ref
import { ref, onMounted } from 'vue'
import go from 'gojs' //在export default前
import { useRouter } from "vue-router";
const title = ref("")
const router = useRouter();
const $ = go.GraphObject.make;
const width = ref('300px')
const height = ref("100px")
const isShow = ref(false)
const showNormol = ref(false)
const form = ref({})
const gyg = ref(new URL(`@/assets/charts/gyg.png`, import.meta.url).href)
const blg = ref(new URL(`@/assets/charts/blg.png`, import.meta.url).href)
const gycxg = ref(new URL(`@/assets/charts/gycxg.png`, import.meta.url).href)
const bdqg = ref(new URL(`@/assets/charts/bdqg.png`, import.meta.url).href)
const jxg = ref(new URL(`@/assets/charts/jxg.png`, import.meta.url).href)
const llg = ref(new URL(`@/assets/charts/llg.png`, import.meta.url).href)
const drqg = ref(new URL(`@/assets/charts/drqg.png`, import.meta.url).href)
const kdx = ref(new URL(`@/assets/charts/kdg.png`, import.meta.url).href)
const normol = ref(new URL(`@/assets/charts/normol.png`, import.meta.url).href)
const mol = ref(new URL(`@/assets/charts/mol.png`, import.meta.url).href)
const timeOut = ref("")
const datas = ref([{ key: "0", name: "A", source: '', loc: '-540 -200', width: 0, height: 0 },{key: "1", name: "高压进线柜", source: gyg.value, loc: '-540 -100', color: '#36DB55', width: 154, height: 50, deviceCode: "100"},{key: "2", name: "避雷柜", source: blg.value, loc: '-386 -100', color: '#36DB55', width: 154, height: 50, deviceCodes: "101"},{key: "3", name: "高压出线柜", source: gycxg.value, loc: '-232 -100', color: '#F54D4D', width: 154, height: 50, deviceCode: "102"},{key: "4", name: "变电器柜", source: bdqg.value, loc: '-78 -100', width: 154, height: 50, deviceCode: "103", color: '#36DB55'},{key: "5", name: "低压进线柜", source: jxg.value, loc: '76 -100', color: '#36DB55', width: 154, height: 50, deviceCode: "104"},{key: "6", name: "联络柜", source: llg.value, loc: '230 -100', color: '#36DB55', width: 154, height: 50, deviceCode: "105"},{key: "7", name: "电容器柜", source: drqg.value, loc: '384 -100', color: '#F54D4D', width: 154, height: 50, deviceCode: "106"},{ key: "8", name: "LA3馈电箱", source: kdx.value, loc: '-540 0', color: '#36DB55', width: 180, height: 300 },{ key: "9", name: "LA4馈电箱", source: kdx.value, loc: '-360 0', color: '#36DB55', width: 180, height: 300 },{ key: "10", name: "LA5馈电箱", source: kdx.value, loc: '-180 0', color: '#36DB55', width: 180, height: 300 },{ key: "11", name: "LA6馈电箱", source: kdx.value, loc: '0 0', color: '#36DB55', width: 180, height: 300 },{ key: "12", name: "LA7馈电箱", source: kdx.value, loc: '180 0', color: '#F54D4D', width: 180, height: 300 },{key: "13", name: "LA8馈电箱", source: kdx.value, loc: '360 0', color: '#F54D4D', width: 180, height: 300, info: [{ type: "text", text: "some text" },{ type: "pic", source: gyg.value }]},{ key: "14", name: "LB8馈电箱", source: kdx.value, loc: '560 0', color: '#F54D4D', width: 180, height: 300 },{ key: "15", name: "LB7馈电箱", source: kdx.value, loc: '740 0', color: '#F54D4D', width: 180, height: 300 },{ key: "16", name: "LB6馈电箱", source: kdx.value, loc: '920 0', color: '#F54D4D', width: 180, height: 300 },{ key: "17", name: "LB5馈电箱", source: kdx.value, loc: '1100 0', color: '#F54D4D', width: 180, height: 300 },{ key: "18", name: "LB4馈电箱", source: kdx.value, loc: '1280 0', color: '#F54D4D', width: 180, height: 300 },{ key: "19", name: "LB3馈电箱", source: kdx.value, loc: '1460 0', color: '#F54D4D', width: 180, height: 300 },{key: "20", name: "电容器柜", source: drqg.value, loc: '560 -100', color: '#F54D4D', width: 180, height: 50, deviceCode: "157"},{key: "21", name: "低压进线柜", source: jxg.value, loc: '740 -100', color: '#F54D4D', width: 180, height: 50, deviceCode: "156"},{key: "22", name: "变电器柜", source: bdqg.value, loc: '920 -100', color: '#F54D4D', width: 180, height: 50, deviceCode: "155"},{key: "23", name: "高压出线柜", source: gycxg.value, loc: '1100 -100', color: '#F54D4D', width: 180, height: 50, deviceCode: "154"},{key: "24", name: "避雷柜", source: blg.value, loc: '1280 -100', color: '#F54D4D', width: 180, height: 50, deviceCodes: "153"},{key: "25", name: "高压进线柜", source: gyg.value, loc: '1460 -100', color: '#F54D4D', width: 180, height: 50, deviceCode: "152"},{ key: "26", name: "B", source: '', loc: '1460 -200', width: 0, height: 0 },
])const link = ref([{ from: "0", to: "1", color: '#36DB55' },{ from: "26", to: "25", color: '#36DB55' },// { from: "1", to: "2", color: '#36DB55'},// { from: "3", to: "2", color: '#36DB55'},// { from: "4", to: "3", color: '#36DB55'},// { from: "2", to: "5", color: '#36DB55'},// { from: "2", to: "6", color: '#36DB55'},// { from: "2", to: "7", color: '#36DB55'},// { from: "2", to: "8", color: '#36DB55'},// { from: "2", to: "9", color: '#36DB55'},
])const inTk = (e, obj) => {// 阻止单机事件clearTimeout(timeOut.value)showNormol.value = true
}const init = () => {var myDiagram = $(go.Diagram, "myDiagramDiv",//为DIV.HTML元素创建一个画布{//设置画布配置initialAutoScale: go.Diagram.Uniform,  // 缩放以显示所有内容maxSelectionCount: 1,  // 不要让用户一次选择多于一个的东西isReadOnly: true,contentAlignment: go.Spot.Center,});var itemtemplates = new go.Map()var templates = new go.Map()itemtemplates.add("pic",$(go.Panel,$(go.Picture,{ margin: 10, width: 30, height: 30, background: 'transparent' },new go.Binding("source"))));itemtemplates.add("text",$(go.Panel,$(go.TextBlock,new go.Binding("text"))));templates.add("pic",$("Button",{margin: 2,'ButtonBorder.strokeWidth': 0,'ButtonBorder.fill': '#fff',click: inTk,},$(go.Picture, new go.Binding("source"), { margin: 1, width: 20, height: 20, background: 'transparent' },)));myDiagram.nodeTemplate =$(go.Node, "auto",$(go.Shape,new go.Binding("width", "width"),new go.Binding("height", "height"),{figure: "Rectangle", margin: 0, fill: 'transparent', stroke: "#C4C6C4", strokeWidth: 1}),new go.Binding("location", "loc", go.Point.parse),$(go.Panel, "Vertical",$(go.Panel, 'Horizontal',{ background: "transparent", },$(go.Picture,{ margin: 10, width: 24, height: 24, background: 'transparent' },new go.Binding("source")),$(go.TextBlock, "Default Text",{ margin: 6, stroke: "#000", font: "bold 12px sans-serif" },new go.Binding("text", "name")),$(go.Panel, "Vertical",{margin: 3,defaultAlignment: go.Spot.Left,itemCategoryProperty: "type",  // this property controls the template useditemTemplateMap: templates  // map was defined above},new go.Binding("itemArray", "src"))),$(go.Panel, "Vertical",{margin: 3,defaultAlignment: go.Spot.Left,itemCategoryProperty: "type",  // this property controls the template useditemTemplateMap: itemtemplates  // map was defined above},new go.Binding("itemArray", "info"))),);var opacity = 1;var down = true;function loop() {var diagram = myDiagram;setTimeout(() => {var oldskips = diagram.skipsUndoManager;diagram.skipsUndoManager = true;diagram.links.each(link => {var shape = link.findObject("PIPE");var off = shape.strokeDashOffset - 3;// animate (move) the stroke dashshape.strokeDashOffset = (off <= 0) ? 60 : off;// animte (strobe) the opacity:if (down) opacity = opacity - 0.01;else opacity = opacity + 0.003;if (opacity <= 0) { down = !down; opacity = 0; }if (opacity > 1) { down = !down; opacity = 1; }shape.opacity = opacity;});diagram.skipsUndoManager = oldskips;loop();}, 60);}myDiagram.linkTemplate =$(go.Link,{layerName: "Background",routing: go.Link.Orthogonal,corner: 15,reshapable: true,resegmentable: true,},$(go.Shape, new go.Binding("stroke", "color"), { isPanelMain: true, strokeWidth: 10 }),$(go.Shape, { isPanelMain: true, stroke: "white", strokeWidth: 3, name: "PIPE", strokeDashArray: [20, 40] }));var model = $(go.GraphLinksModel);model.linkDataArray = link.valuemodel.nodeDataArray = datas.value// 单击事件myDiagram.addDiagramListener("ObjectSingleClicked",(e) => {timeOut.value = setTimeout(() => {var part = e.subject.part;if (!(part instanceof go.Link)) {if (part.data.name.search("馈电箱") == -1) {getDataYcRealtimeABC(part.data.deviceCode).then(({ data }) => {console.log(data);if (data && data.length) {form.value = data[0]}title.value = part.data.nameisShow.value = true})} else {if (part.data.name == 'LA3馈电箱') {router.push("oneLA3");}}} else {console.log(e.subject.part.data);}}, 300)});myDiagram.model = modelloop()// setTimeout(() => {//     data.value[1].color = 'red'//     myDiagram.div = null;//     init()// }, 3000)
}onMounted(() => {getDataYxRealtimeYxon(1).then(({ data }) => {datas.value.forEach((item, index) => {data.forEach((l, i) => {if (item.deviceCode == l.deviceCode) {if (l.yxOn == 1) {datas.value[index].src = [{ type: "pic", source: normol.value }]} else {datas.value[index].src = [{ type: "pic", source: mol.value }]}}})});init()})// document.getElementById('charts').addEventListener("mousedown", (e) => {//     isShow.value = false//     x.value = e.x//     y.value = e.y// })})
</script><style scoped lang="scss">
.charts {height: 100%;width: 100%;overflow: hidden;position: relative;
}.inCharts {height: 100%;width: 100%;
}.info {position: absolute;width: v-bind(width);height: v-bind(height);background: red;z-index: 1000;padding: 10px;
}.title {position: absolute;top: 0;left: 0;z-index: 999;height: 60px;width: 260px;display: flex;justify-content: center;align-items: center;font-size: 20px;font-weight: 600;
}#lineTd {background: #fff url(data:image/svg+xml;base64,PHN2ZyB4bWxucz0iaHR0cDovL3d3dy53My5vcmcvMjAwMC9zdmciIHdpZHRoPSIxMDAlIiBoZWlnaHQ9IjEwMCUiPjxsaW5lIHgxPSIwIiB5MT0iMCIgeDI9IjEwMCUiIHkyPSIxMDAlIiBzdHJva2U9ImJsYWNrIiBzdHJva2Utd2lkdGg9IjEiLz48L3N2Zz4=) no-repeat 100% center;
}.fff {color: #000;font-weight: 600;
}.orange {color: #E6A72E;font-weight: 600;
}.green {color: #2ED31B;font-weight: 600;
}.red {color: #D52524;font-weight: 600;
}table {border-collapse: collapse; //合并为一个单一的边框border-color: #dfe6ec; //边框颜色按实际自定义即可text-align: center;
}thead tr th {background-color: #f8f8f9; //设置表格标题背景色padding: 12px;text-align: center;
}tbody tr td {padding: 6px;text-align: center;height: 34px; //设置单元格最小高度
}
</style>
12.进阶
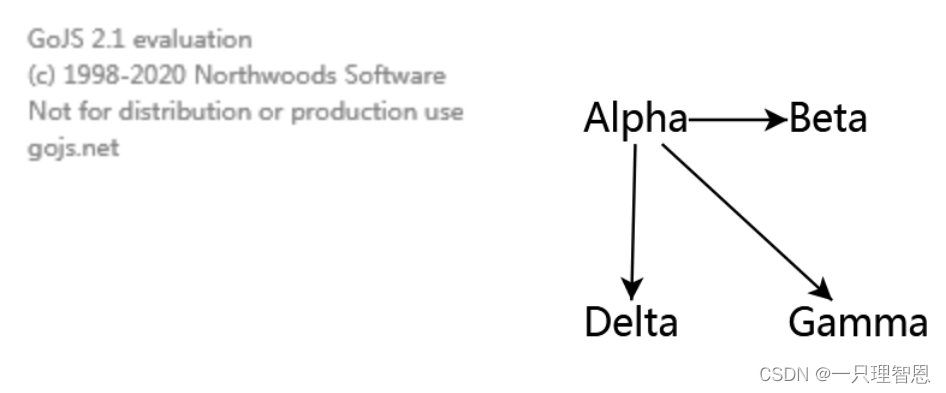
<!doctype html>
<html>
<head><script src="https://unpkg.com/gojs/release/go.js"></script><script>function init() {var $ = go.GraphObject.make;myDiagram = $(go.Diagram, "myDiagramDiv");var nodeDataArray = [{ key: "Alpha"},{ key: "Beta" },{ key: "Delta"},{ key: "Gamma" }];var linkDataArray = [{ to: "Beta", from: "Alpha" },{ to: "Delta", from: "Alpha" },{ to: "Gamma", from: "Alpha" }];myDiagram.model = new go.GraphLinksModel(nodeDataArray, linkDataArray);}</script>
</head>
<body onload="init()"><div id="myDiagramDiv"  style="width:700px; height:150px"></div></body>
</html>
该段代码对应的关系图如下所示:
上面的关系图的节点外观过于简单,如果我们想要得到更美观一些的关系图,例如下面这样的该怎么做呢?这时候就需要利用到gojs提供的模板(template)了,模板相当于盛放节点的容器,你可以指定这个容器的形状,填充色等等。
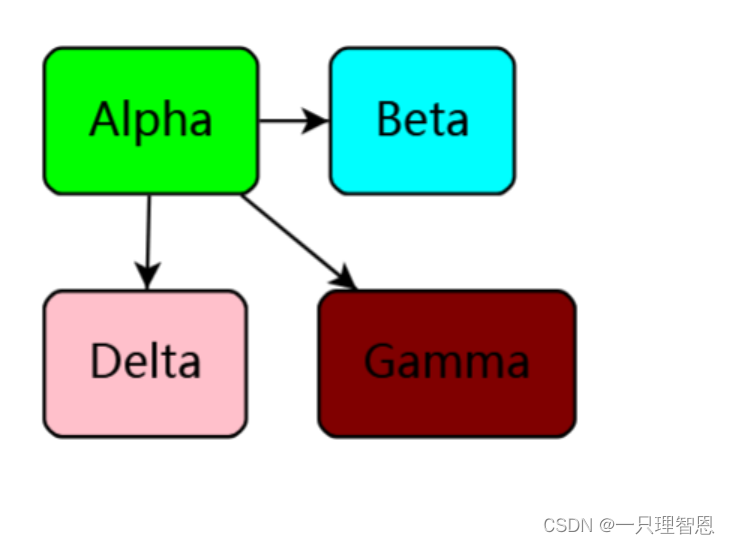 要想实现上述美化后的关系图,只需要在原有的代码基础上做如下两处改动:
var nodeDataArray = [{ key: "Alpha", color: "lime"},{ key: "Beta",color: "cyan" },{ key: "Delta",color: "pink"},{ key: "Gamma" ,color: "maroon"}];第一处改动是对nodeDataArray数组中的每个对象元素增加一个color属性用来指定节点的颜色。
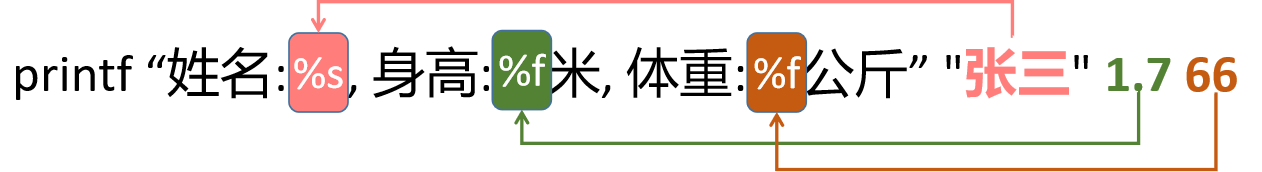
myDiagram.nodeTemplate =$(go.Node, "Auto",$(go.Shape, "RoundedRectangle",4 new go.Binding("fill", "color")),$(go.TextBlock,7 new go.Binding("text", "key")));第二处改动是为视图myDiagram中盛放每个节点的容器nodeTemplate属性赋值,为该容器赋值的构造器可以接收多个参数,第一个参数是类型参数,这里是go.Node,表示要改变节点的样式。第二个参数是容器内部的布局,这里是"Auto",它的含义是这个容器里至少包含两个元素,第一个元素会包裹容器里面其他的元素。第三个参数是go.Shape,它代表容器里的第一个元素,这里我们指定它的形状是圆角矩形,即"RoundedRectangle",new go.Binding("fill", "color")这句话用来设定每个节点容器的填充色,通过new关键字创建一个新的go.Binding数据绑定对象可以让我们把容器填充色属性fill和nodeDataArray中每个节点对象的color属性绑定,使得每个节点容器呈现出我们指定的内部填充色。第四个参数是go.TextBlock,它是文本框,new go.Binding("text", "key")这句话用来将文本框里的文字与nodeDataArray中每个节点的 key值绑定。由于设置了auto属性的缘故,文本框被包裹在圆角矩形里面。
除了可以把每个节点放在容器里来改变节点的外观外,我们还可以用类似的方法通过给视图myDiagram中负责管理边的linkTemplate属性赋值来调整边的样式,同样也只需要在原有的代码基础上做如下两处改动:
var linkDataArray = [{ to: "Beta", from: "Alpha",color: "red" },{ to: "Delta", from: "Alpha" },{ to: "Gamma", from: "Alpha" }];上面的代码在linkDataArray每个边对象属性中加入一个color属性将其值设为"red"。
myDiagram.linkTemplate =$(go.Link,$(go.Shape, { strokeWidth: 3 },new go.Binding("stroke", "color")),$(go.Shape,{ toArrow: "Standard", stroke: null },new go.Binding("fill", "color")));第二处改动是为视图myDiagram中linkTemplate属性复制,为该容器赋值的构造器可以接收多个参数,第一个参数是类型参数,这里是go.Link,表示用来改变连线(边)的样式。第二个参数是形状参数go.Shape,,它代表边的样式,这里我们指定边的粗细为3,new go.Binding("stroke", "color")这句话用来设定边的颜色,通过new关键字创建一个新的go.Binding数据绑定对象可以让我们把边颜色属性stroke和linkDataArray中每个边对象的color属性绑定,使得节点之间的边呈现出我们在linkDataArray里指定的颜色。第三个参数是形状参数go.Shape,,它代表箭头的样式,toArrow:" Standard "表示要在边的终点加上箭头, stroke:null表示是空心箭头; new go.Binding("fill", "color")这句话用来设定箭头的颜色,通过new关键字创建一个新的go.Binding数据绑定对象可以让我们把箭头颜色属性fill和linkDataArray中每个边对象的color属性绑定,使得箭头呈现出我们在linkDataArray里指定的颜色。
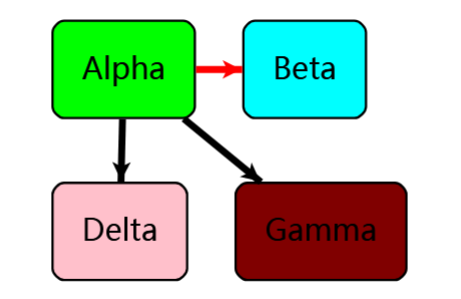
实现上图的完整代码如下:
<!doctype html>
<html>
<head><script src="https://unpkg.com/gojs/release/go.js"></script><script>function init() {var $ = go.GraphObject.make;myDiagram = $(go.Diagram, "myDiagramDiv");var nodeDataArray = [{ key: "Alpha", color: "lime"},{ key: "Beta",color: "cyan" },{ key: "Delta",color: "pink"},{ key: "Gamma" ,color: "maroon"}];var linkDataArray = [{ to: "Beta", from: "Alpha",color: "red" },{ to: "Delta", from: "Alpha" },{ to: "Gamma", from: "Alpha" }];myDiagram.model = new go.GraphLinksModel(nodeDataArray, linkDataArray);myDiagram.nodeTemplate =$(go.Node, "Auto",$(go.Shape, "RoundedRectangle",new go.Binding("fill", "color")),$(go.TextBlock,new go.Binding("text", "key")));myDiagram.linkTemplate =$(go.Link,$(go.Shape, { strokeWidth: 3 },new go.Binding("stroke", "color")),$(go.Shape,{ toArrow: "Standard", stroke: null },new go.Binding("fill", "color")));}</script>
</head>
<body onload="init()"><div id="myDiagramDiv" style="width:700px; height:150px"></div></body>
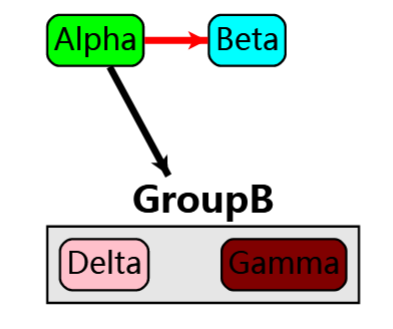
</html>如果要想给节点分组该怎么办呢?比如上面的Delta和Gamma两个节点都想把它们归入到"GroupB"里面,然后让节点Alpha指向GroupB。实现这个分组功能只需要对nodeDataArray和linkDataArray进行以下修改即可。
var nodeDataArray = [{ key: "Alpha", color: "lime"},{ key: "Beta",color: "cyan" },{ key: "GroupB", isGroup: true},{ key: "Delta", color: "pink", group: "GroupB"},{ key: "Gamma" ,color: "maroon", group: "GroupB"}];var linkDataArray = [{ to: "Beta", from: "Alpha",color: "red" },{ to: "GroupB", from: "Alpha" }最终效果如下图所示:
![[职场] 面试失败的解压方式是什么 #经验分享#职场发展#知识分享](https://img-blog.csdnimg.cn/img_convert/13872b155dc597139593e2c62a2f92ae.jpeg)

![[OPEN SQL] 新增数据](https://img-blog.csdnimg.cn/direct/683e3f80ba17428d87eec2fb61bc9634.png)


![[BIZ] - 1.金融交易系统特点](https://img-blog.csdnimg.cn/direct/6489c57a78dd4a3986cb1269c4e6dd2e.png)