目录
一、实验
1.环境
2.安装kind
3.安装Crane
二、问题
1.脚本安装prometheus报错
2.查看集群信息失败
3.Helm添加grafana 报错
4.查看crane资源失败
5.prometheus部署时kube-state-metrics 拉取镜像显示ImagePullBackOff
6.Crane 功能与架构
一、实验
1.环境
(1)主机
表1 主机
| 主机 | 架构 | 版本 | IP | 备注 |
| master1 | K8S master节点 | 1.20.6 | 192.168.204.180 | |
| Docker | 20.10.6 | |||
| Helm | 3.8.1 | |||
| kind | 0.14 | |||
| master2 | K8S master节点 | 1.20.6 | 192.168.204.181 | |
| node1 | K8S node节点 | 1.20.6 | 192.168.204.182 |
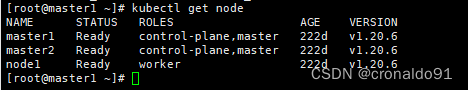
(2)查看集群状态
kubectl get node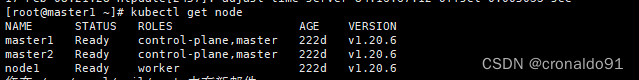
(3) 查看HELM版本
helm version

(4)查看Docker版本
docker -v![]()
2.安装kind
(1)安装
wget  https://github.com/kubernetes-sigs/kind/releases/download/v0.14.0/kind-linux-amd64mv kind-linux-amd64  /usr/bin/kind
chmod +x /usr/bin/kind
(2)查看kind版本
kind version![]()
3.安装Crane
(1)安装 Crane 以及其依赖 (Prometheus/Grafana)
① 第一种方式
curl -sf https://raw.githubusercontent.com/gocrane/crane/main/hack/local-env-setup.sh | sh -
②第二种方式
如果上面第一种方式安装命令报网络错误,可以下载本地的安装包执行安装
#!/usr/bin/env bashset -o errexit
set -o nounset
set -o pipefailfunction help()
{cat  <<EOFThe crane local environment setupUsage: local-env-setup.sh <[Options]>
Options:-h   --help           help for setup-m   --mirror         setup crane from helm mirror repo
EOF}FROM_MIRROR=falsewhile [ $# -gt 0 ]
docase $1 in-h|--help) help ; exit 1;;-m|--mirror) FROM_MIRROR=true ;;(-*) echo "$0: error - unrecognized option $1" 1>&2; help; exit 1;;(*) break;;esacshift
doneCRANE_KUBECONFIG="${HOME}/.kube/config_crane"
CRANE_CLUSTER_NAME="crane"PROMETHEUS_HELM_NAME="prometheus-community"
PROMETHEUS_HELM_URL="https://prometheus-community.github.io/helm-charts"
PROMETHEUS_VALUE_URL="https://raw.githubusercontent.com/gocrane/helm-charts/main/integration/prometheus/override_values.yaml"
GRAFANA_HELM_NAME="grafana"
GRAFANA_HELM_URL="https://grafana.github.io/helm-charts"
GRAFANA_HELM_PACKAGE_URL="https://github.com/grafana/helm-charts/releases/download/grafana-6.11.0/grafana-6.11.0.tgz"
GRAFANA_VALUE_URL="https://raw.githubusercontent.com/gocrane/helm-charts/main/integration/grafana/override_values.yaml"
CRANE_HELM_NAME="crane"
CRANE_HELM_URL="https://gocrane.github.io/helm-charts"# check if setup is from mirror repoif [ "$FROM_MIRROR" = true ]; thenPROMETHEUS_HELM_NAME="prometheus-community-gocrane"PROMETHEUS_HELM_URL="https://finops-helm.pkg.coding.net/gocrane/prometheus-community"PROMETHEUS_VALUE_URL="https://gitee.com/finops/helm-charts/raw/main/integration/prometheus/override_values.yaml"GRAFANA_HELM_NAME="grafana-gocrane"GRAFANA_HELM_URL="https://finops-helm.pkg.coding.net/gocrane/grafana"GRAFANA_HELM_PACKAGE_URL="https://finops-generic.pkg.coding.net/gocrane/generic/grafana-6.11.0.tgz\?version\=latest"GRAFANA_VALUE_URL="https://gitee.com/finops/helm-charts/raw/main/integration/grafana/override_values.yaml"CRANE_HELM_NAME="crane-mirror"CRANE_HELM_URL="https://finops-helm.pkg.coding.net/gocrane/gocrane"
fiecho "Step1: Create local cluster: " ${CRANE_KUBECONFIG}
kind delete cluster --name="${CRANE_CLUSTER_NAME}" 2>&1
kind create cluster --kubeconfig "${CRANE_KUBECONFIG}" --name "${CRANE_CLUSTER_NAME}" --image kindest/node:v1.21.1
export KUBECONFIG="${CRANE_KUBECONFIG}"
echo "Step1: Create local cluster finished."echo "Step2: Installing Prometheus "
helm repo add ${PROMETHEUS_HELM_NAME} ${PROMETHEUS_HELM_URL}
helm install prometheus -n crane-system --version 19.6.1 \--set prometheus-pushgateway.enabled=false \--set alertmanager.enabled=false \--set server.persistentVolume.enabled=false \-f ${PROMETHEUS_VALUE_URL} \--create-namespace  ${PROMETHEUS_HELM_NAME}/prometheus
echo "Step2: Installing Prometheus finished."echo "Step3: Installing Grafana "helm install grafana \-f ${GRAFANA_VALUE_URL} \-n crane-system \--create-namespace ${GRAFANA_HELM_PACKAGE_URL}echo "Step3: Installing Grafana finished."echo "Step4: Installing Crane "
helm repo add ${CRANE_HELM_NAME} ${CRANE_HELM_URL}
helm repo update
helm install crane -n crane-system --set craneAgent.enable=false --create-namespace ${CRANE_HELM_NAME}/crane
helm install fadvisor -n crane-system --create-namespace ${CRANE_HELM_NAME}/fadvisor
echo "Step4: Installing Crane finished."kubectl get deploy -n crane-system
echo "Please wait for all pods ready"
echo "After all pods ready, Get the Crane Dashboard URL to visit by running these commands in the same shell:"
echo "    export KUBECONFIG=${HOME}/.kube/config_crane"
echo "    kubectl -n crane-system port-forward service/craned 9090:9090"
在命令行中执行以下安装命令
bash installation/local-env-setup.sh
③查看目录
tree -l
④ 安装(第二种方式)
[root@master1 trainning]# bash installation/local-env-setup.sh
Step1: Create local cluster: /root/.kube/config_crane
Deleting cluster "crane" ...
Creating cluster "crane" ...? Ensuring node image (kindest/node:v1.21.1) ?? ? Preparing nodes ?? ? Writing configuration ?? ? Starting control-plane ??????????????????????????????????????????????????????????????????????????????????????????????????????????????????????????????????????????????????????????????????????????????????????????????????????????????????????????????????????????????????????????????????????????????????????????????????????? ? Installing CNI ?? ? Installing StorageClass ??
Set kubectl context to "kind-crane"
You can now use your cluster with:kubectl cluster-info --context kind-crane --kubeconfig /root/.kube/config_craneHave a question, bug, or feature request? Let us know! https://kind.sigs.k8s.io/#community ??
Step1: Create local cluster finished.
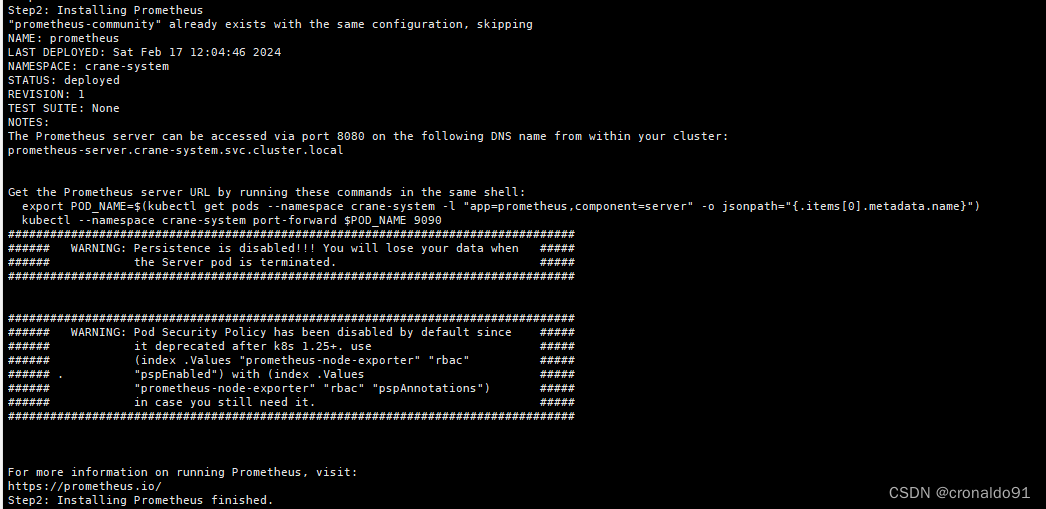
Step2: Installing Prometheus
"prometheus-community" already exists with the same configuration, skipping
NAME: prometheus
LAST DEPLOYED: Sat Feb 17 12:04:46 2024
NAMESPACE: crane-system
STATUS: deployed
REVISION: 1
TEST SUITE: None
NOTES:
The Prometheus server can be accessed via port 8080 on the following DNS name from within your cluster:
prometheus-server.crane-system.svc.cluster.localGet the Prometheus server URL by running these commands in the same shell:export POD_NAME=$(kubectl get pods --namespace crane-system -l "app=prometheus,component=server" -o jsonpath="{.items[0].metadata.name}")kubectl --namespace crane-system port-forward $POD_NAME 9090
#################################################################################
###### WARNING: Persistence is disabled!!! You will lose your data when #####
###### the Server pod is terminated. #####
##################################################################################################################################################################
###### WARNING: Pod Security Policy has been disabled by default since #####
###### it deprecated after k8s 1.25+. use #####
###### (index .Values "prometheus-node-exporter" "rbac" #####
###### . "pspEnabled") with (index .Values #####
###### "prometheus-node-exporter" "rbac" "pspAnnotations") #####
###### in case you still need it. #####
#################################################################################For more information on running Prometheus, visit:
https://prometheus.io/
Step2: Installing Prometheus finished.
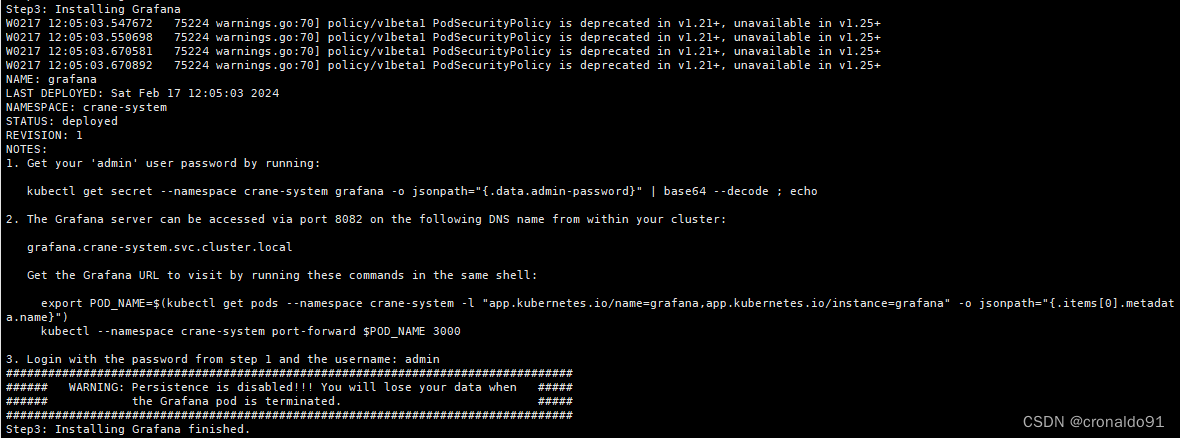
Step3: Installing Grafana
W0217 12:05:03.547672 75224 warnings.go:70] policy/v1beta1 PodSecurityPolicy is deprecated in v1.21+, unavailable in v1.25+
W0217 12:05:03.550698 75224 warnings.go:70] policy/v1beta1 PodSecurityPolicy is deprecated in v1.21+, unavailable in v1.25+
W0217 12:05:03.670581 75224 warnings.go:70] policy/v1beta1 PodSecurityPolicy is deprecated in v1.21+, unavailable in v1.25+
W0217 12:05:03.670892 75224 warnings.go:70] policy/v1beta1 PodSecurityPolicy is deprecated in v1.21+, unavailable in v1.25+
NAME: grafana
LAST DEPLOYED: Sat Feb 17 12:05:03 2024
NAMESPACE: crane-system
STATUS: deployed
REVISION: 1
NOTES:
1. Get your 'admin' user password by running:kubectl get secret --namespace crane-system grafana -o jsonpath="{.data.admin-password}" | base64 --decode ; echo2. The Grafana server can be accessed via port 8082 on the following DNS name from within your cluster:grafana.crane-system.svc.cluster.localGet the Grafana URL to visit by running these commands in the same shell:export POD_NAME=$(kubectl get pods --namespace crane-system -l "app.kubernetes.io/name=grafana,app.kubernetes.io/instance=grafana" -o jsonpath="{.items[0].metadata.name}")kubectl --namespace crane-system port-forward $POD_NAME 30003. Login with the password from step 1 and the username: admin
#################################################################################
###### WARNING: Persistence is disabled!!! You will lose your data when #####
###### the Grafana pod is terminated. #####
#################################################################################
Step3: Installing Grafana finished.
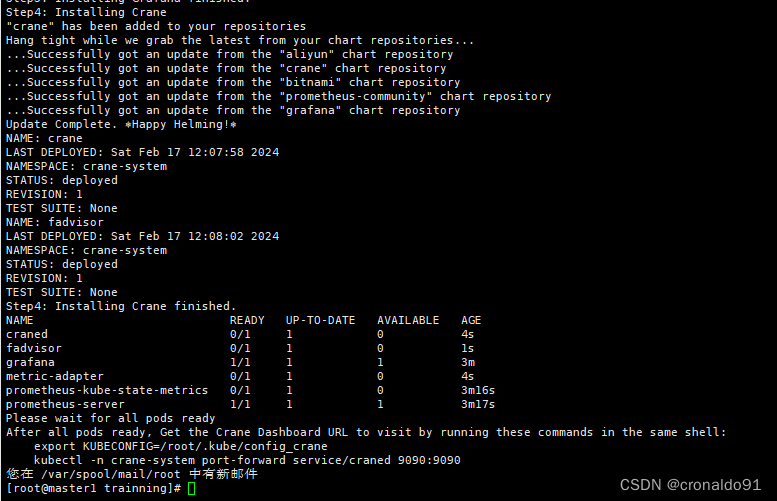
Step4: Installing Crane
"crane" has been added to your repositories
Hang tight while we grab the latest from your chart repositories...
...Successfully got an update from the "aliyun" chart repository
...Successfully got an update from the "crane" chart repository
...Successfully got an update from the "bitnami" chart repository
...Successfully got an update from the "prometheus-community" chart repository
...Successfully got an update from the "grafana" chart repository
Update Complete. ?Happy Helming!?
NAME: crane
LAST DEPLOYED: Sat Feb 17 12:07:58 2024
NAMESPACE: crane-system
STATUS: deployed
REVISION: 1
TEST SUITE: None
NAME: fadvisor
LAST DEPLOYED: Sat Feb 17 12:08:02 2024
NAMESPACE: crane-system
STATUS: deployed
REVISION: 1
TEST SUITE: None
Step4: Installing Crane finished.
NAME READY UP-TO-DATE AVAILABLE AGE
craned 0/1 1 0 4s
fadvisor 0/1 1 0 1s
grafana 1/1 1 1 3m
metric-adapter 0/1 1 0 4s
prometheus-kube-state-metrics 0/1 1 0 3m16s
prometheus-server 1/1 1 1 3m17s
Please wait for all pods ready
After all pods ready, Get the Crane Dashboard URL to visit by running these commands in the same shell:export KUBECONFIG=/root/.kube/config_cranekubectl -n crane-system port-forward service/craned 9090:9090
Step1

Step2
Step3
Step4
(3)设置环境变量
export KUBECONFIG=${HOME}/.kube/config_crane
![]()
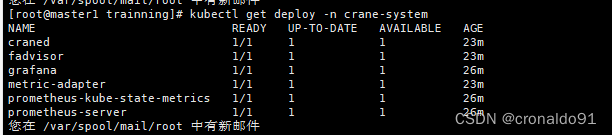
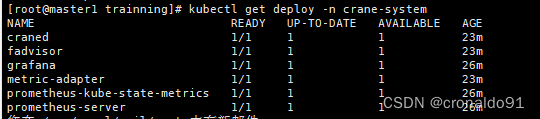
(4)查看deploy
kubectl get deploy -n crane-system
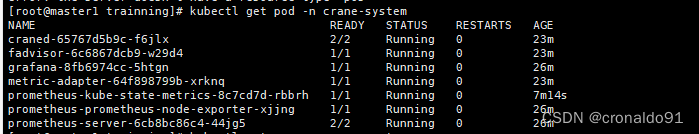
(5)查看pod
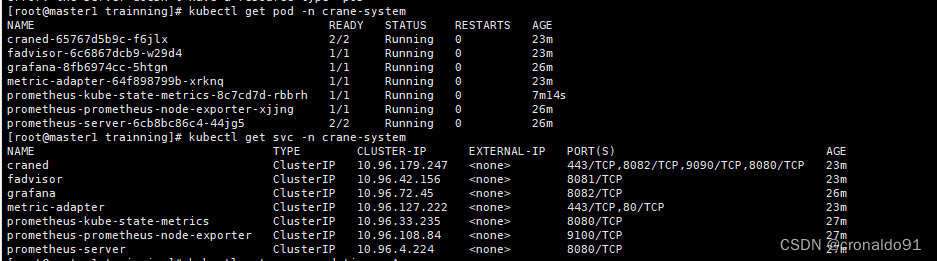
kubectl get pod -n crane-system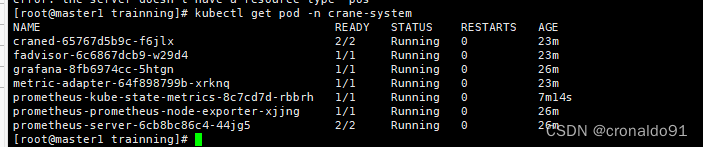
(7)查看svc
kubectl get svc -n crane-system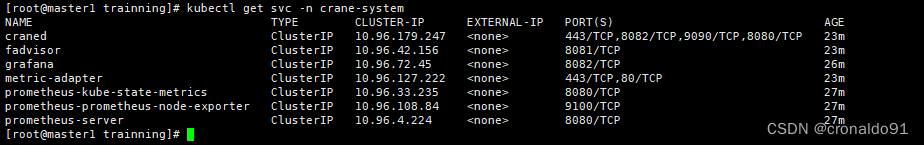
(8) 访问dashboard (端口映射)
增加端口映射后,访问127.0.0.1:9090即可
kubectl -n crane-system port-forward service/craned 9090:9090
![]()
(9)访问dashboard(NodePort)
# Change service type
kubectl patch svc craned -n crane-system -p '{"spec": {"type": "NodePort"}}'
# Get Dashboard link base on your cluster configuration
PORT=$(kubectl get svc -n crane-system craned -o jsonpath='{.spec.ports[?(@.name == "dashboard-service")].nodePort}')
NODE_IP=$(kubectl get node -ojsonpath='{.items[].status.addresses[?(@.type == "InternalIP")].address}')
echo "Dashboard link: http://${NODE_IP}:${PORT}"
二、问题
1.脚本安装prometheus报错
(1)报错
Error: INSTALLATION FAILED: failed to download "prometheus-community/prometheus" at version "19.6.1"

(2)原因分析
helm下载prometheus-community 失败
(3)解决方法
更新 charts 列表
helm repo add prometheus-community https://prometheus-community.github.io/helm-charts
helm repo list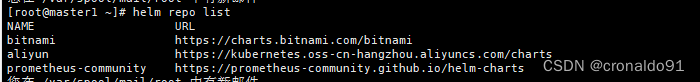
helm repo update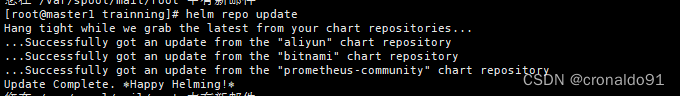
2.查看集群信息失败
(1)报错
Unable to connect to the server: dial tcp 192.168.204.199:16443: connect: no route to host![]()
(2)原因分析
查询网卡信息,发现虚拟ip:192.168.204.199未生效
ip a s ens33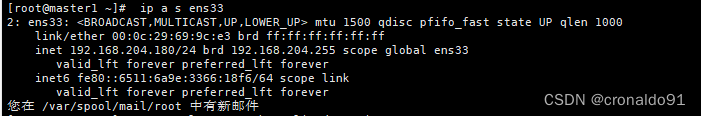
(3)解决方法
重启keepalived
systemctl restart keepalived.service
成功
3.Helm手动添加grafana 报错
(1)报错
Error: context deadline exceeded![]()
(2)原因分析
超时。
(3)解决方法
更新 charts 列表
helm repo add grafana https://grafana.github.io/helm-charts![]()
helm repo list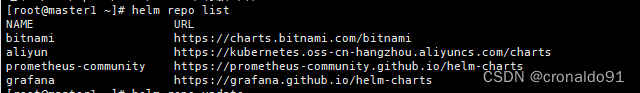
helm repo update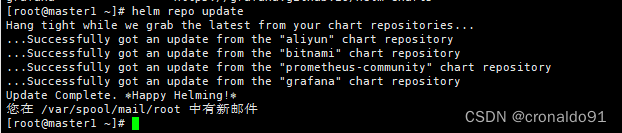
如需手动添加crane
helm repo add crane https://gocrane.github.io/helm-chartshelm repo list
4.查看crane资源失败
(1)报错

(2)原因分析
未申明变量。
(3)解决方法
申明变量
export KUBECONFIG=${HOME}/.kube/config_crane
![]()
成功:
5. prometheus部署时kube-state-metrics 拉取镜像显示ImagePullBackOff
(1)报错
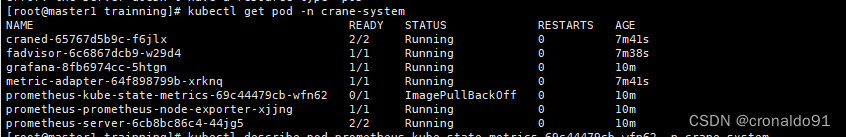
(2)原因分析
[root@master1 trainning]# kubectl describe pod prometheus-kube-state-metrics-69c44479cb-wfn62 -n crane-system
Name:         prometheus-kube-state-metrics-69c44479cb-wfn62
Namespace:    crane-system
Priority:     0
Node:         crane-control-plane/172.18.0.2
Start Time:   Sat, 17 Feb 2024 12:05:04 +0800
Labels:       app.kubernetes.io/component=metricsapp.kubernetes.io/instance=prometheusapp.kubernetes.io/managed-by=Helmapp.kubernetes.io/name=kube-state-metricsapp.kubernetes.io/part-of=kube-state-metricsapp.kubernetes.io/version=2.8.0helm.sh/chart=kube-state-metrics-4.30.0pod-template-hash=69c44479cb
Annotations:  <none>
Status:       Pending
IP:           10.244.0.4
IPs:IP:           10.244.0.4
Controlled By:  ReplicaSet/prometheus-kube-state-metrics-69c44479cb
Containers:kube-state-metrics:Container ID:  Image:         ccr.ccs.tencentyun.com/tkeimages/kube-state-metrics:2.2.4Image ID:      Port:          8080/TCPHost Port:     0/TCPArgs:--port=8080--resources=certificatesigningrequests,configmaps,cronjobs,daemonsets,deployments,endpoints,horizontalpodautoscalers,ingresses,jobs,leases,limitranges,mutatingwebhookconfigurations,namespaces,networkpolicies,nodes,persistentvolumeclaims,persistentvolumes,poddisruptionbudgets,pods,replicasets,replicationcontrollers,resourcequotas,secrets,services,statefulsets,storageclasses,validatingwebhookconfigurations,volumeattachmentsState:          WaitingReason:       ImagePullBackOffReady:          FalseRestart Count:  0Liveness:       http-get http://:8080/healthz delay=5s timeout=5s period=10s #success=1 #failure=3Readiness:      http-get http://:8080/ delay=5s timeout=5s period=10s #success=1 #failure=3Environment:    <none>Mounts:/var/run/secrets/kubernetes.io/serviceaccount from kube-api-access-mnqcw (ro)
Conditions:Type              StatusInitialized       True Ready             False ContainersReady   False PodScheduled      True
Volumes:kube-api-access-mnqcw:Type:                    Projected (a volume that contains injected data from multiple sources)TokenExpirationSeconds:  3607ConfigMapName:           kube-root-ca.crtConfigMapOptional:       <nil>DownwardAPI:             true
QoS Class:                   BestEffort
Node-Selectors:              <none>
Tolerations:                 node.kubernetes.io/not-ready:NoExecute op=Exists for 300snode.kubernetes.io/unreachable:NoExecute op=Exists for 300s
Events:Type     Reason            Age                   From               Message----     ------            ----                  ----               -------Warning  FailedScheduling  12m (x3 over 13m)     default-scheduler  0/1 nodes are available: 1 node(s) had taint {node.kubernetes.io/not-ready: }, that the pod didn't tolerate.Normal   Scheduled         12m                   default-scheduler  Successfully assigned crane-system/prometheus-kube-state-metrics-69c44479cb-wfn62 to crane-control-planeWarning  Failed            12m                   kubelet            Failed to pull image "ccr.ccs.tencentyun.com/tkeimages/kube-state-metrics:2.2.4": rpc error: code = FailedPrecondition desc = failed to pull and unpack image "ccr.ccs.tencentyun.com/tkeimages/kube-state-metrics:2.2.4": failed commit on ref "layer-sha256:be53542da88544c0fa283026dcdfb7abe500f5ec3c52e1d67c2fdbc8a8600953": unexpected commit digest sha256:bf49da642e8b7be842a34571397692cc0a84b174cc3f43b11a7f2f566c73b011, expected sha256:be53542da88544c0fa283026dcdfb7abe500f5ec3c52e1d67c2fdbc8a8600953: failed preconditionWarning  Failed            11m                   kubelet            Failed to pull image "ccr.ccs.tencentyun.com/tkeimages/kube-state-metrics:2.2.4": rpc error: code = FailedPrecondition desc = failed to pull and unpack image "ccr.ccs.tencentyun.com/tkeimages/kube-state-metrics:2.2.4": failed commit on ref "layer-sha256:be53542da88544c0fa283026dcdfb7abe500f5ec3c52e1d67c2fdbc8a8600953": unexpected commit digest sha256:405ad6c7e360ee2ec0d1d209e0a6b0223afeadf27eb2e779414fffcbe6667274, expected sha256:be53542da88544c0fa283026dcdfb7abe500f5ec3c52e1d67c2fdbc8a8600953: failed preconditionWarning  Failed            11m                   kubelet            Failed to pull image "ccr.ccs.tencentyun.com/tkeimages/kube-state-metrics:2.2.4": rpc error: code = FailedPrecondition desc = failed to pull and unpack image "ccr.ccs.tencentyun.com/tkeimages/kube-state-metrics:2.2.4": failed commit on ref "layer-sha256:bd14ac32149bba6a560651d8a6a836bc6dde7781109aeef9b6c693e2b7b96bfa": unexpected commit digest sha256:b4979e55d7058c14cee5e1e44a26215b7243234a88a3dabeda63a17962acfedc, expected sha256:bd14ac32149bba6a560651d8a6a836bc6dde7781109aeef9b6c693e2b7b96bfa: failed preconditionNormal   Pulling           10m (x4 over 12m)     kubelet            Pulling image "ccr.ccs.tencentyun.com/tkeimages/kube-state-metrics:2.2.4"Warning  Failed            10m (x4 over 12m)     kubelet            Error: ErrImagePullWarning  Failed            10m                   kubelet            Failed to pull image "ccr.ccs.tencentyun.com/tkeimages/kube-state-metrics:2.2.4": rpc error: code = FailedPrecondition desc = failed to pull and unpack image "ccr.ccs.tencentyun.com/tkeimages/kube-state-metrics:2.2.4": failed commit on ref "layer-sha256:bd14ac32149bba6a560651d8a6a836bc6dde7781109aeef9b6c693e2b7b96bfa": unexpected commit digest sha256:744e5904c346df90e59a66226736e6f8dac711cb61713852eeaa8e1336b78996, expected sha256:bd14ac32149bba6a560651d8a6a836bc6dde7781109aeef9b6c693e2b7b96bfa: failed preconditionWarning  Failed            10m (x6 over 12m)     kubelet            Error: ImagePullBackOffNormal   BackOff           2m33s (x38 over 12m)  kubelet            Back-off pulling image "ccr.ccs.tencentyun.com/tkeimages/kube-stat
(3)解决方法
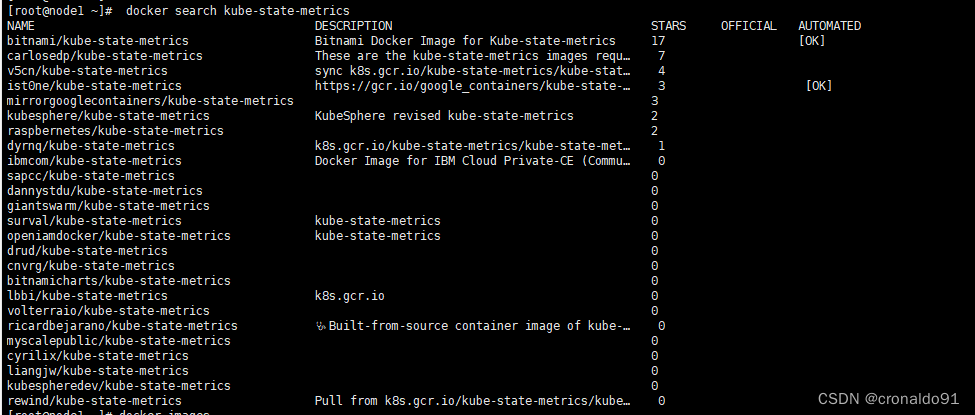
node节点 搜索拉取的镜像信息
docker search kube-state-metrics
 拉取到本地镜像仓库
docker pull bitnami/kube-state-metrics
查看镜像
docker images
master节点查看deploy
kubectl get deploy -n crane-system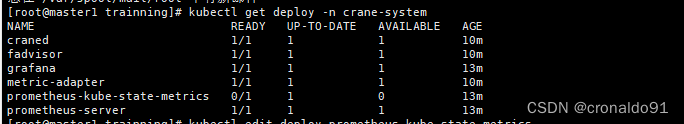
master节点修改deploy
kubectl edit deploy prometheus-kube-state-metrics -n crane-system
修改前:
image: ccr.ccs.tencentyun.com/tkeimages/kube-state-metrics:2.2.4修改后:
image: docker.io/bitnami/kube-state-metrics:latest成功:
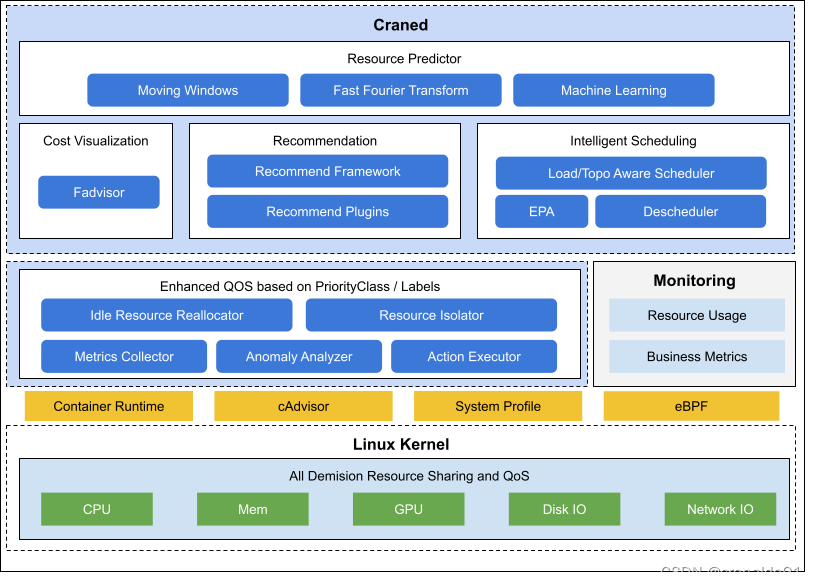
6.Crane 功能与架构
(1)查阅
#官网
https://gocrane.io/#Github
https://github.com/gocrane/crane#中文安装
https://gocrane.io/zh-cn/docs/getting-started/installation/installation/
(2)功能
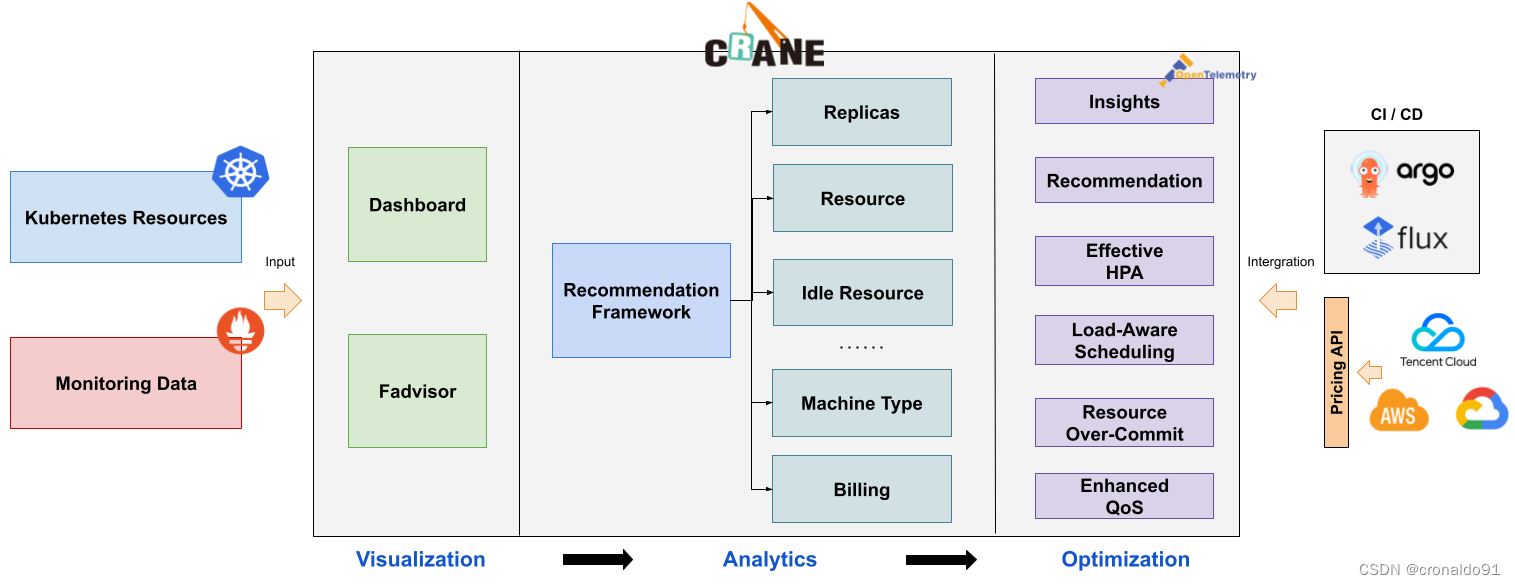
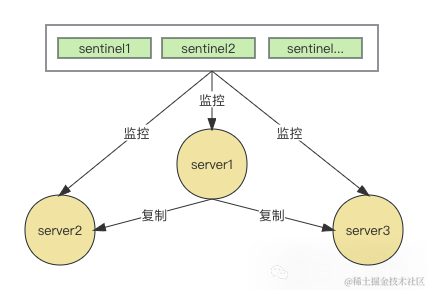
(3)架构
核心组件:
1)Craned
它是 Crane 的最核心组件,它管理了 CRDs 的生命周期以及API。
Craned 通过 Deployment 方式部署且由两个容器组成:
Craned: 运行了 Operators 用来管理 CRDs,向 Dashboard 提供了 WebApi,Predictors 提供了 TimeSeries API
Dashboard: 基于 TDesign‘s Starter 脚手架研发的前端项目,提供了易于上手的产品功能2)Fadvisor
它提供一组 Exporter 计算集群云资源的计费和账单数据并存储到我们的监控系统,比如 Prometheus。
Fadvisor 通过 Cloud Provider 支持了多云计费的 API。3)Metric Adapter
它实现了一个 Custom Metric Apiserver. Metric Adapter 读取 CRDs 信息并提供基于 Custom/External Metric API 的 HPA Metric 的数据。4)Crane Agent
它是一个用于在 Kubernetes 集群中管理 Docker 镜像的工具
通过 DaemonSet 部署在集群的节点上。