这几天写了一个代码很长的聚类分析树状图绘图工具函数(上一期文章立的flag总算实现了),能够比较轻松的绘制以下图形:


工具基本已经成型了,未来有需求未来有空再加哈哈哈,要求MATLAB至少需要17b版本(理论上是17b,实际上可能需要更新的版本),先讲解基本使用方法,工具函数代码放在最后,建议去gitee仓库或者fileexchange下载,因为未来有更新的话比较方便修改。先讲讲基本用法:
STree 使用教程
工具函数名为 STree ,是在 dendrogram 函数的基础上写出来的,因此必须要先下载 Statistics and Machine Learning Toolbox 工具箱后才可以使用:
1-1 基本使用
% 随机生成数据 -- random data
% rng(10)
Data = rand(75,3);% 分类数 -- clust number
N = 5;fig1 = figure('Units', 'normalized', 'Position', [.05,.3,.7,.4], 'Color', 'w');% 创建聚类树状图对象 -- create tree(dendrogram) object
Z = linkage(Data, 'average');
ST = STree(Z, 'MaxClust', N);ST.draw()
set(gca,'XColor','none','YColor','none')

和 dendrogram 函数绘制的树状图长相差不多的树状图就绘制出来啦!当然这样看起来有些单调,大家可以设置以下属性来修饰:
- ClustGap – 分类间隙
- BranchColor – 不同类树枝添加颜色
- BranchHighlight – 树枝高亮
- ClassHighlight – 分类高亮
- ClassLabel – 分类文本信息
就简单的在ST.draw()之前设置就好,比如大概这样:
% ... ... 一堆其他代码
% ... ... 一堆其他代码
% ... ... 一堆其他代码ST.ClustGap = 'on';
ST.draw()
为了更直观,我们续写之前的代码新开一个窗口来绘图:
fig2 = figure('Units', 'normalized', 'Position', [.05,.3,.7,.4], 'Color', 'w');
ST.ax = gca;               % 更换坐标区域        -- change the axes
ST.ClustGap = 'on';        % 每个类之间加入间隙   -- insert gap between each clust
ST.BranchColor = 'on';     % 为不同类树枝添加颜色 -- set the branch's color of each clust
ST.BranchHighlight = 'on'; % 增添树枝高亮         -- add highlight for each clust's branches
ST.ClassHighlight = 'on';  % 分类高亮            -- add class highlight
ST.ClassLabel = 'on';      % 分类文本信息         -- add class-labelST.SampleName = compose('slan%d', 1:size(Data,1));
ST.ClassName = compose('Class-%c', 64 + (1:N));% 调整字体 -- adjust font
ST.SampleFont = {'FontSize', 10, 'FontName', 'Times New Roman'};
ST.ClassFont = {'FontSize', 14, 'FontName', 'Times New Roman', 'FontWeight', 'bold'};
ST.draw()
set(gca,'XColor','none','YColor','none')

还是同一个m文件,再新开一个窗口展示一下如何换颜色:
% change color
fig3 = figure('Units', 'normalized', 'Position', [.05,.3,.7,.4], 'Color', 'w');
ST.ax = gca;% 更换坐标区域  -- change the axes
ST.CData = [0.3569    0.0784    0.07840.6784    0.4471    0.17250.1020    0.3882    0.51760.1725    0.4196    0.43920.2824    0.2275    0.2902];
ST.draw()
set(gca,'XColor','none','YColor','none')

1-2 树枝样式
我们可以通过设置Layout属性设置树枝样式,比如:
% 随机生成数据 -- random data
% rng(10)
Data = rand(75,3);% 分类数 -- clust number
N = 5;fig1 = figure('Units', 'normalized', 'Position', [.05,.3,.7,.4], 'Color', 'w');% 创建聚类树状图对象 -- create tree(dendrogram) object
Z = linkage(Data, 'average');
ST = STree(Z, 'MaxClust', N);ST.Layout = 'bezier';ST.draw()
set(gca,'XColor','none','YColor','none')

树枝就会变成用贝塞尔曲线插值的样式。写段代码展示一下全部可选择样式:
% STree_demo2
% + layout : 'rectangular'(default) / 'rounded' / 'slanted' / 'ellipse' / 'bezier'% 随机生成数据 -- random data
% rng(10)
Data = rand(75,3);% 分类数 -- clust number
N = 5;fig = figure('Units', 'normalized', 'Position', [.05,.1,.7,.8], 'Color', 'w');% 创建聚类树状图对象 -- create tree(dendrogram) object
Z = linkage(Data, 'average');
ST = STree(Z, 'MaxClust', N);% 每个类之间加入间隙 -- insert gap between each clust
ST.ClustGap = 'on';
delete(gca);% 所有类型树枝展示 -- all kinds of branch(layout)
layoutSet = {'rectangular', 'rounded', 'slanted', 'ellipse', 'bezier'};
for i = 1:length(layoutSet)% 创建坐标区域并修改绘图坐标区域 -- create subplots and change the parent of the tree objectax = axes('Parent', fig, 'Position', [1/40, (5-i)/5+1/20, 1-1/20, 1/5-1/15], 'XColor', 'none', 'YColor', 'none');ST.ax = ax; % 改变树枝类型 -- change the layoutST.Layout = layoutSet{i};% 修改绘图范围以便方便添加text信息% -- change the X-limit and the Y-limit to add the following textST.XLim = [0,1];ST.YLim = [0,1];ST.draw();text(0, 1, layoutSet{i}, 'FontName', 'Times New Roman',...'FontSize', 16, 'FontWeight', 'bold','Color', [1,1,1].*.2);
end

1-3 树的朝向
树有四种朝向,通过设置Orientation来完成:
再写段代码把四个朝向展示在一个图里:
% STree_demo3
% + Orientation : 'left' / 'right' / 'top' / 'bottom'% 随机生成数据 -- random data
% rng(10)
Data = rand(75,3);% 分类数 -- clust number
N = 5;fig = figure('Units', 'normalized', 'Position', [.05,.1,.9,.8], 'Color', 'w');% 创建聚类树状图对象 -- create tree(dendrogram) object
Z = linkage(Data, 'average');
ST = STree(Z, 'MaxClust', N);% 每个类之间加入间隙 -- insert gap between each clust
ST.ClustGap = 'on';
delete(gca);% 创建坐标区域并修改绘图坐标区域 -- create subplots and change the parent of the tree object
axR = axes('Parent', fig, 'Position', [1/20, 1/30, 1/4-1/20, 1-1/15], 'XColor', 'none', 'YColor', 'none');
ST.ax = axR;% 改变树枝类型 -- change the layout
ST.Layout = 'bezier';
% 改变方向 -- change the orientation
ST.Orientation = 'right';
ST.draw()%% =========================================================================
axL = axes('Parent', fig, 'Position', [3/4, 1/30, 1/4-1/20, 1-1/15], 'XColor', 'none', 'YColor', 'none');
ST.ax = axL;
ST.Orientation = 'left';
ST.draw()axT = axes('Parent', fig, 'Position', [1/4, 1/10, 2/4, 1/2-1/10-1/40], 'XColor', 'none', 'YColor', 'none');
ST.ax = axT;
ST.Orientation = 'top';
ST.draw()axB = axes('Parent', fig, 'Position', [1/4, 1/2+1/40, 2/4, 1/2-1/10-1/40], 'XColor', 'none', 'YColor', 'none');
ST.ax = axB;
ST.Orientation = 'bottom';
ST.draw()

1-4 树的大小范围和旋转
通过设置XLim, YLim, TLim属性来完成,其中TLim是旋转范围,如果两个值相等就是不形变的旋转:
% STree_demo4
% + position
% + rotation% 随机生成数据 -- random data
% rng(10)
Data = rand(75,3);% 分类数 -- clust number
N = 5;% 创建聚类树状图对象 -- create tree(dendrogram) object
Z = linkage(Data, 'average');
ST = STree(Z, 'MaxClust', N);ST.ClustGap = 'on';        % 每个类之间加入间隙   -- insert gap between each clust
ST.BranchColor = 'on';     % 为不同类树枝添加颜色 -- set the branch's color of each clust
ST.BranchHighlight = 'on'; % 增添树枝高亮         -- add highlight for each clust's branches
ST.Label = 'off';          % 关闭样本标签         -- close sample labelST.XLim = [1,3];           % 改变X坐标范围 -- change X-limit
ST.YLim = [1,2];           % 改变Y坐标范围 -- change Y-limit
ST.TLim = [pi/6,pi/6];     % 围绕0点旋转pi/6(当TLim 两个数值相等时,围绕(0,0)点做不形变的旋转)% Rotate pi/6 around point 0 (when TLim has two equal values, rotate around point (0,0) without deformation)close allfig1 = figure('Units', 'normalized', 'Position', [.05,.1,.5,.7], 'Color', 'w');
ST.ax = gca;
ST.Orientation = 'left';
ST.draw()
% exportgraphics(fig1, '.\gallery\demo4_position_rotation_left.png')%%
fig2 = figure('Units', 'normalized', 'Position', [.05,.1,.5,.7], 'Color', 'w');
ST.ax = gca;
ST.Orientation = 'top';
ST.draw()
% exportgraphics(fig2, '.\gallery\demo4_position_rotation_top.png')


1-5 扇形的树
就是设置TLim属性两个值不相等:展示一下四种朝向的树生成的[pi/6,pi/2]范围的扇形树状图:
% STree_demo5
% + Fan-shaped rotation% 随机生成数据 -- random data
% rng(10)
Data = rand(75,3);% 分类数 -- clust number
N = 5;% 创建聚类树状图对象 -- create tree(dendrogram) object
Z = linkage(Data, 'average');
ST = STree(Z, 'MaxClust', N);ST.ClustGap = 'on';        % 每个类之间加入间隙   -- insert gap between each clust
ST.BranchColor = 'on';     % 为不同类树枝添加颜色 -- set the branch's color of each clust
ST.BranchHighlight = 'on'; % 增添树枝高亮         -- add highlight for each clust's branches
ST.Label = 'off';          % 关闭样本标签         -- close sample label
ST.Layout = 'bezier';      % 改变树枝类型         -- change the layoutST.XLim = [1,3];           % 改变X坐标范围 -- change X-limit
ST.TLim = [pi/6,pi/2];     % 绘制pi/6到pi/2范围的扇形树状图 -- Draw a dendrogram of the range from pi/6 to pi/2
close allOrientationSet = {'left', 'right', 'top', 'bottom'};
for i = 1:4tempFig = figure('Units', 'normalized', 'Position', [.05,.1,.5,.7], 'Color', 'w'); ST.ax = gca;ST.Orientation = OrientationSet{i};ST.draw()set(gca,'XColor','none','YColor','none')% exportgraphics(tempFig, ['.\gallery\demo5_Fan_shaped_rotation_',OrientationSet{i},'.png'])
end


1-6 圆面(left朝向)
展示一下X坐标是否从0开始,以及树枝类型不同导致的差别:
% STree_demo6
% + Larger angle range [1]
% + Different x coordinate ranges% 随机生成数据 -- random data
% rng(10)
Data = rand(75,3);% 分类数 -- clust number
N = 5;% 创建聚类树状图对象 -- create tree(dendrogram) object
Z = linkage(Data, 'average');
ST = STree(Z, 'MaxClust', N);% 改变方向 -- change the orientation
ST.Orientation = 'left';ST.ClustGap = 'on';        % 每个类之间加入间隙   -- insert gap between each clust
ST.BranchColor = 'on';     % 为不同类树枝添加颜色 -- set the branch's color of each clust
ST.BranchHighlight = 'on'; % 增添树枝高亮         -- add highlight for each clust's branches
ST.Label = 'on';           % 关闭样本标签         -- close sample label
ST.Layout = 'bezier';      % 改变树枝类型         -- change the layout
ST.ClassHighlight = 'on';  % 分类高亮            -- add class highlight
ST.ClassLabel = 'on';      % 分类文本信息         -- add class-labelST.TLim = [0,2*pi];
close all
layoutSet = {'rectangular', 'rounded', 'slanted', 'ellipse', 'bezier'};% 调整各个元素半径 -- adjust the radius of each elementa
% 样本文本 类弧形内侧 类弧形外侧 类文本
% Sample text, inner side of class arc, outer side of class arc, class text
ST.RTick = [1+1/40, 1.22, 1.27, 1.35];
ST.XLim = [0,3];
for i = 1:length(layoutSet)tempFig = figure('Units', 'normalized', 'Position', [.05,.1,.5,.7], 'Color', 'w'); ST.ax = gca;ST.Layout = layoutSet{i};ST.draw()set(gca,'XColor','none','YColor','none')% exportgraphics(tempFig, ['.\gallery\demo6_left_full_fan_XLim_0_3_',layoutSet{i},'.png'])
end%% ========================================================================
% 调整各个元素半径 -- adjust the radius of each elementa
% 样本文本 类弧形内侧 类弧形外侧 类文本
% Sample text, inner side of class arc, outer side of class arc, class text
ST.RTick = [1+1/40, 1.26, 1.31, 1.37];
ST.XLim = [1,3];
for i = 1:length(layoutSet)tempFig = figure('Units', 'normalized', 'Position', [.05,.1,.5,.7], 'Color', 'w'); ST.ax = gca;ST.Layout = layoutSet{i};ST.draw()set(gca,'XColor','none','YColor','none')% exportgraphics(tempFig, ['.\gallery\demo6_left_full_fan_XLim_1_3_',layoutSet{i},'.png'])
end
X 0-3范围


X 1-3范围


1-7 圆面(right朝向)
树枝类型不同导致的差别:
% STree_demo7
% + Larger angle range [2]% 随机生成数据 -- random data
% rng(10)
Data = rand(75,3);% 分类数 -- clust number
N = 5;% 创建聚类树状图对象 -- create tree(dendrogram) object
Z = linkage(Data, 'average');
ST = STree(Z, 'MaxClust', N);% 改变方向 -- change the orientation
ST.Orientation = 'right';ST.ClustGap = 'on';        % 每个类之间加入间隙   -- insert gap between each clust
ST.BranchColor = 'on';     % 为不同类树枝添加颜色 -- set the branch's color of each clust
ST.BranchHighlight = 'on'; % 增添树枝高亮         -- add highlight for each clust's branches
ST.Label = 'on';           % 关闭样本标签         -- close sample label
ST.Layout = 'bezier';      % 改变树枝类型         -- change the layout
ST.ClassHighlight = 'on';  % 分类高亮            -- add class highlight
ST.ClassLabel = 'on';      % 分类文本信息         -- add class-labelST.TLim = [0,2*pi];
close all
layoutSet = {'rectangular', 'rounded', 'slanted', 'ellipse', 'bezier'};% 调整各个元素半径 -- adjust the radius of each elementa
% 样本文本 类弧形内侧 类弧形外侧 类文本
% Sample text, inner side of class arc, outer side of class arc, class text
ST.RTick = [1+1/40, 1.4, 1.5, 1.6];
ST.XLim = [2.5,4];
for i = 1:length(layoutSet)tempFig = figure('Units', 'normalized', 'Position', [.05,.1,.5,.7], 'Color', 'w'); ST.ax = gca;ST.Layout = layoutSet{i};ST.draw()set(gca,'XColor','none','YColor','none')% exportgraphics(tempFig, ['.\gallery\demo7_right_full_fan_XLim_0_3_',layoutSet{i},'.png'])
end


SMatrix 使用教程
这个函数是我专门写出来用来配合STree来添加热图用的,给了三个使用实例,基本上能用到的函数都提到了:
2-1 带聚类树状图的热图
% STree_SMatrix_demo1% 随便捏造了点数据 -- made up some data casually
X1 = randn(20,20) + [(linspace(-1,2.5,20)').*ones(1,8),(linspace(.5,-.7,20)').*ones(1,5),(linspace(.9,-.2,20)').*ones(1,7)];
X2 = randn(20,25) + [(linspace(-1,2.5,20)').*ones(1,10),(linspace(.5,-.7,20)').*ones(1,8),(linspace(.9,-.2,20)').*ones(1,7)];
% 求相关系数矩阵 -- get the correlation matrix
Data = corr(X1,X2);
% rowName and colName
rowName = {'FREM2','ALDH9A1','RBL1','AP2A2','HNRNPK','ATP1A1','ARPC3','SMG5','RPS27A',...'RAB8A','SPARC','DDX3X','EEF1D','EEF1B2','RPS11','RPL13','RPL34','GCN1','FGG','CCT3'};
colName = compose('slan%d', 1:25);% 分类配色 -- Color schemes for each clust
CList = [0.1490    0.4039    0.49800.3882    0.3608    0.44710.5373    0.2157    0.30980.7686    0.4353    0.2431];fig1 = figure('Units', 'normalized', 'Position', [.05,.1,.6,.8], 'Color', 'w');% 创建聚类树状图对象 -- create tree(dendrogram) object
% 左侧聚类树状图 -- left Cluster Tree
Z1 = linkage(Data, 'average');
ST1 = STree(Z1, 'MaxClust', 3);
ST1.Orientation = 'left';
ST1.XLim = [-.25,-.05];
ST1.YLim = [0,1.2];
ST1.Label = 'off';
ST1.BranchColor = 'on';
ST1.BranchHighlight = 'on';
ST1.ClassHighlight = 'on';
ST1.RTick = [0,1,1.2,0];
ST1.CData = CList;
ST1.draw()
% 右侧聚类树状图 -- right Cluster Tree
Z2 = linkage(Data.', 'average');
ST2 = STree(Z2, 'MaxClust', 3);
ST2.Orientation = 'top';
ST2.XLim = [0,1];
ST2.YLim = [1.25,1.45];
ST2.Label = 'off';
ST2.BranchColor = 'on';
ST2.BranchHighlight = 'on';
ST2.ClassHighlight = 'on';
ST2.RTick = [0,1,1.2,0];
ST2.CData = CList;
ST2.draw() % -------------------------------------------------------------------------
% 创建热图对象 -- create heatmap object
SM = SMatrix(Data);% 添加分组信息 -- Add grouping information
SM.RowName = rowName;
SM.ColName = colName;
SM.RowOrder = ST1.order;
SM.RowClass = ST1.class;
SM.ColOrder = ST2.order;
SM.ColClass = ST2.class;% 设置文本和字体 -- Set Text and Font
SM.LeftLabel = 'off';
SM.RightLabel = 'on';
SM.BottomLabelFont = {'FontSize', 12, 'FontName', 'Times New Roman'};
SM.RightLabelFont = {'FontSize', 12, 'FontName', 'Times New Roman'};% 设置位置 -- set position
SM.XLim = [0,1];
SM.YLim = [0,1.2];
SM.draw()% 修饰坐标区域 -- Decorate axes
set(gca, 'XColor', 'none', 'YColor', 'none',...'DataAspectRatio', [1,1,1], 'XLim', [-.5,1.3]);
CB = colorbar;
CB.Position(4) = CB.Position(4).*0.75;
CB.Position(4) = CB.Position(4).*0.75;
% exportgraphics(fig1, '.\gallery\STree_SMatrix_demo1_1.png')%% ========================================================================
fig2 = figure('Units', 'normalized', 'Position', [.05,.1,.6,.8], 'Color', 'w');
ST1.ax = gca;
ST2.ax = gca;
SM.ax = gca;% SM.Colormap = slanCM(141, 64);% 每个类之间加入间隙 -- insert gap between each clust
ST1.ClustGap = 'on';
ST2.ClustGap = 'on';
SM.ClustGap = 'on';ST1.draw()
ST2.draw()
SM.draw()% 修饰坐标区域 -- Decorate axes
set(gca, 'XColor', 'none', 'YColor', 'none',...'DataAspectRatio', [1,1,1], 'XLim', [-.5,1.3]);
CB = colorbar;
CB.Position(4) = CB.Position(4).*0.75;
CB.Position(4) = CB.Position(4).*0.75;
% exportgraphics(fig2, '.\gallery\STree_SMatrix_demo1_2.png')


2-2 环形热图
其中提到的slanCM可以去fileexchange官网下载,也可以去文末gitee仓库获取全部文件,该函数的介绍在这:

% STree_SMatrix_demo2% 随便捏造了点数据 -- made up some data casually
rng(5)
X = randn(100,80) + [(linspace(-1,2.5,100)').*ones(1,15),(linspace(.5,-.7,100)').*ones(1,15),...(linspace(.1,-.7,100)').*ones(1,15),(linspace(.9,-.2,100)').*ones(1,15),...(linspace(-.1,.7,100)').*ones(1,10),(linspace(-.9,-.2,100)').*ones(1,10)];
Y = randn(100,8) + [(linspace(-1,2.5,100)').*ones(1,2),(linspace(.5,-.7,100)').*ones(1,3),(linspace(-1,-2.5,100)').*ones(1,3)];
% 求相关系数矩阵 -- get the correlation matrix
Data = corr(X,Y);
% rowName and colName
rowName = compose('slan%d', 1:80);
colName = compose('var%d', 1:8);
% 分类配色 -- Color schemes for each clust
CList = [0.1490    0.4039    0.49800.3882    0.3608    0.44710.5373    0.2157    0.30980.7686    0.4353    0.2431];fig1 = figure('Units', 'normalized', 'Position', [.05,.1,.6,.8], 'Color', 'w');% 创建聚类树状图对象 -- create tree(dendrogram) object
% 内侧聚类树状图 -- inner Cluster Tree
Z1 = linkage(Data, 'average');
ST1 = STree(Z1, 'MaxClust', 4);
ST1.Orientation = 'left';
ST1.XLim = [0,1];
ST1.TLim = [pi/2,2*pi+pi/4];
ST1.Label = 'off';
ST1.BranchColor = 'on';
ST1.CData = CList;
ST1.draw()
% 径向聚类树状图 -- radial Cluster Tree
Z2 = linkage(Data.', 'average');
ST2 = STree(Z2, 'MaxClust', 2);
ST2.Orientation = 'top';
ST2.XLim = [1,2];
ST2.TLim = [pi/4,pi/4];
ST2.YLim = [0,0.3];
ST2.Label = 'off';
ST2.BranchColor = 'on';
ST2.RTick = [0,1,1.2,0];
ST2.CData = CList;
ST2.draw() % -------------------------------------------------------------------------
% 创建热图对象 -- create heatmap object
SM = SMatrix(Data);% 添加分组信息 -- Add grouping information
SM.RowName = rowName;
SM.ColName = colName;
SM.RowOrder = ST1.order;
SM.RowClass = ST1.class;
SM.ColOrder = ST2.order;
SM.ColClass = ST2.class;% 设置文本和字体 -- Set Text and Font
SM.LeftLabel = 'off';
SM.RightLabel = 'on';
SM.BottomLabelFont = {'FontSize', 12, 'FontName', 'Times New Roman'};
SM.RightLabelFont = {'FontSize', 12, 'FontName', 'Times New Roman'};% 设置位置 -- set position
SM.XLim = [1,2];
SM.TLim = [pi/2,2*pi+pi/4];
SM.draw()% 修饰坐标区域 -- Decorate axes
set(gca, 'XColor', 'none', 'YColor', 'none',...'DataAspectRatio', [1,1,1], 'XLim', [-2.2,2.3]);exportgraphics(fig1, '.\gallery\STree_SMatrix_demo2_1.png')%% ========================================================================
fig2 = figure('Units', 'normalized', 'Position', [.05,.1,.6,.8], 'Color', 'w');
ST1.ax = gca;
ST2.ax = gca;
SM.ax = gca;% SM.Colormap = slanCM(141, 64);% 每个类之间加入间隙 -- insert gap between each clust
ST1.ClustGap = 'on';
ST2.ClustGap = 'on';
SM.ClustGap = 'on';% see slanCMdisplay
% and Zhaoxu Liu / slandarer (2024). 200 colormap, MATLAB Central File Exchange.
% https://www.mathworks.com/matlabcentral/fileexchange/120088-200-colormap
SM.Colormap = slanCM(136, 64);ST1.draw()
ST2.draw()
SM.draw()% 修饰坐标区域 -- Decorate axes
set(gca, 'XColor', 'none', 'YColor', 'none',...'DataAspectRatio', [1,1,1], 'XLim', [-2.2,2.3]);exportgraphics(fig2, '.\gallery\STree_SMatrix_demo2_2.png')


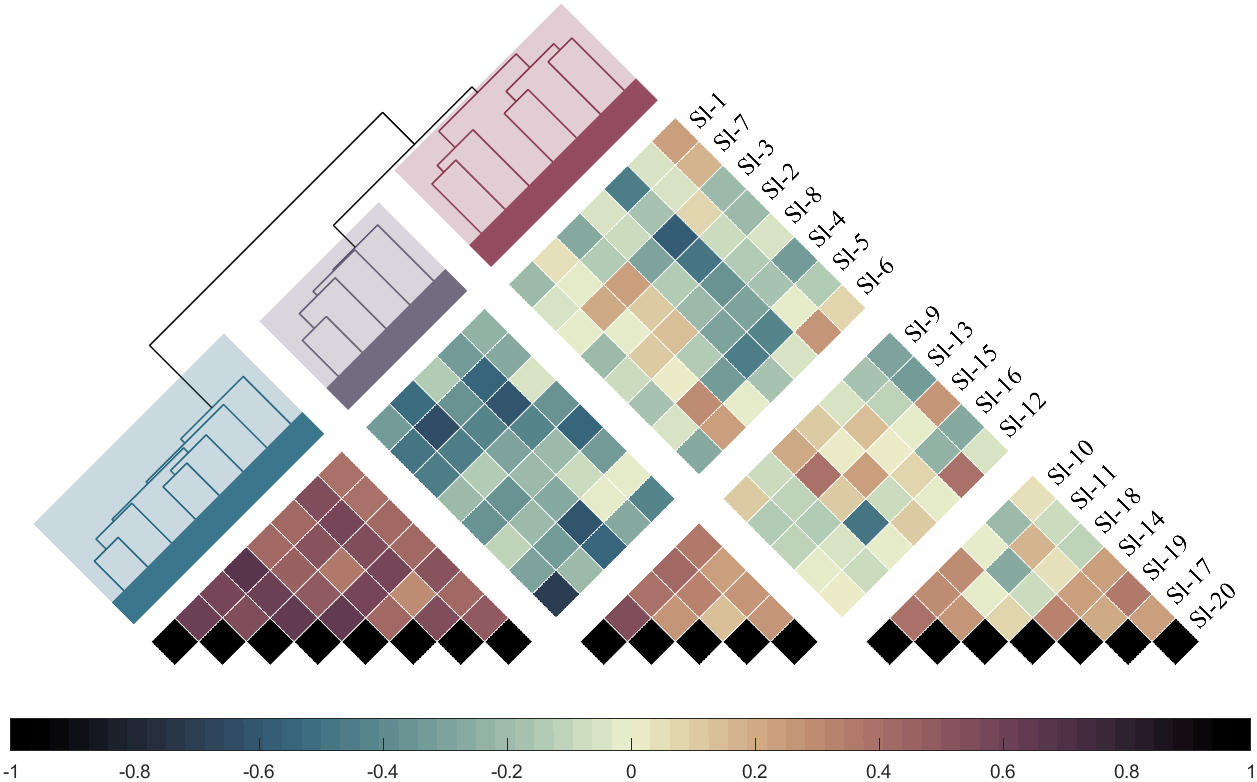
2-3 倾斜45°角热图
STree和SMatrix构造的对象其中会有一些名字以Hdl结尾的属性,实际上都是图形对象,可以直接对线条粗细呀,文字颜色之类的一系列信息进行修改,可自行研究,未来有机会可能会集成进一个set方法中:
% STree_SMatrix_demo3% 随机生成数据
X=randn(20,20)+[(linspace(-1,2.5,20)').*ones(1,8),(linspace(.5,-.7,20)').*ones(1,5),(linspace(.9,-.2,20)').*ones(1,7)];
Data=corr(X);
% 变量名列表
NameList=compose('Sl-%d',1:20);
% 分类配色 -- Color schemes for each clust
CList = [0.1490    0.4039    0.49800.3882    0.3608    0.44710.5373    0.2157    0.30980.7686    0.4353    0.2431];fig1 = figure('Units', 'normalized', 'Position', [.05,.1,.6,.8], 'Color', 'w');% 创建聚类树状图对象 -- create tree(dendrogram) object
% 左侧聚类树状图 -- left Cluster Tree
Z1 = linkage(Data, 'average');
ST1 = STree(Z1, 'MaxClust', 3);
ST1.Orientation = 'left';
ST1.XLim = [-.25,-.05];
ST1.YLim = [0,1];
ST1.TLim = [-pi/4,-pi/4];
ST1.Label = 'off';
ST1.BranchColor = 'on';
ST1.BranchHighlight = 'on';
ST1.ClassHighlight = 'on';
ST1.RTick = [0,1,1.2,0];
ST1.CData = CList;
ST1.draw()% 创建热图对象 -- create heatmap object
SM = SMatrix(Data);% 添加分组信息 -- Add grouping information
SM.ColName = NameList;
SM.RowOrder = ST1.order;
SM.RowClass = ST1.class;
SM.ColOrder = ST1.order;
SM.ColClass = ST1.class;% 设置文本和字体 -- Set Text and Font
SM.LeftLabel = 'off';
SM.BottomLabel = 'off';
SM.TopLabel = 'on';
SM.TopLabelFont = {'FontSize', 12, 'FontName', 'Times New Roman', 'Rotation', 45};% 设置位置 -- set position
SM.XLim = [0,1];
SM.YLim = [0,1];
SM.TLim = [-pi/4,-pi/4];
SM.draw()% 修饰句柄 -- decorate handles
% 清除热图下半部分 -- Clear the bottom half of the heatmap
tData = triu(ones(size(Data)),1);
tInd = find(tData(:) == 1);
for i = 1:length(tInd)set(SM.heatmapHdl{tInd(i)}, 'Visible', 'off')
end% 修饰坐标区域 -- decorate axes
set(gca, 'XColor', 'none', 'YColor', 'none',...'DataAspectRatio', [1,1,1],'XLim', [-.15,1.45]);
CB = colorbar();
CB.Location = 'southoutside';exportgraphics(fig1, '.\gallery\STree_SMatrix_demo3_1.png')%% ========================================================================
fig2 = figure('Units', 'normalized', 'Position', [.05,.1,.6,.8], 'Color', 'w');
ST1.ax = gca;
SM.ax = gca;% SM.Colormap = slanCM(141, 64);% 每个类之间加入间隙 -- insert gap between each clust
ST1.ClustGap = 'on';
SM.ClustGap = 'on';% see slanCMdisplay
% and Zhaoxu Liu / slandarer (2024). 200 colormap, MATLAB Central File Exchange.
% https://www.mathworks.com/matlabcentral/fileexchange/120088-200-colormap
SM.Colormap = slanCM(141, 64);ST1.draw()
SM.draw()% 修饰句柄 -- decorate handles
% 清除热图下半部分 -- Clear the bottom half of the heatmap
tData = triu(ones(size(Data)),1);
tInd = find(tData(:) == 1);
for i = 1:length(tInd)set(SM.heatmapHdl{tInd(i)}, 'Visible', 'off')
end% 修饰坐标区域 -- decorate axes
set(gca, 'XColor', 'none', 'YColor', 'none',...'DataAspectRatio', [1,1,1],'XLim', [-.15,1.45]);
CB = colorbar();
CB.Location = 'southoutside';exportgraphics(fig2, '.\gallery\STree_SMatrix_demo3_2.png')

工具函数完整代码
代码都是几百行,编写不易,点个赞叭!!!
3-1 STree 完整代码
classdef STree < handle
% Copyright (c) 2024, Zhaoxu Liu / slandarer
% =========================================================================
% @author : slandarer
% 公众号  : slandarer随笔
% 知乎    : slandarer
% -------------------------------------------------------------------------
% Zhaoxu Liu / slandarer (2024). STree dendrogram
% (https://www.mathworks.com/matlabcentral/fileexchange/160048-stree-dendrogram),
% MATLAB Central File Exchange.propertiesax, Z, T, cutoff, CData, Parent, class, lineClass, hClass, HMaxClust    = 3; Layout      = 'rectangular'; % 'rectangular'(default) / 'rounded' / 'slanted'% 'ellipse' / 'bezier' Orientation = 'top';         % 'top'    -- Top to bottom% 'bottom'	-- Bottom to top% 'left'	-- Left to right% 'right'	-- Right to leftoriXLim, oriYLimXLim, YLim, TLim = [0,0];ClustGap        = 'off';BranchColor     = 'off';BranchHighlight = 'off';Label           = 'on' ;LabelColor      = 'off'; % uncompletedClassHighlight  = 'off';ClassLabel      = 'off';branchHdl   , sampleLabelHdl, classLabelHdlbranchHLTHdl, sampleHLTHdl  , classHLTHdlSampleName  , ClassName     , WTick% 样本文本 类弧形内侧 类弧形外侧 类文本RTick = [1+1/40, 1.22, 1.27, 1.35];SampleFont = {'FontSize', 10, 'FontName', 'Times New Roman'};ClassFont = {'FontSize', 14, 'FontName', 'Times New Roman', 'FontWeight', 'bold'};lineSet, order, oriXSet, oriYSet, oriWSet, oriHSet, newXSet, newYSet, newWSet, newHSetbranchHLTXSet, sampleHLTXSet, classHLTXSetbranchHLTYSet, sampleHLTYSet, classHLTYSetbranchHLTWSet, sampleHLTWSet, classHLTWSetbranchHLTHSet, sampleHLTHSet, classHLTHSetarginList  = {'Parent', 'Layout', 'CData', 'XLim', 'YLim', 'TLim',...'SampleName', 'ClassName', 'Orientation', 'MaxClust', 'RTick',...'SampleFont', 'ClassFont', 'ClustGap', 'BranchColor', 'BranchHighlight',...'Label', 'LabelColor', 'ClassHighlight', 'ClassLabel'};end
% 构造函数 =================================================================methodsfunction obj = STree(varargin)% 获取基本数据 -------------------------------------------------if isa(varargin{1}, 'matlab.graphics.axis.Axes')obj.ax = varargin{1}; varargin(1) = [];else  endobj.Z = varargin{1}; varargin(1) = [];% 获取其他信息 -------------------------------------------------for i = 1:2:(length(varargin)-1)tid = ismember(obj.arginList, varargin{i});if any(tid)obj.(obj.arginList{tid}) = varargin{i+1};endendif isempty(obj.ax) && (~isempty(obj.Parent)), obj.ax=obj.Parent; endif isempty(obj.ax), obj.ax=gca; end% 基础配色 -----------------------------------------------------if isempty(obj.CData)colorList = [204    61    36243   197    88109   174   14448   180   2040    79   122]./255;N = size(colorList, 1);colorList = colorList(mod((1:obj.MaxClust)-1, N)+1,:);colorList = colorList.*(.9.^(floor(((1:obj.MaxClust)-1)./N).'));obj.CData = colorList;end% 基础命名 -----------------------------------------------------if isempty(obj.SampleName)obj.SampleName = compose('slan%d', 1:(size(obj.Z,1)+10));obj.ClassName = compose('Class-%c', 64 + (1:obj.MaxClust));endend
% Copyright (c) 2024, Zhaoxu Liu / slandarer
% =========================================================================
% @author : slandarer
% 公众号  : slandarer随笔
% 知乎    : slandarer
% -------------------------------------------------------------------------
% Zhaoxu Liu / slandarer (2024). STree dendrogram
% (https://www.mathworks.com/matlabcentral/fileexchange/160048-stree-dendrogram),
% MATLAB Central File Exchange.function draw(obj)obj.ax.NextPlot = 'add';% 各类数据准备 =================================================% 数据处理、绘制树状图、提取图形、关闭图窗 ------------------------tempFigure = figure();N = obj.MaxClust;obj.T = cluster(obj.Z, 'maxclust', N);obj.cutoff = median([obj.Z(end-(N-1),3), obj.Z(end-(N-2),3)]);[obj.lineSet, ~, obj.order] = dendrogram(obj.Z, 0, 'Orientation', obj.Orientation);obj.oriXSet = reshape([obj.lineSet(:).XData], 4, []).';obj.oriYSet = reshape([obj.lineSet(:).YData], 4, []).';if strcmpi(obj.Orientation, 'top') || strcmpi(obj.Orientation, 'bottom') obj.oriWSet = obj.oriXSet; obj.oriHSet = obj.oriYSet;elseobj.oriWSet = obj.oriYSet; obj.oriHSet = obj.oriXSet;endobj.class = obj.T(obj.order);close(tempFigure)% 计算高亮高度 -------------------------------------------------WSet = [obj.oriWSet(:,1:2); obj.oriWSet(:,3:4)];HSet = [obj.oriHSet(:,1:2); obj.oriHSet(:,3:4)];BSet = (HSet(:,1)-obj.cutoff).*(HSet(:,2)-obj.cutoff)<0;obj.H = (HSet(BSet,1)+HSet(BSet,2))./2;obj.hClass = obj.class(round(WSet(BSet,1)));% 预生成树枝配色 -----------------------------------------------obj.lineClass = all(obj.oriHSet < obj.cutoff,2).*obj.class(round((obj.oriWSet(:,2)+obj.oriWSet(:,3))./2));% 生成间隙 -----------------------------------------------------gap = find(diff(obj.class)~=0)+.5;obj.WTick = 1:length(obj.class);if strcmpi(obj.ClustGap, 'on')for i = length(gap):-1:1obj.oriWSet(obj.oriWSet>gap(i)) = obj.oriWSet(obj.oriWSet>gap(i))+1;obj.WTick(obj.WTick>gap(i)) = obj.WTick(obj.WTick>gap(i))+1;endendobj.newWSet = [];obj.newHSet = [];% 修改树枝形状 =================================================switch obj.Layoutcase 'rectangular'for i = 1:size(obj.oriWSet,1)obj.newWSet(i,:) = [linspace(obj.oriWSet(i,1), obj.oriWSet(i,2), 30),...linspace(obj.oriWSet(i,2), obj.oriWSet(i,3), 30),...linspace(obj.oriWSet(i,3), obj.oriWSet(i,4), 30)];obj.newHSet(i,:) = [linspace(obj.oriHSet(i,1), obj.oriHSet(i,2), 30),...linspace(obj.oriHSet(i,2), obj.oriHSet(i,3), 30),...linspace(obj.oriHSet(i,3), obj.oriHSet(i,4), 30)];endcase 'rounded'  tX = [-1.*ones(1,15),...cos(linspace(pi,pi/2,20)).*.3-.7,...linspace(-.7,.7,15),...cos(linspace(pi/2,0,20)).*.3+.7,...1.*ones(1,15)];tY = [linspace(0,.7,15),...sin(linspace(pi,pi/2,20)).*.3+.7,...1.*ones(1,15),...sin(linspace(pi/2,0,20)).*.3+.7,...linspace(.7,0,15)];obj.newWSet = [obj.oriWSet(:,1),...tX.*(obj.oriWSet(:,4)-obj.oriWSet(:,1))./2 + (obj.oriWSet(:,4)+obj.oriWSet(:,1))./2,...obj.oriWSet(:,4)];obj.newHSet = [obj.oriHSet(:,1),...tY.*(obj.oriHSet(:,2)-max(obj.oriHSet(:,[1,4]), [], 2)) + max(obj.oriHSet(:,[1,4]), [], 2),...obj.oriHSet(:,4)];case 'slanted'for i = 1:size(obj.oriWSet,1)tWId = obj.Z(:,1:2) == (i+length(obj.class)); tW1 = [];if all(tWId(:,1) == 0) && all(tWId(:,2) == 0)tW = mean(obj.oriWSet(i,2:3));elseif all(tWId(:,1) == 0)tW1 = obj.oriWSet(tWId(:,2),1);tW2 = obj.oriWSet(tWId(:,2),4);elseif all(tWId(:,2) == 0)tW1 = obj.oriWSet(tWId(:,1),1);tW2 = obj.oriWSet(tWId(:,1),4);endif ~isempty(tW1)if abs(tW1 - mean(obj.oriWSet(i,2:3))) > abs(tW2 - mean(obj.oriWSet(i,2:3)))tW = tW2;elsetW = tW1;endendobj.newWSet(i,:) = [linspace(obj.oriWSet(i,1), tW, 30),...linspace(tW, obj.oriWSet(i,4), 30)];obj.newHSet(i,:) = [linspace(obj.oriHSet(i,1), mean(obj.oriHSet(i,2:3)), 30),...linspace(mean(obj.oriHSet(i,2:3)), obj.oriHSet(i,4), 30)];endcase 'ellipse'tT = linspace(pi,0,30);t01 = linspace(0,1,25);obj.newWSet = [obj.oriWSet(:,1).*ones(1,25),...cos(tT).*(obj.oriWSet(:,4)-obj.oriWSet(:,1))./2 + (obj.oriWSet(:,4)+obj.oriWSet(:,1))./2,...obj.oriWSet(:,4).*ones(1,25)];obj.newHSet = [obj.oriHSet(:,1) + t01.*(max(obj.oriHSet(:,[1,4]), [], 2) - obj.oriHSet(:,1)),...sin(tT).*(obj.oriHSet(:,2)-max(obj.oriHSet(:,[1,4]), [], 2)) + max(obj.oriHSet(:,[1,4]), [], 2),...max(obj.oriHSet(:,[1,4]), [], 2) + t01.*(obj.oriHSet(:,4) - max(obj.oriHSet(:,[1,4]), [], 2))];case 'bezier'obj.newWSet = zeros(size(obj.oriWSet,1), 60);obj.newHSet = zeros(size(obj.oriHSet,1), 60);for i = 1:size(obj.oriHSet,1)pntsL = [obj.oriWSet(i,[1,2]),...mean(obj.oriWSet(i,[2,3]));obj.oriHSet(i,[1,2]),...obj.oriHSet(i,2)].';pntsR = [mean(obj.oriWSet(i,[2,3])),...obj.oriWSet(i,[3,4]); obj.oriHSet(i,[3,3]),...obj.oriHSet(i,4)].';pntsL = bezierCurve(pntsL, 30);pntsR = bezierCurve(pntsR, 30);obj.newWSet(i,:) = [pntsL(:,1).', pntsR(:,1).'];obj.newHSet(i,:) = [pntsL(:,2).', pntsR(:,2).'];endend% 高亮区域计算 -------------------------------------------------classNum = unique(obj.class, 'stable');for i = 1:obj.MaxClusttX = [obj.WTick(find(obj.class == classNum(i), 1, 'first')) - .5,...obj.WTick(find(obj.class == classNum(i), 1, 'last')) + .5];obj.branchHLTWSet(i,:) = [linspace(tX(1), tX(2), 50), tX(2).*ones(1,50),...linspace(tX(2), tX(1), 50), tX(1).*ones(1,50)];obj.branchHLTHSet(i,:) = [obj.H(classNum(i) == obj.hClass).*ones(1,50),...linspace(obj.H(classNum(i) == obj.hClass), 0, 50),...zeros(1,50),...linspace(0, obj.H(classNum(i) == obj.hClass), 50)];obj.classHLTWSet(i,:) = [linspace(tX(1), tX(2), 50), tX(2).*ones(1,50),...linspace(tX(2), tX(1), 50), tX(1).*ones(1,50)];maxH = max(max(obj.oriHSet));minH = min(min(obj.oriHSet));diffH = maxH - minH;obj.classHLTHSet(i,:) = [-diffH.*(obj.RTick(2)-1).*ones(1,50),...linspace(-diffH.*(obj.RTick(2)-1), -diffH.*(obj.RTick(3)-1), 50),...-diffH.*(obj.RTick(3)-1).*ones(1,50),...linspace(-diffH.*(obj.RTick(3)-1), -diffH.*(obj.RTick(2)-1), 50)];end% 数据转换 =====================================================if  strcmpi(obj.Orientation, 'left') maxH = max(max(obj.newHSet));obj.newHSet = maxH - obj.newHSet;obj.branchHLTHSet = maxH - obj.branchHLTHSet;obj.classHLTHSet = maxH - obj.classHLTHSet;elseif strcmpi(obj.Orientation, 'bottom')obj.newHSet =  - obj.newHSet;obj.branchHLTHSet =  - obj.branchHLTHSet;obj.classHLTHSet =  - obj.classHLTHSet;endif strcmpi(obj.Orientation, 'top') || strcmpi(obj.Orientation, 'bottom') obj.newXSet = obj.newWSet; obj.newYSet = obj.newHSet;obj.branchHLTXSet = obj.branchHLTWSet; obj.branchHLTYSet = obj.branchHLTHSet;obj.classHLTXSet = obj.classHLTWSet; obj.classHLTYSet = obj.classHLTHSet;elseobj.newXSet = obj.newHSet; obj.newYSet = obj.newWSet;obj.branchHLTXSet = obj.branchHLTHSet; obj.branchHLTYSet = obj.branchHLTWSet;obj.classHLTXSet = obj.classHLTHSet; obj.classHLTYSet = obj.classHLTWSet;end% 原始X,Y范围获取 ----------------------------------------------if strcmp(obj.ClustGap,'on')gap = 1;elsegap = .5;endif strcmpi(obj.Orientation, 'top') || strcmpi(obj.Orientation, 'bottom') obj.oriXLim = [min(min(obj.newXSet)) - gap, max(max(obj.newXSet)) + gap];obj.oriYLim = [min(min(obj.newYSet)), max(max(obj.newYSet))];elseobj.oriXLim = [min(min(obj.newXSet)), max(max(obj.newXSet))];obj.oriYLim = [min(min(obj.newYSet)) - gap, max(max(obj.newYSet)) + gap];end% X,Y范围调整 --------------------------------------------------if ~isempty(obj.XLim)obj.newXSet = (obj.newXSet - obj.oriXLim(1))./diff(obj.oriXLim).*diff(obj.XLim) + obj.XLim(1);obj.branchHLTXSet = (obj.branchHLTXSet - obj.oriXLim(1))./diff(obj.oriXLim).*diff(obj.XLim) + obj.XLim(1);obj.classHLTXSet = (obj.classHLTXSet - obj.oriXLim(1))./diff(obj.oriXLim).*diff(obj.XLim) + obj.XLim(1);elseobj.XLim = obj.oriXLim;endif ~isempty(obj.YLim)obj.newYSet = (obj.newYSet - obj.oriYLim(1))./diff(obj.oriYLim).*diff(obj.YLim) + obj.YLim(1);obj.branchHLTYSet = (obj.branchHLTYSet - obj.oriYLim(1))./diff(obj.oriYLim).*diff(obj.YLim) + obj.YLim(1);obj.classHLTYSet = (obj.classHLTYSet - obj.oriYLim(1))./diff(obj.oriYLim).*diff(obj.YLim) + obj.YLim(1);elseobj.YLim = obj.oriYLim;end% 旋转 --------------------------------------------------------if abs(obj.TLim(1)-obj.TLim(2)) < epsrotateMat = [cos(obj.TLim(1)), -sin(obj.TLim(1));sin(obj.TLim(1)),  cos(obj.TLim(1))];% 旋转树枝tNewXYSet = rotateMat*[obj.newXSet(:).'; obj.newYSet(:).'];obj.newXSet = reshape(tNewXYSet(1,:), size(obj.newXSet,1), []);obj.newYSet = reshape(tNewXYSet(2,:), size(obj.newYSet,1), []);% 旋转树枝高亮tBranchHLTXYSet = rotateMat*[obj.branchHLTXSet(:).'; obj.branchHLTYSet(:).'];obj.branchHLTXSet = reshape(tBranchHLTXYSet(1,:), size(obj.branchHLTXSet,1), []);obj.branchHLTYSet = reshape(tBranchHLTXYSet(2,:), size(obj.branchHLTYSet,1), []);% 旋转类高亮tClassHLTXYSet = rotateMat*[obj.classHLTXSet(:).'; obj.classHLTYSet(:).'];obj.classHLTXSet = reshape(tClassHLTXYSet(1,:), size(obj.classHLTXSet,1), []);obj.classHLTYSet = reshape(tClassHLTXYSet(2,:), size(obj.classHLTYSet,1), []);else% 旋转树枝tNewTSet = (obj.newYSet - obj.YLim(1))./diff(obj.YLim).*diff(obj.TLim) + obj.TLim(1);tNewRSet = obj.newXSet;obj.newXSet = cos(tNewTSet).*tNewRSet;obj.newYSet = sin(tNewTSet).*tNewRSet;% 旋转树枝高亮tBranchHLTTSet = (obj.branchHLTYSet - obj.YLim(1))./diff(obj.YLim).*diff(obj.TLim) + obj.TLim(1);tBranchHLTRSet = obj.branchHLTXSet;obj.branchHLTXSet = cos(tBranchHLTTSet).*tBranchHLTRSet;obj.branchHLTYSet = sin(tBranchHLTTSet).*tBranchHLTRSet;% 旋转类高亮tClassHLTTSet = (obj.classHLTYSet - obj.YLim(1))./diff(obj.YLim).*diff(obj.TLim) + obj.TLim(1);tClassHLTRSet = obj.classHLTXSet;obj.classHLTXSet = cos(tClassHLTTSet).*tClassHLTRSet;obj.classHLTYSet = sin(tClassHLTTSet).*tClassHLTRSet;endif obj.TLim(1) ~= 0 || obj.TLim(2) ~= 0obj.ax.DataAspectRatio = [1,1,1];end% 图形重绘 =====================================================% 绘制树枝 -----------------------------------------------------colorList = [obj.CData];if strcmpi(obj.BranchColor, 'off')colorList = colorList.*0;endfor i = 1:obj.MaxClustobj.branchHdl{i} = plot(obj.ax, obj.newXSet(classNum(i) == obj.lineClass,:).',...obj.newYSet(classNum(i) == obj.lineClass,:).', 'Color', colorList(i,:), 'LineWidth', .8);endobj.branchHdl{obj.MaxClust+1} = plot(obj.ax, obj.newXSet(0 == obj.lineClass,:).',...obj.newYSet(0 == obj.lineClass,:).', 'Color', [0,0,0], 'LineWidth', .7);% 绘制树枝高亮 -------------------------------------------------for i = 1:obj.MaxClustobj.branchHLTHdl{i}=fill(obj.ax, obj.branchHLTXSet(i,:), obj.branchHLTYSet(i,:), obj.CData(i,:), 'EdgeColor', 'none', 'FaceAlpha', .25);endif strcmpi(obj.BranchHighlight,'off')for i = 1:obj.MaxClustset(obj.branchHLTHdl{i},'Visible','off');endend% 绘制类高亮 ---------------------------------------------------for i = 1:obj.MaxClustobj.classHLTHdl{i}=fill(obj.ax, obj.classHLTXSet(i,:), obj.classHLTYSet(i,:), obj.CData(i,:), 'EdgeColor', 'none', 'FaceAlpha', .9);endif strcmpi(obj.ClassHighlight,'off')for i = 1:obj.MaxClustset(obj.classHLTHdl{i},'Visible','off');endend% 绘制样本标签 -------------------------------------------------if abs(obj.TLim(1)-obj.TLim(2)) < epsrotateMat = [cos(obj.TLim(1)), -sin(obj.TLim(1));sin(obj.TLim(1)),  cos(obj.TLim(1))];switch obj.Orientationcase 'left'tY = (obj.WTick - obj.oriYLim(1))./diff(obj.oriYLim).*diff(obj.YLim) + obj.YLim(1);tX = ones(size(tY)).*abs(diff(obj.XLim)).*(obj.RTick(1)-1) + obj.XLim(2);tXY = rotateMat*[tX;tY];tT = obj.TLim(1)/pi*180;if mod(tT,360)>90 && mod(tT,360)<270for i = 1:length(tX)obj.sampleLabelHdl{i} = text(obj.ax, tXY(1,i), tXY(2,i), obj.SampleName{obj.order(i)},...'FontSize', 12, 'Rotation', tT-180, 'HorizontalAlignment', 'right', obj.SampleFont{:});endelsefor i = 1:length(tX)obj.sampleLabelHdl{i} = text(obj.ax, tXY(1,i), tXY(2,i), obj.SampleName{obj.order(i)},...'FontSize', 12, 'Rotation', tT, obj.SampleFont{:});endendfor i = 1:obj.MaxClusttY = (mean(obj.WTick(obj.class == classNum(i))) - obj.oriYLim(1))./diff(obj.oriYLim).*diff(obj.YLim) + obj.YLim(1);tX = abs(diff(obj.XLim)).*(obj.RTick(4)-1) + obj.XLim(2);tXY = rotateMat*[tX;tY];if mod(tT,360)>180 && mod(tT,360)<360obj.classLabelHdl{i} = text(obj.ax, tXY(1), tXY(2), obj.ClassName{i},...'FontSize', 12, 'Rotation', tT+180-90, 'Color', colorList(i,:), 'HorizontalAlignment', 'center', obj.ClassFont{:});elseobj.classLabelHdl{i} = text(obj.ax, tXY(1), tXY(2), obj.ClassName{i},...'FontSize', 12, 'Rotation', tT-90, 'Color', colorList(i,:), 'HorizontalAlignment', 'center', obj.ClassFont{:});endend% -----------------------------------------------------    case 'right'tY = (obj.WTick - obj.oriYLim(1))./diff(obj.oriYLim).*diff(obj.YLim) + obj.YLim(1);tX = - ones(size(tY)).*abs(diff(obj.XLim)).*(obj.RTick(1)-1) + obj.XLim(1);tXY = rotateMat*[tX;tY];tT = obj.TLim(1)/pi*180;if mod(tT,360)>90 && mod(tT,360)<270for i = 1:length(tX)obj.sampleLabelHdl{i} = text(obj.ax, tXY(1,i), tXY(2,i), obj.SampleName{obj.order(i)},...'FontSize', 12, 'Rotation', tT-180, obj.SampleFont{:});endelsefor i = 1:length(tX)obj.sampleLabelHdl{i} = text(obj.ax, tXY(1,i), tXY(2,i), obj.SampleName{obj.order(i)},...'FontSize', 12, 'Rotation', tT, 'HorizontalAlignment', 'right', obj.SampleFont{:});endendfor i = 1:obj.MaxClusttY = (mean(obj.WTick(obj.class == classNum(i))) - obj.oriYLim(1))./diff(obj.oriYLim).*diff(obj.YLim) + obj.YLim(1);tX = - abs(diff(obj.XLim)).*(obj.RTick(4)-1) + obj.XLim(1);tXY = rotateMat*[tX;tY];if mod(tT,360)>180 && mod(tT,360)<360obj.classLabelHdl{i} = text(obj.ax, tXY(1), tXY(2), obj.ClassName{i},...'FontSize', 12, 'Rotation', tT+180-90, 'Color', colorList(i,:), 'HorizontalAlignment', 'center', obj.ClassFont{:});elseobj.classLabelHdl{i} = text(obj.ax, tXY(1), tXY(2), obj.ClassName{i},...'FontSize', 12, 'Rotation', tT-90, 'Color', colorList(i,:), 'HorizontalAlignment', 'center', obj.ClassFont{:});endend% -----------------------------------------------------case 'top'tX = (obj.WTick - obj.oriXLim(1))./diff(obj.oriXLim).*diff(obj.XLim) + obj.XLim(1);tY = - ones(size(tX)).*abs(diff(obj.YLim)).*(obj.RTick(1)-1) + obj.YLim(1);tXY = rotateMat*[tX;tY];tT = obj.TLim(1)/pi*180;if mod(tT,360)>180 && mod(tT,360)<360for i = 1:length(tX)obj.sampleLabelHdl{i} = text(obj.ax, tXY(1,i), tXY(2,i), obj.SampleName{obj.order(i)},...'FontSize', 12, 'Rotation', tT-90-180, 'HorizontalAlignment', 'right',obj.SampleFont{:});endelsefor i = 1:length(tX)obj.sampleLabelHdl{i} = text(obj.ax, tXY(1,i), tXY(2,i), obj.SampleName{obj.order(i)},...'FontSize', 12, 'Rotation', tT-90, obj.SampleFont{:});endendfor i = 1:obj.MaxClusttX = (mean(obj.WTick(obj.class == classNum(i))) - obj.oriXLim(1))./diff(obj.oriXLim).*diff(obj.XLim) + obj.XLim(1);tY = - abs(diff(obj.YLim)).*(obj.RTick(4)-1) + obj.YLim(1);tXY = rotateMat*[tX;tY];if mod(tT,360)>90 && mod(tT,360)<270obj.classLabelHdl{i} = text(obj.ax, tXY(1), tXY(2), obj.ClassName{i},...'FontSize', 12, 'Rotation', tT+180, 'Color', colorList(i,:), 'HorizontalAlignment', 'center', obj.ClassFont{:});elseobj.classLabelHdl{i} = text(obj.ax, tXY(1), tXY(2), obj.ClassName{i},...'FontSize', 12, 'Rotation', tT, 'Color', colorList(i,:), 'HorizontalAlignment', 'center', obj.ClassFont{:});endend% -----------------------------------------------------case 'bottom'tX = (obj.WTick - obj.oriXLim(1))./diff(obj.oriXLim).*diff(obj.XLim) + obj.XLim(1);tY = ones(size(tX)).*abs(diff(obj.YLim)).*(obj.RTick(1)-1) + obj.YLim(2);tXY = rotateMat*[tX;tY];tT = obj.TLim(2)/pi*180;if mod(tT,360)>180 && mod(tT,360)<360for i = 1:length(tX)obj.sampleLabelHdl{i} = text(obj.ax, tXY(1,i), tXY(2,i), obj.SampleName{obj.order(i)},...'FontSize', 12, 'Rotation', tT-90-180, obj.SampleFont{:});endelsefor i = 1:length(tX)obj.sampleLabelHdl{i} = text(obj.ax, tXY(1,i), tXY(2,i), obj.SampleName{obj.order(i)},...'FontSize', 12, 'Rotation', tT-90, 'HorizontalAlignment', 'right', obj.SampleFont{:});endendfor i = 1:obj.MaxClusttX = (mean(obj.WTick(obj.class == classNum(i))) - obj.oriXLim(1))./diff(obj.oriXLim).*diff(obj.XLim) + obj.XLim(1);tY = abs(diff(obj.YLim)).*(obj.RTick(4)-1) + obj.YLim(2);tXY = rotateMat*[tX;tY];if mod(tT,360)>90 && mod(tT,360)<270obj.classLabelHdl{i} = text(obj.ax, tXY(1), tXY(2), obj.ClassName{i},...'FontSize', 12, 'Rotation', tT+180, 'Color', colorList(i,:), 'HorizontalAlignment', 'center', obj.ClassFont{:});elseobj.classLabelHdl{i} = text(obj.ax, tXY(1), tXY(2), obj.ClassName{i},...'FontSize', 12, 'Rotation', tT, 'Color', colorList(i,:), 'HorizontalAlignment', 'center', obj.ClassFont{:});endendend% =============================================================elserotateMat1 = [cos(obj.TLim(1)), -sin(obj.TLim(1));sin(obj.TLim(1)),  cos(obj.TLim(1))];rotateMat2 = [cos(obj.TLim(2)), -sin(obj.TLim(2));sin(obj.TLim(2)),  cos(obj.TLim(2))];tT3 = obj.TLim(1) - diff(obj.TLim).*(obj.RTick(4)-1);tT4 = obj.TLim(2) + diff(obj.TLim).*(obj.RTick(4)-1);rotateMat3 = [cos(tT3), -sin(tT3);sin(tT3),  cos(tT3)];rotateMat4 = [cos(tT4), -sin(tT4);sin(tT4),  cos(tT4)];tT3 = tT3/pi*180;tT4 = tT4/pi*180;switch obj.Orientationcase 'left'tT = (obj.WTick - obj.oriYLim(1))./diff(obj.oriYLim).*diff(obj.TLim) + obj.TLim(1);tT = tT./pi.*180;tR = ones(size(tT)).*abs(diff(obj.XLim)).*(obj.RTick(1)-1) + obj.XLim(2);for i = 1:length(tT)if mod(tT(i),360)<90 || mod(tT(i),360)>270obj.sampleLabelHdl{i} = text(obj.ax, tR(i).*cos(tT(i)*pi/180), tR(i).*sin(tT(i)*pi/180), obj.SampleName{obj.order(i)},...'FontSize', 12, 'Rotation', tT(i), obj.SampleFont{:});elseobj.sampleLabelHdl{i} = text(obj.ax, tR(i).*cos(tT(i)*pi/180), tR(i).*sin(tT(i)*pi/180), obj.SampleName{obj.order(i)},...'FontSize', 12, 'Rotation', tT(i)+180, 'HorizontalAlignment', 'right', obj.SampleFont{:});endendfor i = 1:obj.MaxClusttT = (mean(obj.WTick(obj.class == classNum(i))) - obj.oriYLim(1))./diff(obj.oriYLim).*diff(obj.TLim) + obj.TLim(1);tT = tT./pi.*180;tR = abs(diff(obj.XLim)).*(obj.RTick(4)-1) + obj.XLim(2);if mod(tT,360)<180obj.classLabelHdl{i} = text(obj.ax, tR.*cos(tT*pi/180), tR.*sin(tT*pi/180), obj.ClassName{i},...'FontSize', 12, 'Rotation', tT-90, 'Color', colorList(i,:), 'HorizontalAlignment', 'center', obj.ClassFont{:});elseobj.classLabelHdl{i} = text(obj.ax, tR.*cos(tT*pi/180), tR.*sin(tT*pi/180), obj.ClassName{i},...'FontSize', 12, 'Rotation', tT+90, 'Color', colorList(i,:), 'HorizontalAlignment', 'center', obj.ClassFont{:});endend% -----------------------------------------------------case 'right'tT = (obj.WTick - obj.oriYLim(1))./diff(obj.oriYLim).*diff(obj.TLim) + obj.TLim(1);tT = tT./pi.*180;tR = - ones(size(tT)).*abs(diff(obj.XLim)).*(obj.RTick(1)-1) + obj.XLim(1);for i = 1:length(tT)if mod(tT(i),360)<90 || mod(tT(i),360)>270obj.sampleLabelHdl{i} = text(obj.ax, tR(i).*cos(tT(i)*pi/180), tR(i).*sin(tT(i)*pi/180), obj.SampleName{obj.order(i)},...'FontSize', 12, 'Rotation', tT(i), 'HorizontalAlignment', 'right', obj.SampleFont{:});elseobj.sampleLabelHdl{i} = text(obj.ax, tR(i).*cos(tT(i)*pi/180), tR(i).*sin(tT(i)*pi/180), obj.SampleName{obj.order(i)},...'FontSize', 12, 'Rotation', tT(i)+180, obj.SampleFont{:});endendfor i = 1:obj.MaxClusttT = (mean(obj.WTick(obj.class == classNum(i))) - obj.oriYLim(1))./diff(obj.oriYLim).*diff(obj.TLim) + obj.TLim(1);tT = tT./pi.*180;tR = - abs(diff(obj.XLim)).*(obj.RTick(4)-1) + obj.XLim(1);if mod(tT,360)<180obj.classLabelHdl{i} = text(obj.ax, tR.*cos(tT*pi/180), tR.*sin(tT*pi/180), obj.ClassName{i},...'FontSize', 12, 'Rotation', tT-90, 'Color', colorList(i,:), 'HorizontalAlignment', 'center', obj.ClassFont{:});elseobj.classLabelHdl{i} = text(obj.ax, tR.*cos(tT*pi/180), tR.*sin(tT*pi/180), obj.ClassName{i},...'FontSize', 12, 'Rotation', tT+90, 'Color', colorList(i,:), 'HorizontalAlignment', 'center', obj.ClassFont{:});endend% -----------------------------------------------------case 'top'tX = (obj.WTick - obj.oriXLim(1))./diff(obj.oriXLim).*diff(obj.XLim) + obj.XLim(1);tY = - ones(size(tX)).*abs(diff(obj.YLim)).*(obj.RTick(1)-1);tXY = rotateMat1*[tX;tY];tT = obj.TLim(1)/pi*180;if mod(tT,360)>180 && mod(tT,360)<360for i = 1:length(tX)obj.sampleLabelHdl{i} = text(obj.ax, tXY(1,i), tXY(2,i), obj.SampleName{obj.order(i)},...'FontSize', 12, 'Rotation', tT-90-180, 'HorizontalAlignment', 'right',obj.SampleFont{:});endelsefor i = 1:length(tX)obj.sampleLabelHdl{i} = text(obj.ax, tXY(1,i), tXY(2,i), obj.SampleName{obj.order(i)},...'FontSize', 12, 'Rotation', tT-90, obj.SampleFont{:});endendfor i = 1:obj.MaxClusttX = (mean(obj.WTick(obj.class == classNum(i))) - obj.oriXLim(1))./diff(obj.oriXLim).*diff(obj.XLim) + obj.XLim(1);tY = 0;tXY = rotateMat3*[tX;tY];if mod(tT3,360)>90 && mod(tT3,360)<270obj.classLabelHdl{i} = text(obj.ax, tXY(1), tXY(2), obj.ClassName{i},...'FontSize', 12, 'Rotation', tT3+180, 'Color', colorList(i,:), 'HorizontalAlignment', 'center', obj.ClassFont{:});elseobj.classLabelHdl{i} = text(obj.ax, tXY(1), tXY(2), obj.ClassName{i},...'FontSize', 12, 'Rotation', tT3, 'Color', colorList(i,:), 'HorizontalAlignment', 'center', obj.ClassFont{:});endend% -----------------------------------------------------case 'bottom'abs(diff(obj.YLim))tX = (obj.WTick - obj.oriXLim(1))./diff(obj.oriXLim).*diff(obj.XLim) + obj.XLim(1);tY = ones(size(tX)).*abs(diff(obj.YLim)).*(obj.RTick(1)-1);tXY = rotateMat2*[tX;tY];tT = obj.TLim(2)/pi*180;if mod(tT,360)>180 && mod(tT,360)<360for i = 1:length(tX)obj.sampleLabelHdl{i} = text(obj.ax, tXY(1,i), tXY(2,i), obj.SampleName{obj.order(i)},...'FontSize', 12, 'Rotation', tT-90-180, obj.SampleFont{:});endelsefor i = 1:length(tX)obj.sampleLabelHdl{i} = text(obj.ax, tXY(1,i), tXY(2,i), obj.SampleName{obj.order(i)},...'FontSize', 12, 'Rotation', tT-90, 'HorizontalAlignment', 'right', obj.SampleFont{:});endendfor i = 1:obj.MaxClusttX = (mean(obj.WTick(obj.class == classNum(i))) - obj.oriXLim(1))./diff(obj.oriXLim).*diff(obj.XLim) + obj.XLim(1);tY = 0;tXY = rotateMat4*[tX;tY];if mod(tT4,360)>90 && mod(tT4,360)<270obj.classLabelHdl{i} = text(obj.ax, tXY(1), tXY(2), obj.ClassName{i},...'FontSize', 12, 'Rotation', tT4+180, 'Color', colorList(i,:), 'HorizontalAlignment', 'center', obj.ClassFont{:});elseobj.classLabelHdl{i} = text(obj.ax, tXY(1), tXY(2), obj.ClassName{i},...'FontSize', 12, 'Rotation', tT4, 'Color', colorList(i,:), 'HorizontalAlignment', 'center', obj.ClassFont{:});endendendendif strcmpi(obj.ClassLabel, 'off')for i = 1:obj.MaxClustset(obj.classLabelHdl{i}, 'Visible', 'off');endendif strcmpi(obj.Label, 'off')for i = 1:length(obj.sampleLabelHdl)set(obj.sampleLabelHdl{i}, 'Visible', 'off')endendaxis tight% 部分功能函数 -------------------------------------------------function pnts=bezierCurve(pnts,N)t=linspace(0,1,N);p=size(pnts,1)-1;coe1=factorial(p)./factorial(0:p)./factorial(p:-1:0);coe2=((t).^((0:p)')).*((1-t).^((p:-1:0)'));pnts=(pnts'*(coe1'.*coe2))';endendend
% Copyright (c) 2024, Zhaoxu Liu / slandarer
% =========================================================================
% @author : slandarer
% 公众号  : slandarer随笔
% 知乎    : slandarer
% -------------------------------------------------------------------------
% Zhaoxu Liu / slandarer (2024). STree dendrogram
% (https://www.mathworks.com/matlabcentral/fileexchange/160048-stree-dendrogram),
% MATLAB Central File Exchange.
end
3-2 SMatrix 完整代码
classdef SMatrix < handle
% Copyright (c) 2024, Zhaoxu Liu / slandarer
% =========================================================================
% @author : slandarer
% 公众号  : slandarer随笔
% 知乎    : slandarer
% -------------------------------------------------------------------------
% Zhaoxu Liu / slandarer (2024). STree dendrogram
% (https://www.mathworks.com/matlabcentral/fileexchange/160048-stree-dendrogram),
% MATLAB Central File Exchange.propertiesax, H, XLim, YLim, TLim = [0,0] oriXLim, oriYLim, XSet, YSet, Colormap, Parent, sIndLeftLabelFont = {'FontSize', 10, 'FontName', 'Times New Roman'}RightLabelFont = {'FontSize', 10, 'FontName', 'Times New Roman'}TopLabelFont = {'FontSize', 10, 'FontName', 'Times New Roman'}BottomLabelFont = {'FontSize', 10, 'FontName', 'Times New Roman'}RowOrder, RowClass, RowNameColOrder, ColClass, ColNameheatmapHdl maxH, ClustGap = 'off';XTick, YTickTopLabel     =  'off'BottomLabel  =  'on' LeftLabel    =  'on' RightLabel   =  'off'topLabelHdl, bottomLabelHdl, leftLabelHdl, rightLabelHdldfColor1=[0.9686    0.9882    0.9412;    0.9454    0.9791    0.9199;    0.9221    0.9700    0.8987;    0.8988    0.9609    0.8774;0.8759    0.9519    0.8560;    0.8557    0.9438    0.8338;    0.8354    0.9357    0.8115;    0.8152    0.9276    0.7892;0.7909    0.9180    0.7685;    0.7545    0.9039    0.7523;    0.7180    0.8897    0.7361;    0.6816    0.8755    0.7199;0.6417    0.8602    0.7155;    0.5962    0.8430    0.7307;    0.5507    0.8258    0.7459;    0.5051    0.8086    0.7610;0.4596    0.7873    0.7762;    0.4140    0.7620    0.7914;    0.3685    0.7367    0.8066;    0.3230    0.7114    0.8218;0.2837    0.6773    0.8142;    0.2483    0.6378    0.7929;    0.2129    0.5984    0.7717;    0.1775    0.5589    0.7504;0.1421    0.5217    0.7314;    0.1066    0.4853    0.7132;    0.0712    0.4488    0.6950;    0.0358    0.4124    0.6768;0.0314    0.3724    0.6364;    0.0314    0.3319    0.5929;    0.0314    0.2915    0.5494;    0.0314    0.2510    0.5059]dfColor2=[0.6196    0.0039    0.2588;    0.6892    0.0811    0.2753;    0.7588    0.1583    0.2917;    0.8283    0.2354    0.3082;0.8706    0.2966    0.2961;    0.9098    0.3561    0.2810;    0.9490    0.4156    0.2658;    0.9660    0.4932    0.2931;0.9774    0.5755    0.3311;    0.9887    0.6577    0.3690;    0.9930    0.7266    0.4176;    0.9943    0.7899    0.4707;0.9956    0.8531    0.5238;    0.9968    0.9020    0.5846;    0.9981    0.9412    0.6503;    0.9994    0.9804    0.7161;0.9842    0.9937    0.7244;    0.9526    0.9810    0.6750;    0.9209    0.9684    0.6257;    0.8721    0.9486    0.6022;0.7975    0.9183    0.6173;    0.7228    0.8879    0.6325;    0.6444    0.8564    0.6435;    0.5571    0.8223    0.6448;0.4698    0.7881    0.6460;    0.3868    0.7461    0.6531;    0.3211    0.6727    0.6835;    0.2553    0.5994    0.7139;0.2016    0.5261    0.7378;    0.2573    0.4540    0.7036;    0.3130    0.3819    0.6694;    0.3686    0.3098    0.6353]arginList = {'Parent', 'Layout', 'Colormap', 'XLim', 'YLim', 'TLim',...'RowName', 'ColName', 'Font', 'Parent',...'RowOrder', 'RowClass', 'RowName', 'ColOrder', 'ColClass', 'ColName',...'TopLabelFont' , 'BottomLabelFont', 'LeftLabelFont', 'RightLabelFont',...'ClustGap'};endmethodsfunction obj = SMatrix(varargin)% 获取基本数据 -------------------------------------------------if isa(varargin{1}, 'matlab.graphics.axis.Axes')obj.ax = varargin{1}; varargin(1) = [];else  endobj.H = varargin{1}; varargin(1) = [];% 获取其他信息 -------------------------------------------------for i = 1:2:(length(varargin)-1)tid = ismember(obj.arginList, varargin{i});if any(tid)obj.(obj.arginList{tid}) = varargin{i+1};endendif isempty(obj.ax) && (~isempty(obj.Parent)), obj.ax=obj.Parent; endif isempty(obj.ax), obj.ax=gca; endobj.maxH=max(max(abs(obj.H)));% 设置配色 ----------------------------------------------------if isempty(obj.Colormap)if any(any(obj.H<0))obj.Colormap=obj.dfColor2;% tX=linspace(0,1,size(obj.Colormap,1));% tXi=linspace(0,1,256);% tR=interp1(tX,obj.Colormap(:,1),tXi);% tG=interp1(tX,obj.Colormap(:,2),tXi);% tB=interp1(tX,obj.Colormap(:,3),tXi);% obj.Colormap=[tR(:),tG(:),tB(:)];elseobj.Colormap=obj.dfColor1(end:-1:1,:);endend% 分类情况 -----------------------------------------------------if isempty(obj.RowClass), obj.RowClass = ones(1, size(obj.H, 1)); endif isempty(obj.ColClass), obj.ColClass = ones(1, size(obj.H, 2)); endif isempty(obj.RowOrder), obj.RowOrder = 1:size(obj.H, 1); endif isempty(obj.ColOrder), obj.ColOrder = 1:size(obj.H, 2); endif isempty(obj.RowName), obj.RowName = compose('row%d', 1:size(obj.H, 1)); endif isempty(obj.ColName), obj.ColName = compose('col%d', 1:size(obj.H, 2)); endendfunction draw(obj)obj.ax.NextPlot = 'add';% 配色设置 -----------------------------------------------------colormap(obj.ax, obj.Colormap)colorbar(obj.ax)if any(any(obj.H < 0))try caxis(obj.ax, obj.maxH.*[-1,1]), catch, endtry clim(obj.ax, obj.maxH.*[-1,1]), catch, endelsetry caxis(obj.ax, obj.maxH.*[0,1]), catch,endtry clim(obj.ax, obj.maxH.*[0,1]), catch,endend% 原始X,Y范围获取 ----------------------------------------------gapRow = find(diff(obj.RowClass)~=0)+.5;gapCol = find(diff(obj.ColClass)~=0)+.5;obj.XSet = 1:size(obj.H, 2);obj.YSet = 1:size(obj.H, 1);if strcmpi(obj.ClustGap, 'on')for i = length(gapRow):-1:1obj.YSet(obj.YSet>gapRow(i)) = obj.YSet(obj.YSet>gapRow(i))+1;endfor i = length(gapCol):-1:1obj.XSet(obj.XSet>gapCol(i)) = obj.XSet(obj.XSet>gapCol(i))+1;endendif abs(obj.TLim(1)-obj.TLim(2)) < epsobj.XTick = [obj.XSet(1)-.75, obj.XSet, obj.XSet(end)+.75]; obj.YTick = [obj.YSet(1)-.75, obj.YSet, obj.YSet(end)+.75];elseobj.XTick = [obj.XSet(1)-.75, obj.XSet, obj.XSet(end)+.75];obj.YTick = [obj.YSet(1)-.5, obj.YSet, obj.YSet(end)+.5];endif strcmp(obj.ClustGap,'on')gap = 1;elsegap = .5;endobj.oriXLim = [1 - gap, max(max(obj.XSet)) + gap];obj.oriYLim = [1 - gap, max(max(obj.YSet)) + gap];if isempty(obj.XLim), obj.XLim = obj.oriXLim; endif isempty(obj.YLim), obj.YLim = obj.oriYLim; end% 坐标放缩 -----------------------------------------------------obj.sInd = reshape(1: size(obj.H, 2)*size(obj.H, 1), size(obj.H));baseX = [linspace(-1,1,30), ones(1,30), linspace(1,-1,30), -ones(1,30)].*.5;baseY = [-ones(1,30), linspace(-1,1,30), ones(1,30), linspace(1,-1,30)].*.5;[obj.XSet, obj.YSet] = meshgrid(obj.XSet, obj.YSet);obj.XSet = obj.XSet(:) + baseX;obj.YSet = obj.YSet(:) + baseY;obj.XSet = (obj.XSet - obj.oriXLim(1))./diff(obj.oriXLim).*diff(obj.XLim) + obj.XLim(1);obj.YSet = (obj.YSet - obj.oriYLim(1))./diff(obj.oriYLim).*diff(obj.YLim) + obj.YLim(1);obj.XTick = (obj.XTick - obj.oriXLim(1))./diff(obj.oriXLim).*diff(obj.XLim) + obj.XLim(1);obj.YTick = (obj.YTick - obj.oriYLim(1))./diff(obj.oriYLim).*diff(obj.YLim) + obj.YLim(1);% 坐标旋转 -----------------------------------------------------[XTick_B, YTick_B] = rotate(obj.XTick(2:end-1), obj.YTick(1) + obj.XTick(2:end-1).*0, obj.YLim, obj.TLim);[XTick_T, YTick_T] = rotate(obj.XTick(2:end-1), obj.YTick(end) + obj.XTick(2:end-1).*0, obj.YLim, obj.TLim);[XTick_L, YTick_L] = rotate(obj.XTick(1) + obj.YTick(2:end-1).*0, obj.YTick(2:end-1), obj.YLim, obj.TLim);[XTick_R, YTick_R] = rotate(obj.XTick(end) + obj.YTick(2:end-1).*0, obj.YTick(2:end-1), obj.YLim, obj.TLim);[obj.XSet, obj.YSet] = rotate(obj.XSet, obj.YSet, obj.YLim, obj.TLim);function [X2,Y2] = rotate(X1,Y1,YLim,TLim)if abs(TLim(1)-TLim(2)) < epsrotateMat = [cos(TLim(1)), -sin(TLim(1));sin(TLim(1)),  cos(TLim(1))];tXYSet = rotateMat*[X1(:).'; Y1(:).'];X2 = reshape(tXYSet(1,:), size(X1,1), []);Y2 = reshape(tXYSet(2,:), size(Y1,1), []);elsetTSet = (Y1 - YLim(1))./diff(YLim).*diff(TLim) + TLim(1);tRSet = X1;X2 = cos(tTSet).*tRSet;Y2 = sin(tTSet).*tRSet;endendif obj.TLim(1) ~= 0 || obj.TLim(2) ~= 0obj.ax.DataAspectRatio = [1,1,1];end% 图形绘制 -----------------------------------------------------HH = obj.H(obj.RowOrder, obj.ColOrder);for i = 1:size(obj.XSet,1)obj.heatmapHdl{i} = fill(obj.ax, obj.XSet(i,:), obj.YSet(i,:), HH(i == obj.sInd),'EdgeColor','w','LineWidth',.5);endif abs(obj.TLim(1)-obj.TLim(2)) < epstT = obj.TLim(1)/pi*180;for i = 1:length(XTick_B)if mod(tT,360)>45 && mod(tT,360)<225obj.bottomLabelHdl{i}=text(obj.ax, XTick_B(i), YTick_B(i), [obj.ColName{obj.ColOrder(i)}], 'FontSize', 12,...'Rotation', tT+45+180, 'HorizontalAlignment', 'left', obj.BottomLabelFont{:});elseobj.bottomLabelHdl{i}=text(obj.ax, XTick_B(i), YTick_B(i), [obj.ColName{obj.ColOrder(i)}], 'FontSize', 12,...'Rotation', 45+tT, 'HorizontalAlignment', 'right', obj.BottomLabelFont{:});endendfor i = 1:length(XTick_T)if mod(tT,360)>45 && mod(tT,360)<225obj.topLabelHdl{i}=text(obj.ax, XTick_T(i), YTick_T(i), [obj.ColName{obj.ColOrder(i)}], 'FontSize', 12,...'Rotation', tT+45+180, 'HorizontalAlignment', 'right', obj.TopLabelFont{:});elseobj.topLabelHdl{i}=text(obj.ax, XTick_T(i), YTick_T(i), [obj.ColName{obj.ColOrder(i)}], 'FontSize', 12,...'Rotation', 45+tT, 'HorizontalAlignment', 'left', obj.TopLabelFont{:});endendfor i = 1:length(XTick_L)if mod(tT,360)>90 && mod(tT,360)<270obj.leftLabelHdl{i}=text(obj.ax, XTick_L(i), YTick_L(i), [obj.RowName{obj.RowOrder(i)}], 'FontSize', 12,...'Rotation', tT+180, 'HorizontalAlignment', 'left', obj.LeftLabelFont{:});elseobj.leftLabelHdl{i}=text(obj.ax, XTick_L(i), YTick_L(i), [obj.RowName{obj.RowOrder(i)}], 'FontSize', 12,...'Rotation', tT, 'HorizontalAlignment', 'right', obj.LeftLabelFont{:});endendfor i = 1:length(XTick_R)if mod(tT,360)>90 && mod(tT,360)<270obj.rightLabelHdl{i}=text(obj.ax, XTick_R(i), YTick_R(i), [obj.RowName{obj.RowOrder(i)}], 'FontSize', 12,...'Rotation', tT+180, 'HorizontalAlignment', 'right', obj.RightLabelFont{:});elseobj.rightLabelHdl{i}=text(obj.ax, XTick_R(i), YTick_R(i), [obj.RowName{obj.RowOrder(i)}], 'FontSize', 12,...'Rotation', tT, 'HorizontalAlignment', 'left', obj.RightLabelFont{:});endendelsetT1 = obj.TLim(1)/pi*180;tT2 = obj.TLim(2)/pi*180;for i = 1:length(XTick_B)if mod(tT1,360)>180obj.bottomLabelHdl{i}=text(obj.ax, XTick_B(i), YTick_B(i), [' ',obj.ColName{obj.ColOrder(i)},' '], 'FontSize', 12,...'Rotation', tT1+90, 'HorizontalAlignment', 'right', obj.BottomLabelFont{:});elseobj.bottomLabelHdl{i}=text(obj.ax, XTick_B(i), YTick_B(i), [' ',obj.ColName{obj.ColOrder(i)},' '], 'FontSize', 12,...'Rotation', tT1-90, 'HorizontalAlignment', 'left', obj.BottomLabelFont{:});endendfor i = 1:length(XTick_T)if mod(tT2,360)>180obj.topLabelHdl{i}=text(obj.ax, XTick_T(i), YTick_T(i), [' ',obj.ColName{obj.ColOrder(i)},' '], 'FontSize', 12,...'Rotation', tT2+90, 'HorizontalAlignment', 'left', obj.TopLabelFont{:});elseobj.topLabelHdl{i}=text(obj.ax, XTick_T(i), YTick_T(i), [' ',obj.ColName{obj.ColOrder(i)},' '], 'FontSize', 12,...'Rotation', tT2-90, 'HorizontalAlignment', 'right', obj.TopLabelFont{:});endendtT = (obj.YTick(2:end-1) - obj.YLim(1))./diff(obj.YLim).*diff(obj.TLim) + obj.TLim(1);tT = tT./pi.*180;RR = obj.XTick(end);RL = obj.XTick(1);for i = 1:length(tT)if mod(tT(i),360)<90 || mod(tT(i),360)>270obj.leftLabelHdl{i} = text(obj.ax, RL.*cos(tT(i)*pi/180), RL.*sin(tT(i)*pi/180), [obj.RowName{obj.RowOrder(i)}],...'FontSize', 12, 'Rotation', tT(i), 'HorizontalAlignment', 'right', obj.LeftLabelFont{:});elseobj.leftLabelHdl{i} = text(obj.ax, RL.*cos(tT(i)*pi/180), RL.*sin(tT(i)*pi/180), [obj.RowName{obj.RowOrder(i)}],...'FontSize', 12, 'Rotation', tT(i)+180, obj.LeftLabelFont{:});endendfor i = 1:length(tT)if mod(tT(i),360)<90 || mod(tT(i),360)>270obj.rightLabelHdl{i} = text(obj.ax, RR.*cos(tT(i)*pi/180), RR.*sin(tT(i)*pi/180), [obj.RowName{obj.RowOrder(i)}],...'FontSize', 12, 'Rotation', tT(i), obj.RightLabelFont{:});elseobj.rightLabelHdl{i} = text(obj.ax, RR.*cos(tT(i)*pi/180), RR.*sin(tT(i)*pi/180), [obj.RowName{obj.RowOrder(i)}],...'FontSize', 12, 'Rotation', tT(i)+180, 'HorizontalAlignment', 'right', obj.RightLabelFont{:});endendendif strcmpi(obj.TopLabel,'off'),for i = 1:length(obj.topLabelHdl), set(obj.topLabelHdl{i}, 'Visible', 'off'); end, endif strcmpi(obj.BottomLabel,'off'),for i = 1:length(obj.bottomLabelHdl), set(obj.bottomLabelHdl{i}, 'Visible', 'off'); end, endif strcmpi(obj.LeftLabel,'off'),for i = 1:length(obj.leftLabelHdl), set(obj.leftLabelHdl{i}, 'Visible', 'off'); end, endif strcmpi(obj.RightLabel,'off'),for i = 1:length(obj.rightLabelHdl), set(obj.rightLabelHdl{i}, 'Visible', 'off'); end, endendend
% Copyright (c) 2024, Zhaoxu Liu / slandarer
% =========================================================================
% @author : slandarer
% 公众号  : slandarer随笔
% 知乎    : slandarer
% -------------------------------------------------------------------------
% Zhaoxu Liu / slandarer (2024). STree dendrogram
% (https://www.mathworks.com/matlabcentral/fileexchange/160048-stree-dendrogram),
% MATLAB Central File Exchange.
end
完
未经允许本代码请勿作商业用途,引用的话可以引用我file exchange上的链接,可使用如下格式:
Zhaoxu Liu / slandarer (2024). STree dendrogram (https://www.mathworks.com/matlabcentral/fileexchange/160048-stree-dendrogram), MATLAB Central File Exchange. Retrieved February 23, 2024.
若转载请保留以上file exchange链接及本文链接!!!!!
本文全部代码已同时上传gitee仓库,若懒得一一获取代码和工具,可以去以下gitee仓库获取全部代码:
- https://gitee.com/slandarer/matlab-stree-dendrogram
