文章目录
- 2019' Leveraging Crowdsourced GPS Data for Road Extraction from Aerial Imagery
- 基本介绍
- 对GPS的使用
- 关于怎么证明GPS信息有效
- How to render gps to image
- GPS信息简介
- GPS点状特征
- GPS其他特征挖掘
- 可借鉴的点
- 2020' Convolutional Recurrent Network for Road Boundary Extraction
2019’ Leveraging Crowdsourced GPS Data for Road Extraction from Aerial Imagery
- PDF arxiv
- 代码 Github
- 数据未提供
基本介绍
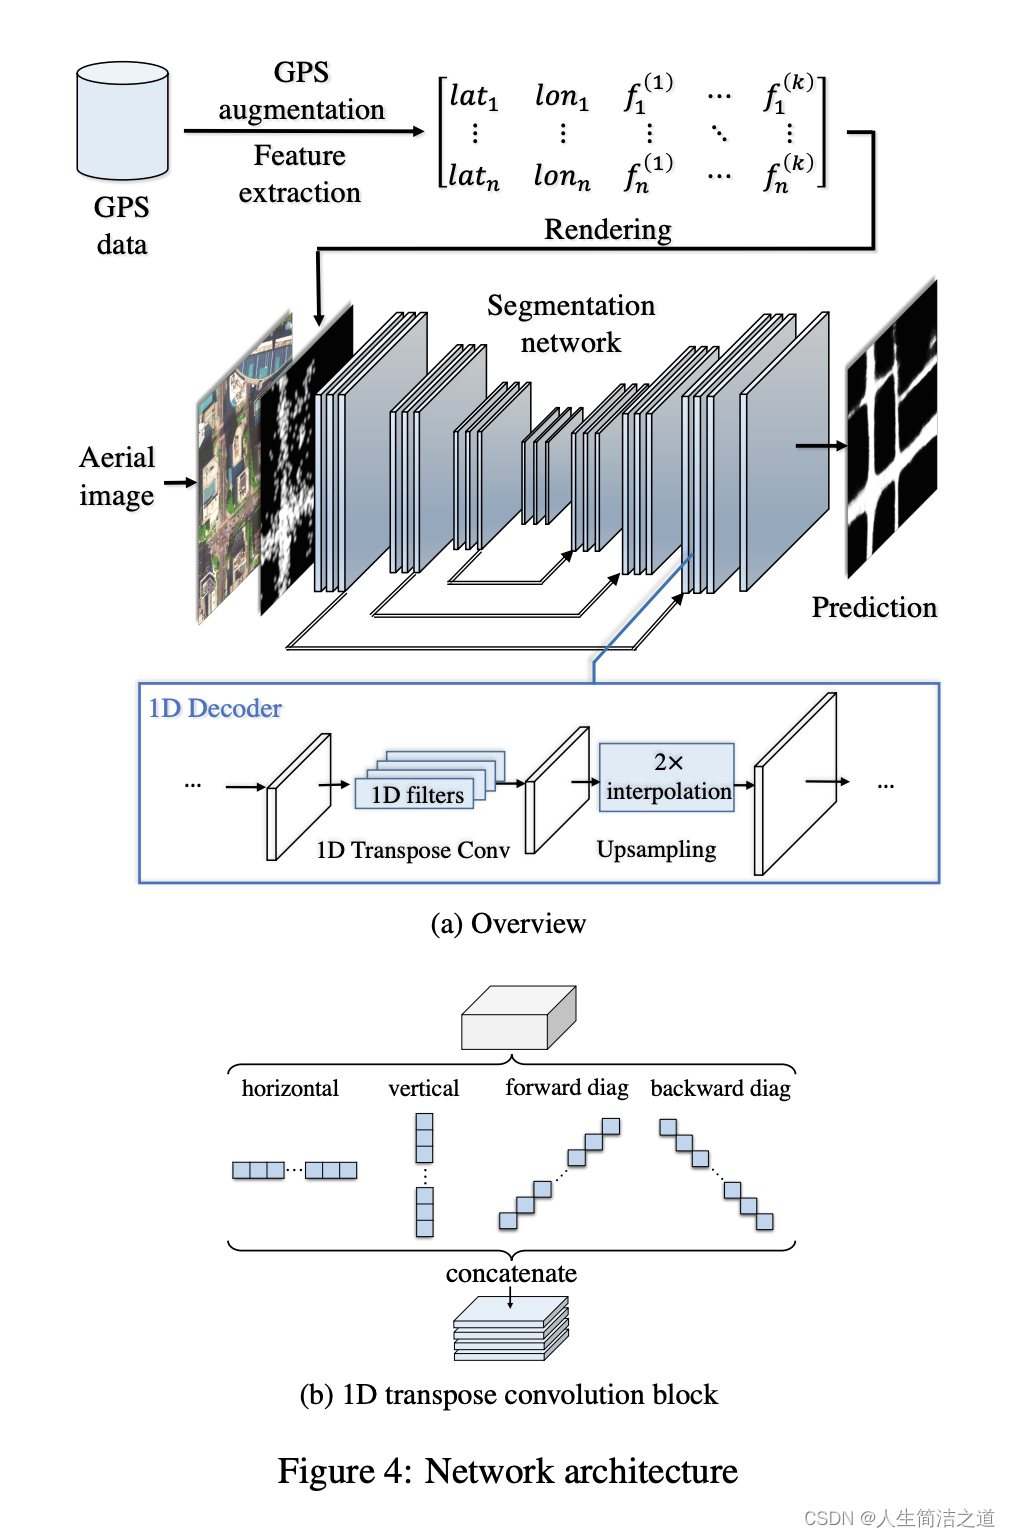
- 网络结构:类UNet左右对称网络,主要设计体现在Decoder阶段上采样模块(文中提到:1D的上采样decoder模块,对于稀疏点的输入会比较鲁棒,Our 1D decoder has similar effect at roads with sparse samples, and they are not affected by sampling intervals.)
class DecoderBlock1DConv4(nn.Module):def __init__(self, in_channels, n_filters):super(DecoderBlock1DConv4, self).__init__()self.conv1 = nn.Conv2d(in_channels, in_channels // 4, 1)self.norm1 = nn.BatchNorm2d(in_channels // 4)self.relu1 = nonlinearityself.deconv1 = nn.ConvTranspose2d(in_channels // 4, in_channels // 8, (1, 9), padding=(0, 4))self.deconv2 = nn.ConvTranspose2d(in_channels // 4, in_channels // 8, (9, 1), padding=(4, 0))self.deconv3 = nn.ConvTranspose2d(in_channels // 4, in_channels // 16, (9, 1), padding=(4, 0))self.deconv4 = nn.ConvTranspose2d(in_channels // 4, in_channels // 16, (1, 9), padding=(0, 4))self.norm2 = nn.BatchNorm2d(in_channels // 4 + in_channels // 8)self.relu2 = nonlinearityself.conv3 = nn.Conv2d(in_channels // 4 + in_channels // 8, n_filters, 1)self.norm3 = nn.BatchNorm2d(n_filters)self.relu3 = nonlinearitydef forward(self, x):x = self.conv1(x)x = self.norm1(x)x = self.relu1(x)x1 = self.deconv1(x) # vertical x2 = self.deconv2(x) # horizonalx3 = self.inv_h_transform(self.deconv3(self.h_transform(x))) # diag x4 = self.inv_v_transform(self.deconv4(self.v_transform(x))) # anti-diagx = torch.cat((x1, x2, x3, x4), 1)x = F.interpolate(x, scale_factor=2)x = self.norm2(x)x = self.relu2(x)x = self.conv3(x)x = self.norm3(x)x = self.relu3(x)return xdef h_transform(self, x):shape = x.size()x = torch.nn.functional.pad(x, (0, shape[-1]))x = x.reshape(shape[0], shape[1], -1)[..., :-shape[-1]]x = x.reshape(shape[0], shape[1], shape[2], 2*shape[3]-1)return xdef inv_h_transform(self, x):shape = x.size()x = x.reshape(shape[0], shape[1], -1).contiguous()x = torch.nn.functional.pad(x, (0, shape[-2]))x = x.reshape(shape[0], shape[1], shape[-2], 2*shape[-2])x = x[..., 0: shape[-2]]return xdef v_transform(self, x):x = x.permute(0, 1, 3, 2)shape = x.size()x = torch.nn.functional.pad(x, (0, shape[-1]))x = x.reshape(shape[0], shape[1], -1)[..., :-shape[-1]]x = x.reshape(shape[0], shape[1], shape[2], 2*shape[3]-1)return x.permute(0, 1, 3, 2)def inv_v_transform(self, x):x = x.permute(0, 1, 3, 2)shape = x.size()x = x.reshape(shape[0], shape[1], -1)x = torch.nn.functional.pad(x, (0, shape[-2]))x = x.reshape(shape[0], shape[1], shape[-2], 2*shape[-2])x = x[..., 0: shape[-2]]return x.permute(0, 1, 3, 2)
- 拼接 GPS点状信息,并拼接 speed 和 timeinterval 两个GPS属性 的最大值和最小值特征 和 RGB 图像进行通道维拼接作为网络输入
- 网络输出为单通道对于路面的二分类分割图
- LOSS设计:逐像素级别的二元交叉熵BCE进行路面和背景的区分,并加上预测路面和GT路面的IoU,即 BCE + IoU , 代码如下:
class dice_bce_loss(nn.Module):def __init__(self, batch=True):super(dice_bce_loss, self).__init__()self.batch = batchself.bce_loss = nn.BCELoss()def soft_dice_coeff(self, y_true, y_pred):smooth = 1.0 # may changeif self.batch:i = torch.sum(y_true)j = torch.sum(y_pred)intersection = torch.sum(y_true * y_pred)else:i = y_true.sum(1).sum(1).sum(1)j = y_pred.sum(1).sum(1).sum(1)intersection = (y_true * y_pred).sum(1).sum(1).sum(1)score = (2. * intersection + smooth) / (i + j + smooth)# score = (intersection + smooth) / (i + j - intersection + smooth)#ioureturn score.mean()def soft_dice_loss(self, y_true, y_pred):loss = 1 - self.soft_dice_coeff(y_true, y_pred)return lossdef __call__(self, y_true, y_pred):a = self.bce_loss(y_pred, y_true)b = self.soft_dice_loss(y_true, y_pred)return a + b
对GPS的使用
关于怎么证明GPS信息有效
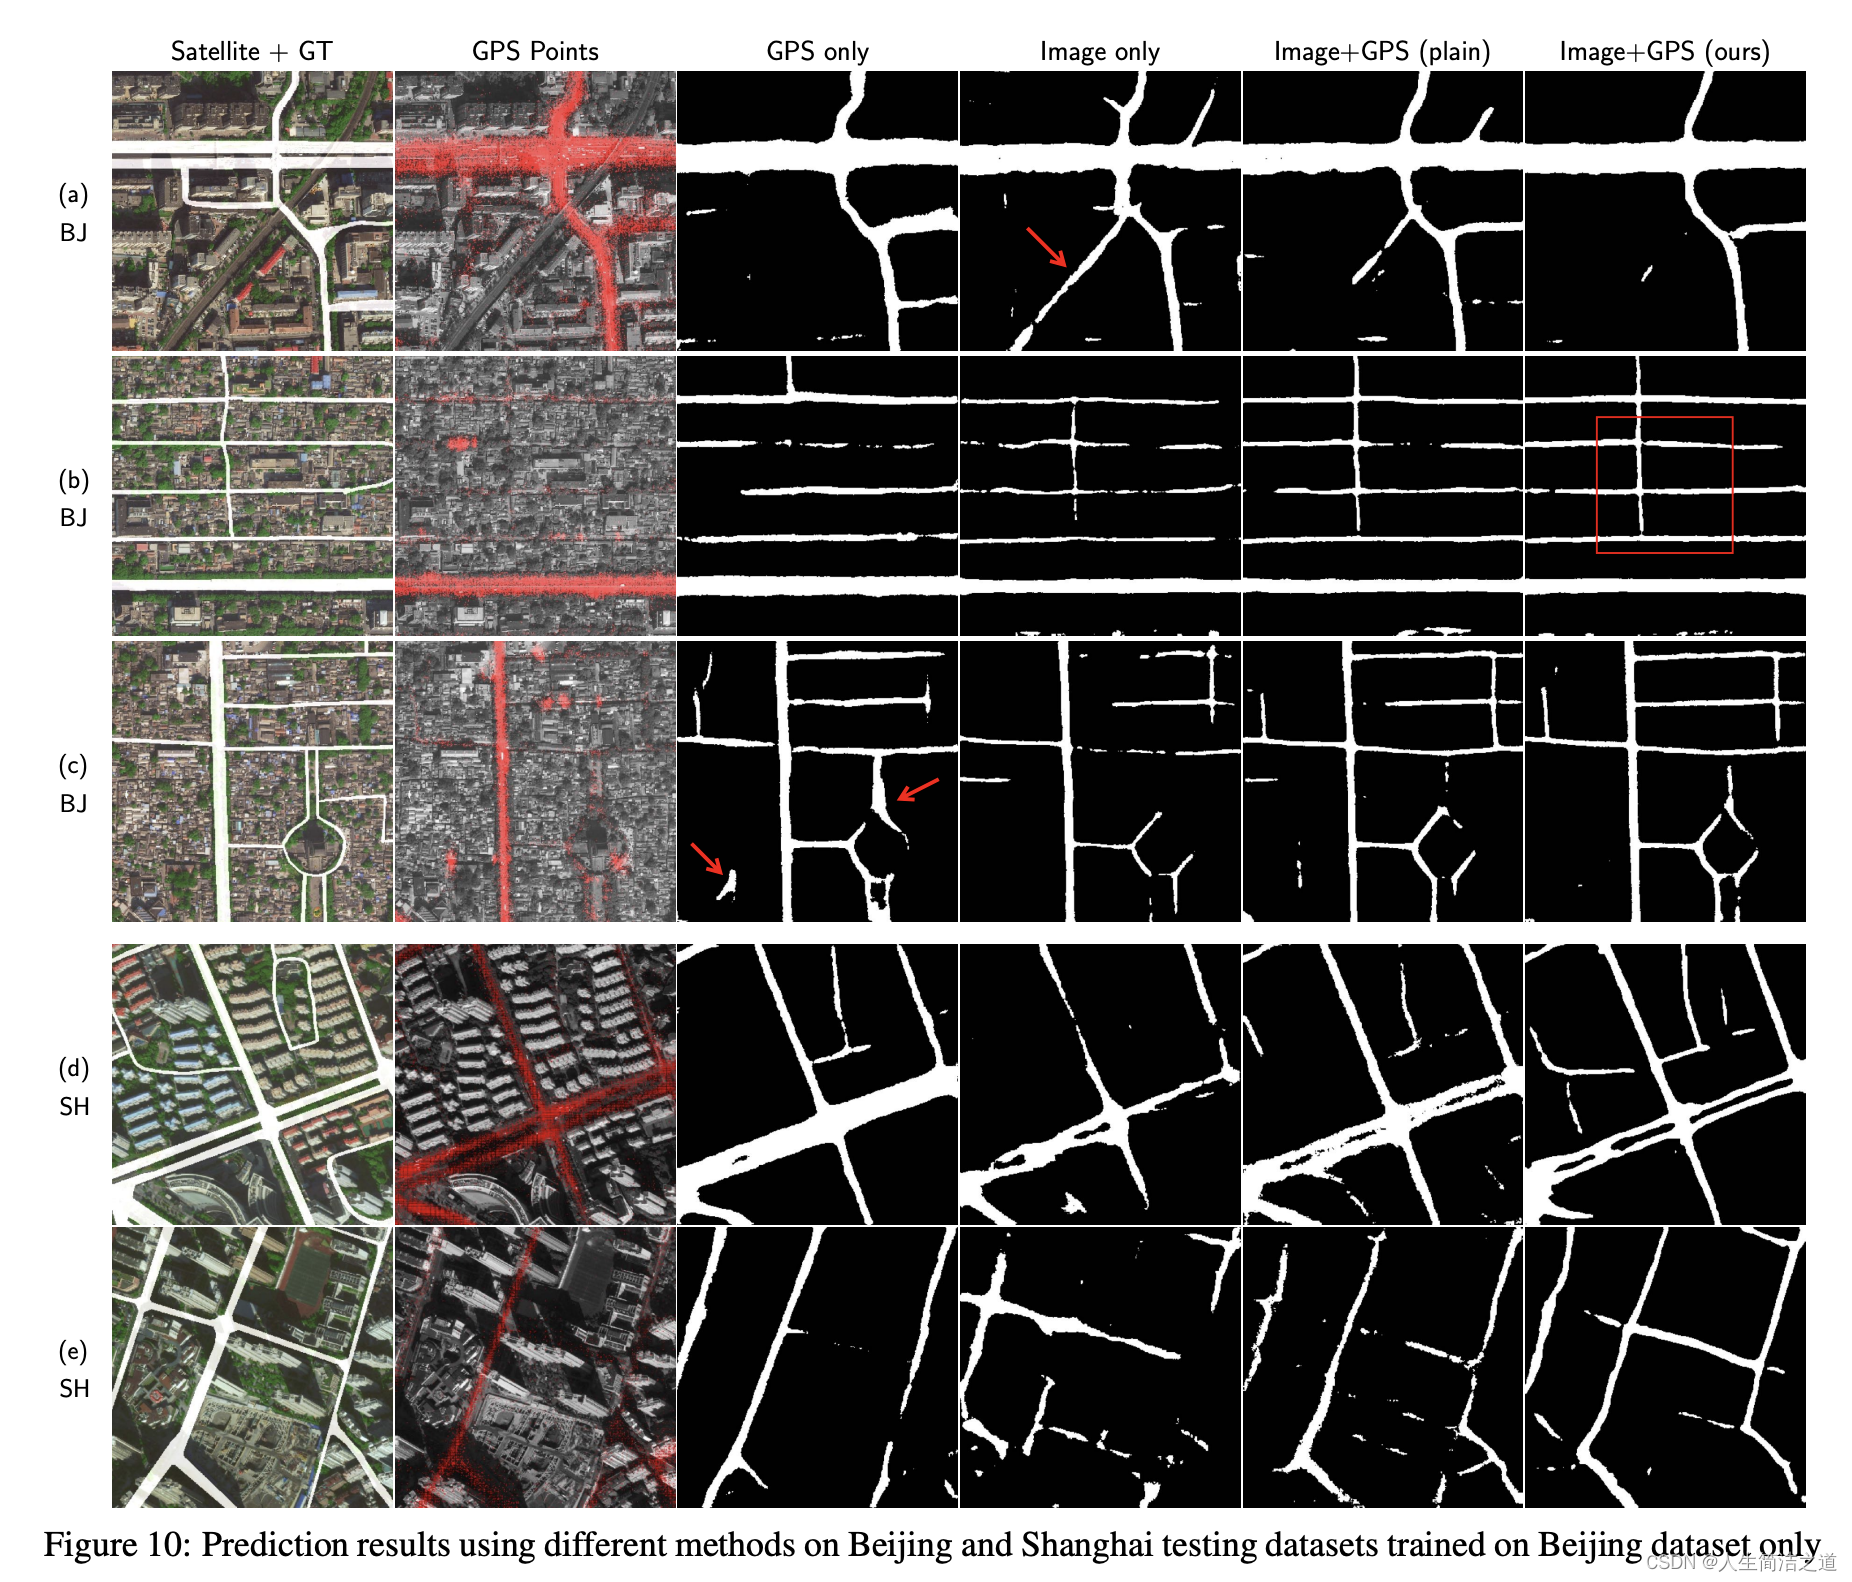
- 实验验证部分,进行了相关结果对比
How to render gps to image
- 即如何充分利用点状GPS信息,得到在二维图像坐标下的GPS特征
- 将GPS信息渲染成图像形式,作为网络的输入
GPS信息简介
- GPS信息的缺点,如下:
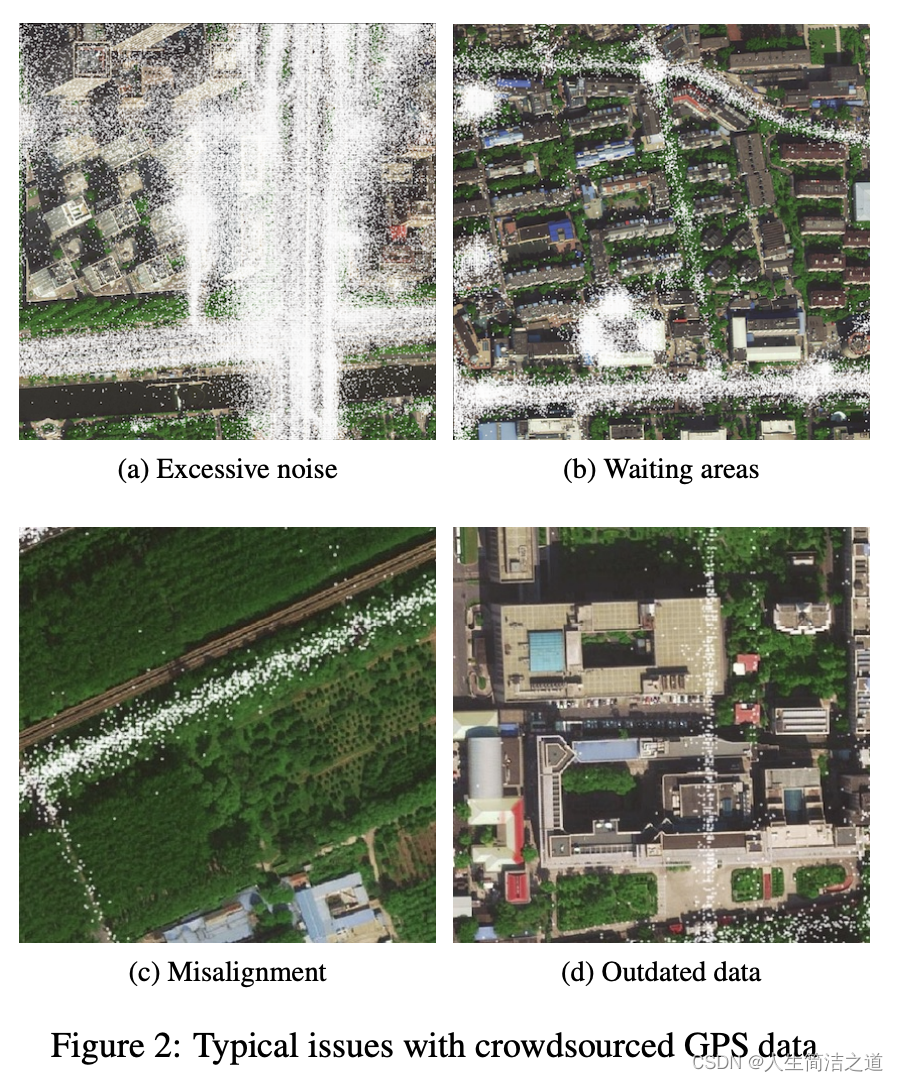
- GPS的点状信息的稠密和采样频率相关,如果只有如果直接在图像上进行点绘制(即二值图),会导致受噪声影响太大,比如上图左上,从而导致真实的道路信息被掩盖;
- GPS点状信息属性:In both cases, each sample includes a timestamp, latitude, longitude, speed, bearing, and taxi status flags. GPS信息的分布遵循高斯分布
GPS点状特征
- 采用密度图思路绘制:基于上小节对GPS点状信息的缺点分析,我们知道二值图绘制GPS点作为输入图是不可以的,本文采用灰度图来替代二值图,类似统计图像像素·对应的GPS点的数量 进行“密度”的统计 ;那么GPS数据点越多,越能得到道路信息(道路处像素点值远远大于周围的非道路区域点的像素)
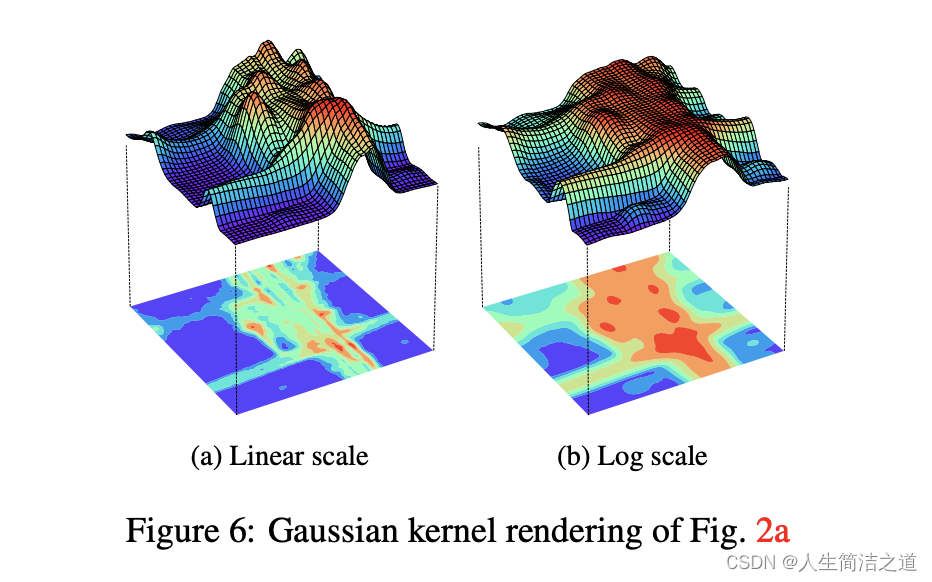
- 采用Kernel Density Estimation (KDE)思路绘制:受核密度估计(KDE)频繁使用的启发 在GPS数据的道路推断[9]中,我们也可以渲染 对GPS数据进行高斯核平滑处理,如下图可视化(Figure 6a is the Gaussian kernel rendering of Fig. 2a. Because of data disparity between highways and residential roads, log scale could make infrequently traveled roads more prominent. For example in Fig. 6b, the horizontal road at the bottom becomes much more visible than in the linear scale.)
1、引入随机信息的GPS 数据增广
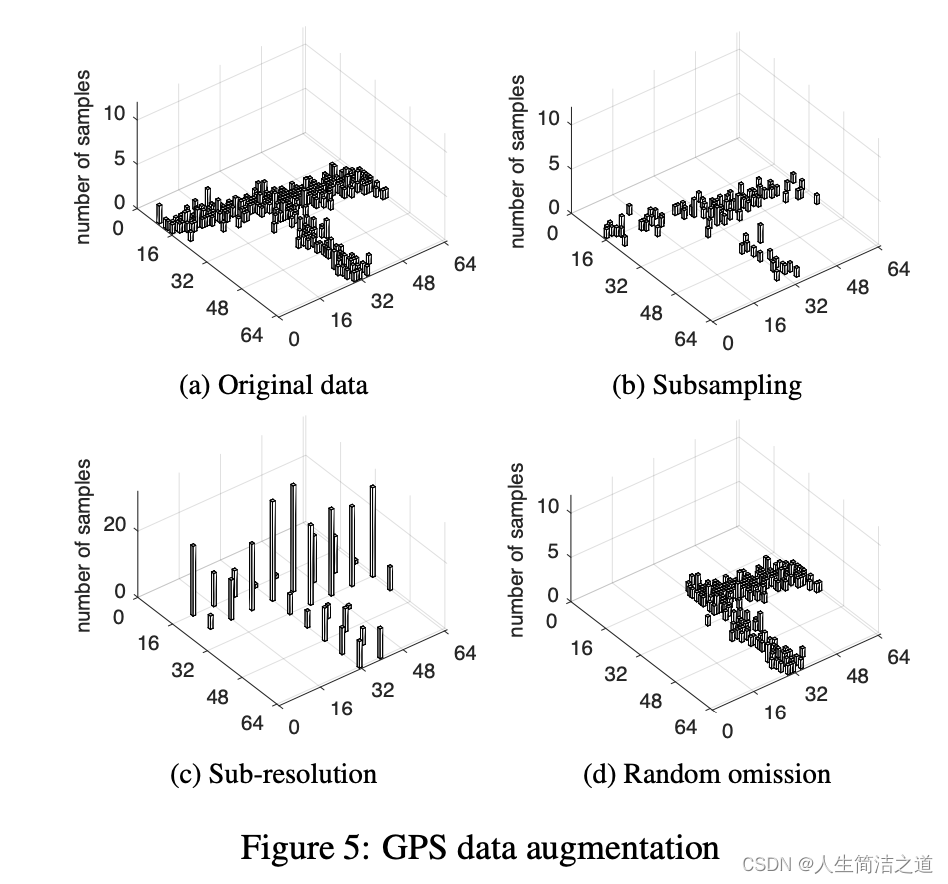
- “sampling”:随机抽样,可以指定采样率(aug_sampling_rate)。
- “precision”:移动GPS坐标的小数位数,可以指定精度率(aug_precision_rate)。
- “perturbation”:数据扰动,随机添加高斯噪声。
- “omission”:数据遗漏,随机删除GPS数据中某一区域内的点。
def _gps_augmentation(self, patchedGPS, aug_mode, length=1024):if "sampling" in aug_mode:if self.aug_sampling_rate is None:sampling_rate = np.random.uniform(0.01, 1.0, None)else:sampling_rate = self.aug_sampling_ratepatchedGPS = patchedGPS.sample(frac=sampling_rate)if "precision" in aug_mode:if self.aug_precision_rate is None:precision_rate = np.random.uniform(0.1, 1.0, None)else:precision_rate = self.aug_precision_ratepatchedGPS['lat'] = np.floor(np.floor(patchedGPS['lat'] * precision_rate) / precision_rate)patchedGPS['lon'] = np.floor(np.floor(patchedGPS['lon'] * precision_rate) / precision_rate)if "perturbation" in aug_mode:num_records = patchedGPS.shape[0]sigma = 10 * np.random.rand()patchedGPS['lat'] += (sigma *np.random.randn(num_records)).astype(np.int)patchedGPS['lon'] += (sigma *np.random.randn(num_records)).astype(np.int)if "omission" in aug_mode:omission_start_x = length * np.random.rand() - length / 2omission_start_y = length * np.random.rand() - length / 2omission_end_x = omission_start_x + length / 2omission_end_y = omission_start_y + length / 2patchedGPS = patchedGPS[~((omission_start_y <= patchedGPS['lat']) & (patchedGPS['lat'] < omission_end_y) &(omission_start_x <= patchedGPS['lon']) & (patchedGPS['lon'] < omission_end_x))]return patchedGPS- 论文中给出的图示
2、点状信息的稠密化
- 该函数是将处理过的GPS数据转换为图像格式的函数。输入为处理过的GPS数据的DataFrame(patchedGPS),和一个图像的尺寸(length,默认为1024)。
- 该函数首先创建一个大小为(length,length,1)的全0矩阵,表示图像像素的灰度值,
- 然后对于patchedGPS中的每一个GPS坐标(经度,纬度),根据转换比例计算其在图像矩阵中的坐标,并将对应像素值设为255(白色)。
- 最后,使用opencv库中的膨胀操作(dilate)扩大所有白色像素点,最终得到一个二值图像。
最后,该函数返回大小为(length,length,1)的GPS数据图像。
def _sparse_to_dense(self, patchedGPS, length=1024):gps = np.zeros((length, length, 1), np.uint8)ratio = length / 1024.patchedGPS = patchedGPS[(0 <= patchedGPS['lat']) & (patchedGPS['lat'] < 1024) &(0 <= patchedGPS['lon']) & (patchedGPS['lon'] < 1024)]y = np.array(patchedGPS['lon'] * ratio, np.int)x = np.array(patchedGPS['lat'] * ratio, np.int)gps[x, y] = 255gps = cv2.dilate(gps, np.ones((3, 3)))gps = gps[..., None]return gps
GPS其他特征挖掘
- 均值特征:统计图像每个像素位置对应的所有经纬度GPS的特征的均值
def _mean_of_feature_value(self, patchedGPS, feature_name, scale_factor, length=1024):feature_map = np.zeros((length, length, 1), np.float)count = np.zeros((length, length, 1), np.float)ratio = length / 1024.y = np.array(patchedGPS['lon'] * ratio, np.int)x = np.array(patchedGPS['lat'] * ratio, np.int)# to make 99% speed values in [0..255]value = np.array(np.clip(patchedGPS[feature_name] * scale_factor, 0, 255), np.float)def additon(x, y, value):if 0 <= x < length and 0 <= y < length:feature_map[x, y] += valuecount[x, y] += 1average_vfunc = np.vectorize(additon)average_vfunc(x, y, value)feature_map = np.divide(feature_map, count,out=np.zeros_like(feature_map), where=(count!=0))# np.nan_to_num(feature_map / count)return feature_map.astype(np.uint8)
- 最值特征:和上面类似,不过不取均值,而是取最大值
def _max_of_feature_value(self, patchedGPS, feature_name, scale_factor, length=1024):feature_map = np.zeros((length, length), np.float)ratio = length / 1024.y = np.array(patchedGPS['lon'] * ratio, np.int)x = np.array(patchedGPS['lat'] * ratio, np.int)# to make 99% speed values in [0..255]value = np.array(np.clip(patchedGPS[feature_name] * scale_factor, 0, 255), np.float)def maximize(x, y, value):if 0 <= x < length and 0 <= y < length:feature_map[x, y] = max(value, feature_map[x, y])max_vfunc = np.vectorize(maximize)max_vfunc(x, y, value)return feature_map[..., None].astype(np.uint8)
- 角度特征:统计每个图像像素对应的GPS点的角度cos和sin值
def _aggregate_heading(self, patchedGPS, length=1024):feature_map = np.zeros((length, length, 2))ratio = length / 1024.patchedGPS = patchedGPS[(patchedGPS['dir']<= 360) & (patchedGPS['dir'] > 0)]def degree_to_rad(arr):return np.pi * arr / 180def aevrage(x, y, sin_value, cos_value):if 0 <= x < length and 0 <= y < length:if feature_map[x, y].any():feature_map[x, y] = (feature_map[x, y] + np.array([sin_value, cos_value])) / 2else:feature_map[x, y] = [sin_value, cos_value]aevrage_vfunc = np.vectorize(aevrage)y = np.array(patchedGPS['lon'] * ratio, np.int)x = np.array(patchedGPS['lat'] * ratio, np.int)value = degree_to_rad(np.array(patchedGPS['dir']))sin_value = np.sin(value) * 127cos_value = np.cos(value) * 127aevrage_vfunc(x, y, sin_value, cos_value)feature_map += 128return feature_map.astype(np.uint8)
- 本文除了点状特征,还增加了几个特征,包括:speed的均值和最大值特征,timeinterval的均值和最大值特征,角度的2通道特征,总共6个特征 (the pixel values of the interval, speed, and bearing layers are the average sampling interval, average speed, and average sinusoid of the bearing for all the samples projected to the pixel, respectively.)
可借鉴的点
- gps的点状信息先进行四种数据增广,再进行稠密化(密度图+高斯平滑+log+截断在0~255+膨胀操作) 、有一些其他操作比如在较为稀疏的点之间加上线段连接,但是这种操作在稀疏场景下会缩短曲线的长度,也和真实的道路情况不同,所以不建议
- 基于数据增广的gps点状信息,再提取速度,角度,和timeinterval(这个不知道是啥)相关特征,一起concat和rgb一起输入网络,GPS特征挖掘
- 网络Decoder的设计
DecoderBlock1DConv4以及基于路面的 loss 设计bce + iou
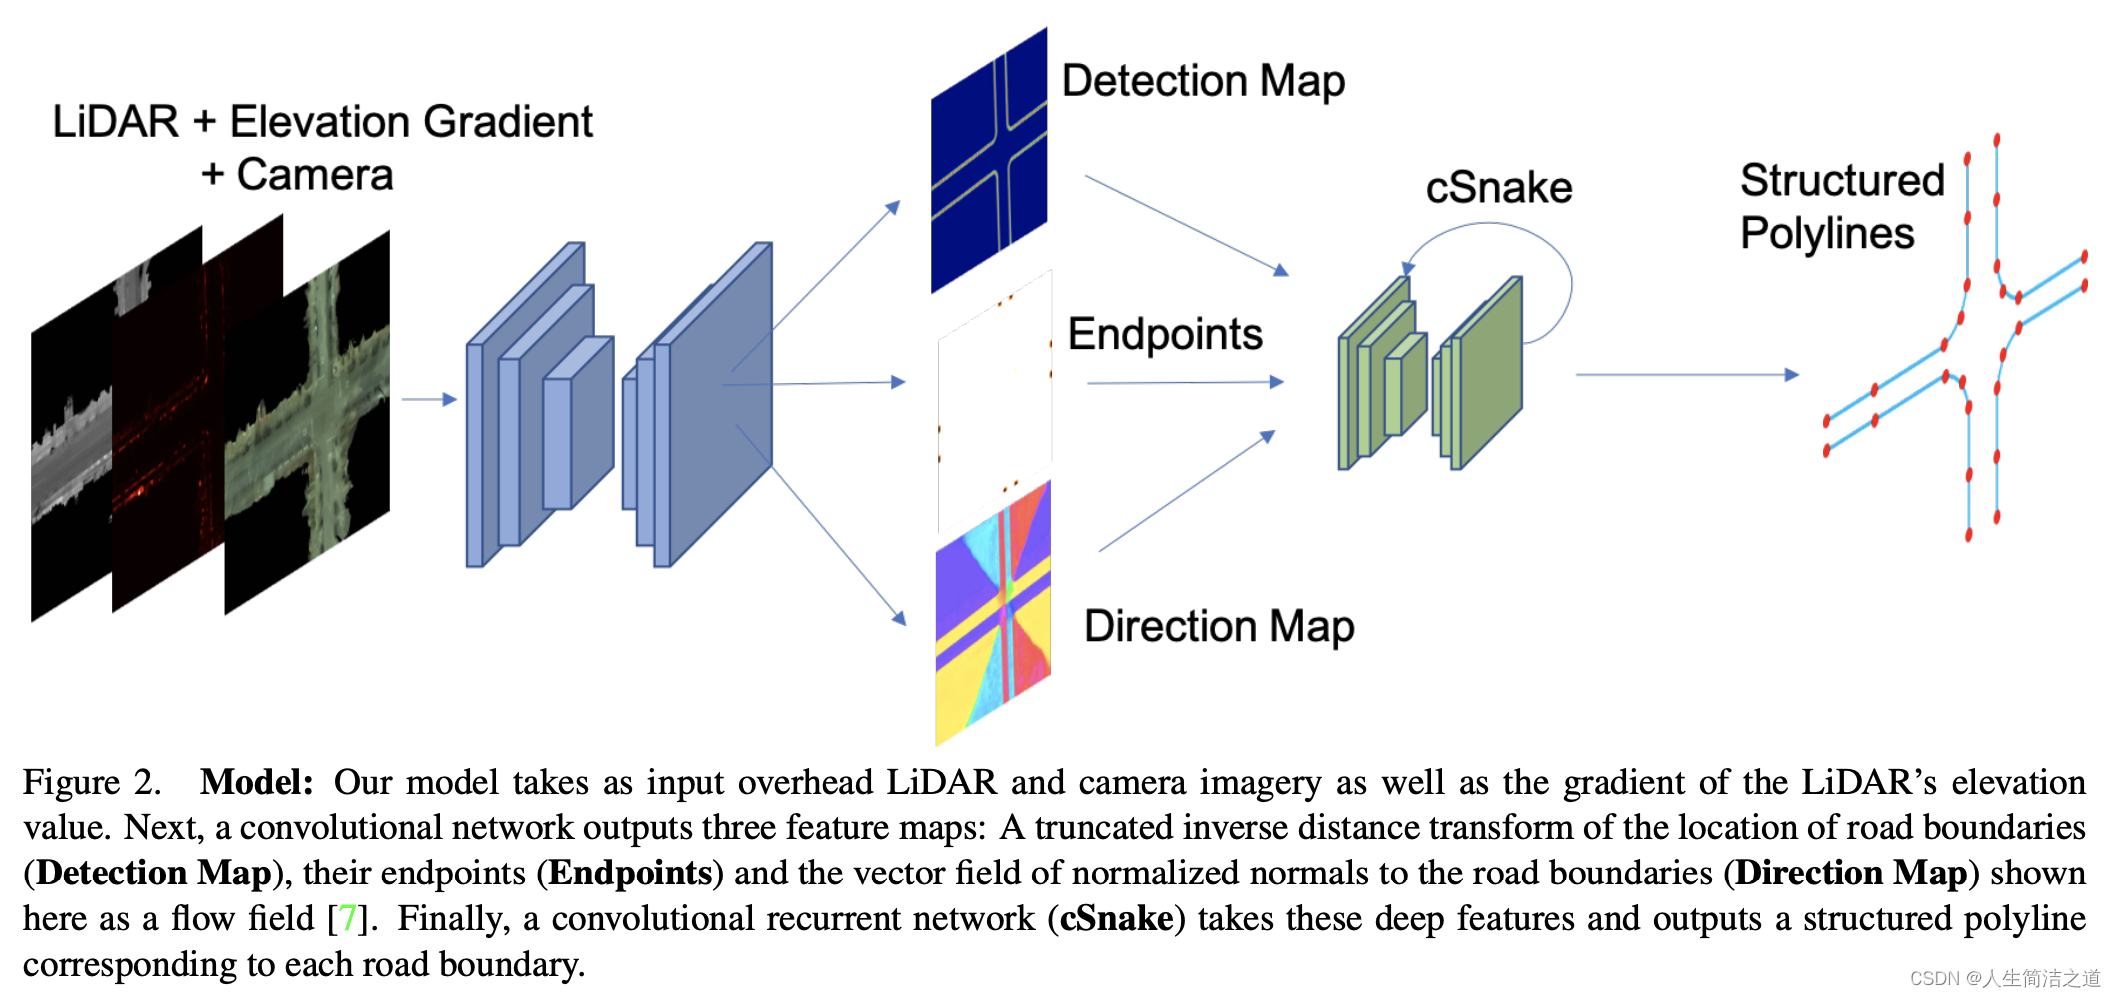
2020’ Convolutional Recurrent Network for Road Boundary Extraction
- Github
- 将camera,LiDar、elevation gradient 三类图作为输入,进行道路边界提取‘
