接着上篇PCA推导过程文章,本文结合图像来展示PCA的应用过程
Jupyter notebook 源文件在这里
1 借助库函数来PCA重建
使用sklearn库函数
# Import needed libs
import numpy as np
import matplotlib.pyplot as plt
from sklearn.datasets import load_digits
from sklearn.decomposition import PCA
from sklearn.metrics import mean_squared_error
导入图像数据,并输出数据大小
# Load the digits dataset
digits = load_digits()
X = digits.data
y = digits.target# Original data size
original_size = X.nbytes / (1024 * 1024)  # in megabytes
print("original data size is: %.2f MB" % original_size)
original data size is: 0.88 MB
输出前十个数据图像
# Plot the first 10 samples as images
fig, axes = plt.subplots(1, 10, figsize=(12, 4))
for i in range(10):axes[i].imshow(X[i].reshape(8, 8), cmap='gray')axes[i].set_title(f"Label: {y[i]}")axes[i].axis('off')
plt.tight_layout()
plt.show()

打印第一个数据的矩阵形式
# Print the first 1 sample in matrix form
for i in range(1):print(f"Sample {i+1}:")sample_matrix = X[i].reshape(8, 8)  # Reshape the row vector to a matrixprint(sample_matrix)print(f"Label: {y[i]}")print()
Sample 1:[[ 0. 0. 5. 13. 9. 1. 0. 0.][ 0. 0. 13. 15. 10. 15. 5. 0.][ 0. 3. 15. 2. 0. 11. 8. 0.][ 0. 4. 12. 0. 0. 8. 8. 0.][ 0. 5. 8. 0. 0. 9. 8. 0.][ 0. 4. 11. 0. 1. 12. 7. 0.][ 0. 2. 14. 5. 10. 12. 0. 0.][ 0. 0. 6. 13. 10. 0. 0. 0.]]Label: 0
写一些用来辅助衡量重建效果的函数,一会用到
# Function to calculate reconstruction error
def reconstruction_error(original, reconstructed):return mean_squared_error(original, reconstructed)# Function to perform PCA and reconstruct data with n_components
def perform_pca(n_components):pca = PCA(n_components=n_components)X_pca = pca.fit_transform(X)X_reconstructed = pca.inverse_transform(X_pca)return X_reconstructed, pca
根据输入的主成分个数来压缩数据的函数
# Function to perform PCA, and visualize result. Input is the number of principle components
def analyze_pca(n_components):X_reconstructed, pca = perform_pca(n_components)reconstruction_error_val = reconstruction_error(X, X_reconstructed)print(f"Number of Components: {n_components}, Reconstruction Error: {reconstruction_error_val}")# Size of compressed filecompressed_size = (pca.components_.nbytes + pca.mean_.nbytes + X_reconstructed.nbytes) / (1024 * 1024)  # in megabytesprint(f"Size of Compressed File: {compressed_size} MB")# Difference in sizesize_difference = original_size - compressed_sizeprint(f"Difference in Size: {size_difference} MB")# Plot original and reconstructed images for each digitfig, axes = plt.subplots(2, 10, figsize=(10, 2))for digit in range(10):digit_indices = np.where(y == digit)[0]  # Indices of samples with the current digitoriginal_matrix = X[digit_indices[0]].reshape(8, 8)  # Take the first sample for each digitreconstructed_matrix = np.round(X_reconstructed[digit_indices[0]].reshape(8, 8), 1)  # Round to one decimal placeaxes[0, digit].imshow(original_matrix, cmap='gray')axes[0, digit].axis('off')axes[1, digit].imshow(reconstructed_matrix, cmap='gray')axes[1, digit].axis('off')plt.suptitle(f'Reconstruction with {n_components} Components')plt.show()# Print the first data's matrixprint("Original Matrix of the First Data:")print(original_matrix)# Print the reconstruction matrixprint("\nReconstruction Matrix of the First Data:")print(reconstructed_matrix)
结果展示:使用一个主成分来压缩图像并对比结果
analyze_pca(1)
Number of Components: 1, Reconstruction Error: 15.977678462244262Size of Compressed File: 0.87841796875 MBDifference in Size: -0.0009765625 MB

Original Matrix of the First Data:[[ 0. 0. 11. 12. 0. 0. 0. 0.][ 0. 2. 16. 16. 16. 13. 0. 0.][ 0. 3. 16. 12. 10. 14. 0. 0.][ 0. 1. 16. 1. 12. 15. 0. 0.][ 0. 0. 13. 16. 9. 15. 2. 0.][ 0. 0. 0. 3. 0. 9. 11. 0.][ 0. 0. 0. 0. 9. 15. 4. 0.][ 0. 0. 9. 12. 13. 3. 0. 0.]]Reconstruction Matrix of the First Data:[[ 0. 0.4 6.4 12.6 12. 6.3 1.4 0.1][ 0. 2.6 11.7 11.2 10.5 9.4 1.9 0.1][ 0. 3. 9.4 5.8 8. 8.7 1.6 0. ][ 0. 2.1 7.7 9. 11.1 7.8 2. 0. ][ 0. 1.5 5.6 8.2 9.8 8.5 2.8 0. ][ 0. 1. 5.2 5.9 6.5 8.2 3.7 0. ][ 0. 0.8 7.8 9. 8.8 9.5 4.1 0.2][ 0. 0.4 6.8 12.9 11.9 7.3 2.3 0.4]]
再选择5个主成分来压缩图像,比较重建效果。
analyze_pca(5)
Number of Components: 5, Reconstruction Error: 8.542447616771714Size of Compressed File: 0.88037109375 MBDifference in Size: -0.0029296875 MB

Original Matrix of the First Data:[[ 0. 0. 11. 12. 0. 0. 0. 0.][ 0. 2. 16. 16. 16. 13. 0. 0.][ 0. 3. 16. 12. 10. 14. 0. 0.][ 0. 1. 16. 1. 12. 15. 0. 0.][ 0. 0. 13. 16. 9. 15. 2. 0.][ 0. 0. 0. 3. 0. 9. 11. 0.][ 0. 0. 0. 0. 9. 15. 4. 0.][ 0. 0. 9. 12. 13. 3. 0. 0.]]Reconstruction Matrix of the First Data:[[-0. 0.2 5.2 11.1 12.1 7. 1.6 0.1][ 0. 2.1 11.2 10.7 9.7 9.6 2.3 0.2][ 0. 3.1 11.2 6.2 6. 9.2 2.5 0.1][ 0. 3.1 10.3 9. 9.6 9.6 2.9 0. ][ 0. 2.2 6. 5.3 8. 11.6 3.9 0. ][ 0. 1.2 4.2 1.9 4.9 11.7 5.1 0. ][ 0. 0.6 6.7 6.2 8.8 12.1 4.4 0.2][ 0. 0.2 5.4 12.1 13.4 8.2 1.8 0.3]]
2 手动计算PCA解码矩阵
按照PCA的原理公式,来分布计算PCA的解码矩阵,便于理解其流程。
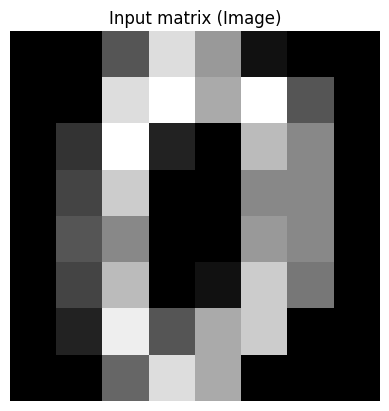
输入原图并查看
# Then use step-by-step wat to calculate the PCA steps;
# Take the first data point for analysis
first_data = X[0]
print("Raw input data: \n", X[0])
print("Raw data shape: ", X[0].shape)
# Reshape the data point into a 2D array (image)
input_matrix = first_data.reshape(8, 8)print("Input matrix: ")
for row in input_matrix:print(" ".join(f"{val:4.0f}" for val in row))# Print the original matrix (image)
plt.imshow(input_matrix, cmap='gray')
plt.title("Input matrix (Image)")
plt.axis('off')
plt.show()
Raw input data: [ 0. 0. 5. 13. 9. 1. 0. 0. 0. 0. 13. 15. 10. 15. 5. 0. 0. 3.15. 2. 0. 11. 8. 0. 0. 4. 12. 0. 0. 8. 8. 0. 0. 5. 8. 0.0. 9. 8. 0. 0. 4. 11. 0. 1. 12. 7. 0. 0. 2. 14. 5. 10. 12.0. 0. 0. 0. 6. 13. 10. 0. 0. 0.]Raw data shape: (64,)Input matrix: 0 0 5 13 9 1 0 00 0 13 15 10 15 5 00 3 15 2 0 11 8 00 4 12 0 0 8 8 00 5 8 0 0 9 8 00 4 11 0 1 12 7 00 2 14 5 10 12 0 00 0 6 13 10 0 0 0
根据公式计算 X T X X^TX XTX,或输入数据的协方差矩阵Cov:
# Transpose X
X_transpose = input_matrix.T# Calculate X^T * X
XTX = np.multiply(X_transpose, input_matrix)
# Or use cov to cal:
# XTX = np.cov(X_transpose)# Print the result
print("Matrix of XTX:")
print(XTX)# Step 1: Calculate the covariance matrix
covariance_matrix = np.cov(X_transpose)print(covariance_matrix.shape)
Matrix of XTX:[[ 0. 0. 0. 0. 0. 0. 0. 0.][ 0. 0. 39. 60. 50. 60. 10. 0.][ 0. 39. 225. 24. 0. 121. 112. 0.][ 0. 60. 24. 0. 0. 0. 40. 0.][ 0. 50. 0. 0. 0. 9. 80. 0.][ 0. 60. 121. 0. 9. 144. 84. 0.][ 0. 10. 112. 40. 80. 84. 0. 0.][ 0. 0. 0. 0. 0. 0. 0. 0.]](8, 8)矩阵特征分解,打印出矩阵的特征值和特征向量:
# Step 2: Calculate the eigenvalues and eigenvectors of the covariance matrix
eigenvalues, eigenvectors = np.linalg.eig(covariance_matrix)# Print the eigenvalues
print("\nStep 2: Eigenvalues")
print(eigenvalues)# Print the eigenvectors
print("\nStep 2: Eigenvectors")
print(eigenvectors)
Step 2: Eigenvalues[8.92158455e+01 3.14545089e+01 7.61850164e+00 2.85144338e+002.01453633e-01 1.53898738e-02 0.00000000e+00 0.00000000e+00]Step 2: Eigenvectors[[ 0. 0. 0. 0. 0. 0.1. 0. ][-0.20365153 0.09344175 0.07506402 -0.23052329 -0.41043409 -0.850037030. 0. ][-0.22550077 -0.48188982 0.20855091 0.79993174 -0.1168451 -0.141048050. 0. ][ 0.65318552 -0.28875672 -0.59464342 0.12374602 0.11324705 -0.328982470. 0. ][ 0.48997693 -0.31860576 0.39448425 -0.20610464 -0.63307453 0.243993180. 0. ][-0.33563583 -0.75773097 -0.0607778 -0.49775699 0.24837474 0.006811390. 0. ][-0.35818338 -0.00212894 -0.66178497 0.03760326 -0.58531429 0.299556280. 0. ][ 0. 0. 0. 0. 0. 0.0. 1. ]]
使用一个主成分的情况下,选择最大的特征值所对应的特征向量构成解码矩阵:
# Find the index of the largest eigenvalue
largest_eigenvalue_index = np.argmax(eigenvalues)# Step 3: Use the eigenvector corresponding to the largest eigenvalue to form the decoding matrix
decoding_matrix = eigenvectors[:, largest_eigenvalue_index].reshape(-1, 1)# Print the decoding matrix
print("\nStep 3: Decoding Matrix")
print(decoding_matrix)```bashStep 3: Decoding Matrix[[ 0.        ][-0.20365153][-0.22550077][ 0.65318552][ 0.48997693][-0.33563583][-0.35818338][ 0.        ]]
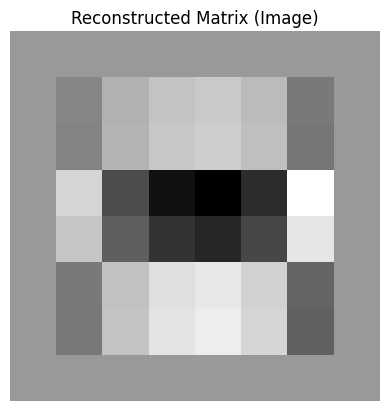
查看重建效果:
# Step 4: Reconstruct the data point using the decoding matrix
reconstructed_data = np.dot(decoding_matrix, decoding_matrix.T.dot(input_matrix))# Reshape the reconstructed data into a 2D array (image)
reconstructed_matrix = reconstructed_data.reshape(8, 8)# Print the reconstructed matrix
print("\nStep 4: Reconstructed Matrix")
print(reconstructed_matrix)
Step 4: Reconstructed Matrix[[ 0. 0. 0. 0. 0. 0.0. 0. ][ 0. -0.47394076 0.6065763 1.07867928 1.21253812 0.86059781-0.80922666 0. ][ 0. -0.52478863 0.67165429 1.19440797 1.34262817 0.95292911-0.89604648 0. ][ 0. 1.52010272 -1.9455138 -3.45972209 -3.88905673 -2.760254442.59548821 0. ][ 0. 1.14028135 -1.45939683 -2.59525656 -2.91731524 -2.070561811.946965 0. ][ 0. -0.78109652 0.99969169 1.77775938 1.99837065 1.41834173-1.3336775 0. ][ 0. -0.83356951 1.0668496 1.89718681 2.13261844 1.51362398-1.42327212 0. ][ 0. 0. 0. 0. 0. 0.0. 0. ]]
# Plot the reconstructed matrix (image)
plt.imshow(reconstructed_matrix, cmap='gray')
plt.title("Reconstructed Matrix (Image)")
plt.axis('off')
plt.show()
若选择两个主成分的情况,可以使用最大的及次最大特征值对应的特征向量构成解码矩阵,可自行尝试,以此类推。


