首先先封装一些openlayers的工具函数,如下所示:
import VectorSource from 'ol/source/Vector';
import VectorLayer from 'ol/layer/Vector';
import Style from 'ol/style/Style';
import Fill from 'ol/style/Fill';
import Stroke from 'ol/style/Stroke';
import Circle from 'ol/style/Circle';
import Polygon from 'ol/geom/Polygon';
import LineString from 'ol/geom/LineString';
import Point from 'ol/geom/Point';
import Feature from 'ol/Feature';
import Text from 'ol/style/Text';
import { getLength } from 'ol/sphere';
import { getArea } from 'ol/sphere';
import Draw from 'ol/interaction/Draw';
import { unByKey } from 'ol/Observable';let draw;
let drawSource;//定义绘制图层
let drawLayer;//定义绘制图层
let sketch;
let output = 0;
let lastPolygonLabelFeature; //记录上一个面标注要素
let lastLengthLabelFeature; //记录上一个点标注要素// 初始化测量绘制图层
export function initDrawLayer(map) {drawSource = new VectorSource({crossOrigin: "anonymous",});drawLayer = new VectorLayer({source: drawSource,style: new Style({fill: new Fill({color: "rgba(255, 255, 255, 0.2)",}),stroke: new Stroke({color: "#ffcc33",width: 2,}),image: new Circle({radius: 7,fill: new Fill({color: "#ffcc33",}),}),}),});map.addLayer(drawLayer);map.on("pointermove", function (evt) {if (evt.dragging) {return;}let Coord;if (sketch) {let geom = sketch.getGeometry();if (geom instanceof Polygon) {if (lastPolygonLabelFeature) {// console.log(lastPolygonLabelFeature);//  鼠标移动,不停的添加和删除drawSource.removeFeature(lastPolygonLabelFeature);}Coord = geom.getInteriorPoint().getCoordinates();//新建一个要素ol.FeaturelastPolygonLabelFeature = new Feature({geometry: new Point(Coord), //几何信息name: output,});lastPolygonLabelFeature.setStyle(createLabelStyle(lastPolygonLabelFeature, 0, 0));drawSource.addFeature(lastPolygonLabelFeature);} else if (geom instanceof LineString) {if (lastLengthLabelFeature) {drawSource.removeFeature(lastLengthLabelFeature);}Coord = geom.getLastCoordinate();// 新建一个要素ol.FeaturelastLengthLabelFeature = new Feature({geometry: new Point(Coord), //几何信息name: output,});lastLengthLabelFeature.setStyle(createLabelStyle(lastLengthLabelFeature, 35, -10));// 设置要素样式drawSource.addFeature(lastLengthLabelFeature);}}});map.on("click", function (evt) {let coordinate = evt.coordinate; //鼠标单击点的坐标// //console.log(coordinate);if (output == "0") {lastPolygonLabelFeature = null;if (lastLengthLabelFeature) {drawSource.removeFeature(lastLengthLabelFeature);lastLengthLabelFeature = null;}return;}var Coord;if (sketch) {var geom = sketch.getGeometry();if (geom instanceof Polygon) {if (lastPolygonLabelFeature) {drawSource.removeFeature(lastPolygonLabelFeature);}Coord = geom.getInteriorPoint().getCoordinates();//新建一个要素ol.Featurevar newFeature = new Feature({geometry: new Point(Coord), //几何信息name: output,});lastPolygonLabelFeature = newFeature;newFeature.setStyle(createLabelStyle(newFeature, 0, 0)); //设置要素样式drawSource.addFeature(newFeature);} else if (geom instanceof LineString) {Coord = geom.getLastCoordinate();//新建一个要素ol.Featurelet newFeature = new Feature({geometry: new Point(Coord), //几何信息name: output,});newFeature.setStyle(createLabelStyle(newFeature, 35, -10)); //设置要素样式drawSource.addFeature(newFeature);}let pointFeature = new Feature({geometry: new Point(coordinate), //几何信息name: output,});drawSource.addFeature(pointFeature);}});
}// 定义测量结果的显示的样式
function createLabelStyle(feature, offsetX, offsetY) {return new Style({text: new Text({textAlign: "center", //位置textBaseline: "middle", //基准线font: "normal 10px sans-serif", //文字样式text: feature.get("name"), //文本内容fill: new Fill({//文本填充样式(即文字颜色)color: "white",}),stroke: new Stroke({color: "black",width: 5,}),offsetX: offsetX,offsetY: offsetY,}),});
}function formatLength(line) {let length = getLength(line, {projection: "EPSG:3857",radius: 6378137,});let output;if (length > 100) {output = Math.round((length / 1000) * 100) / 100 + " " + "千米";} else {output = Math.round(length * 100) / 100 + " " + "米";}return output;
}function formatArea(polygon) {var area = getArea(polygon, {projection: "EPSG:3857",radius: 6378137,});var output;if (area > 10000) {output =Math.round((area / 1000000) * 100) / 100 + " " + "平方公里";} else {output = Math.round(area * 100) / 100 + " " + "平方米";}return output;
}function addInteraction(drawType, map) {let type = drawType == "area" ? "Polygon" : "LineString";draw = new Draw({source: drawSource,type: type,style: new Style({fill: new Fill({color: "rgba(255, 0, 0, 0.2)",}),stroke: new Stroke({color: "rgb(255,116,3)",width: 2,}),image: new Circle({radius: 5,stroke: new Stroke({color: "rgba(255, 0, 0, 0.1)",}),fill: new Fill({color: "rgba(255,116,3, 0.3)",}),}),}),});map.addInteraction(draw);var listener;draw.on("drawstart",function (evt) {// set sketchsketch = evt.feature;listener = sketch.getGeometry().on("change", function (evt) {var geom = evt.target;if (geom instanceof Polygon) {output = formatArea(geom);} else if (geom instanceof LineString) {output = formatLength(geom);}});});draw.on("drawend",function () {sketch = null;unByKey(listener);output = "0";});
}export function measureDistance(map) {if (draw) {map.removeInteraction(draw);}addInteraction("length", map);
}export function measureArea(map) {if (draw) {map.removeInteraction(draw);}addInteraction("area", map);
}export function measureClear(map) {map.removeInteraction(draw);drawLayer.setSource(null);drawSource = new VectorSource({crossOrigin: "anonymous",});drawLayer.setSource(drawSource);lastPolygonLabelFeature = null;lastLengthLabelFeature = null;sketch = null;output = "0";
}export function interactionClear(map) {map.removeInteraction(draw);
}
然后再vue的组件中调用以上方法,代码如下:
在组件的monted中调用 initDrawLayer(map);方法
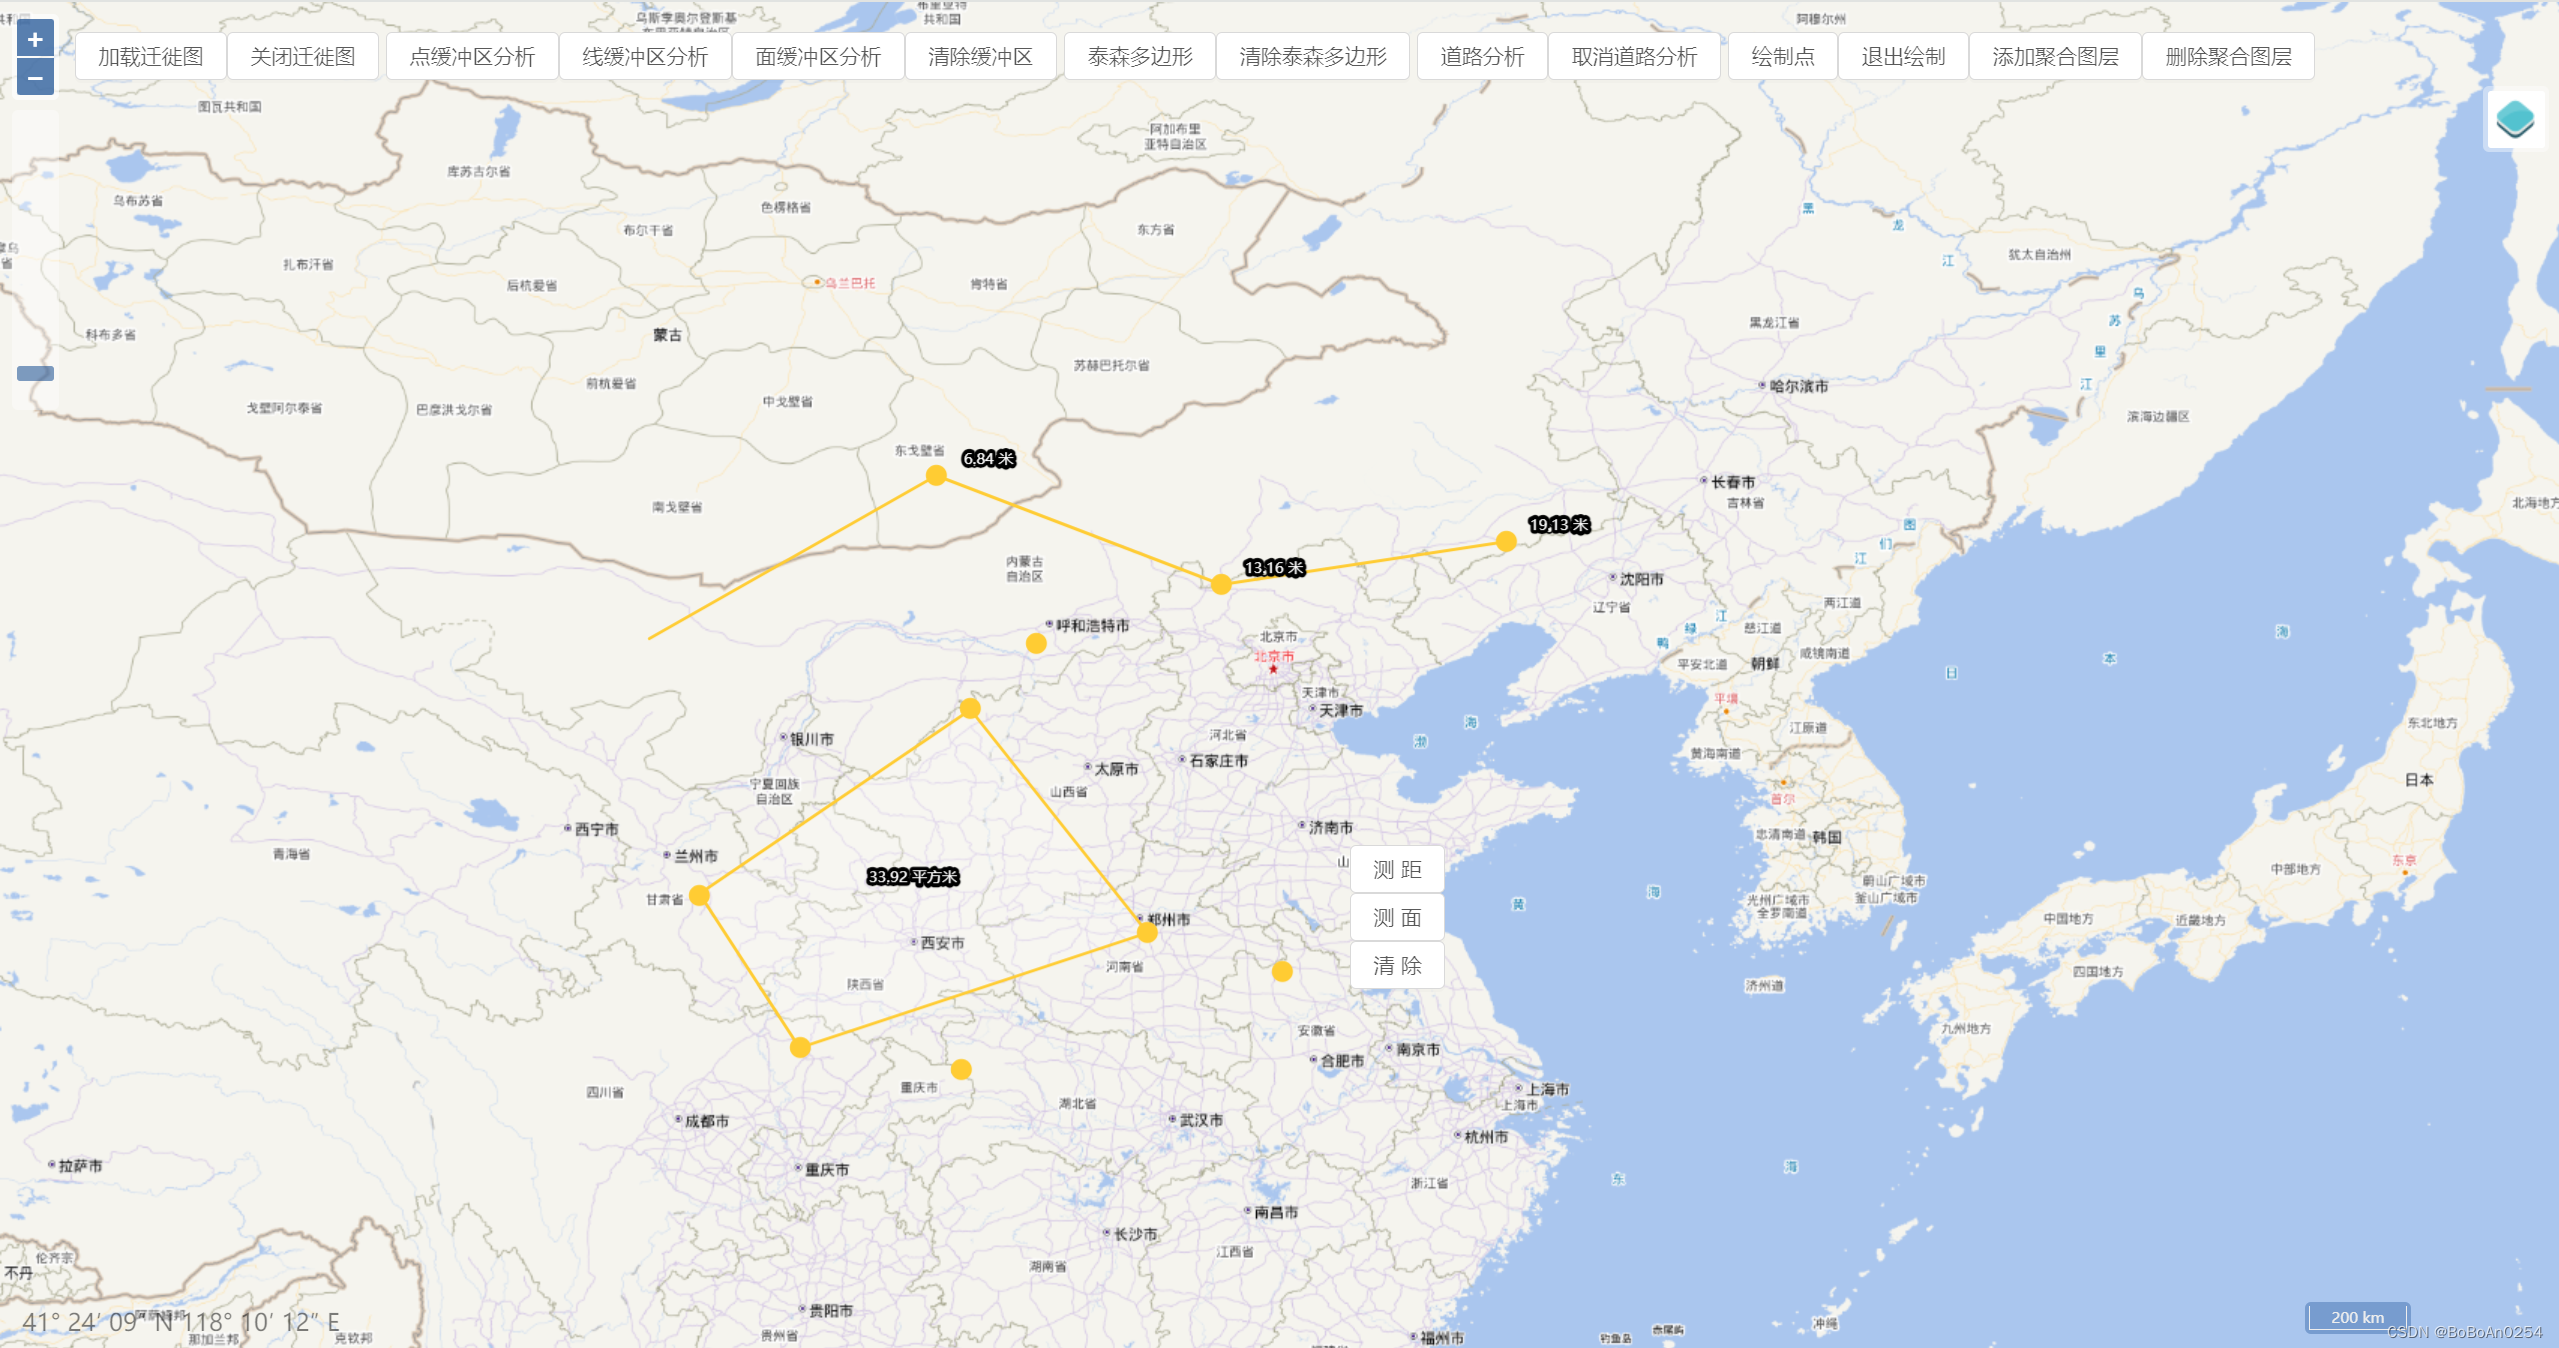
//根据传入type值调用对应方法measure(type) {const that = this;if (type =="distance" ) {that.hideOverlay();measureDistance(window.map);}else if (type =="area" ) {that.hideOverlay();measureArea(window.map);}else if (type =="clear" ) {that.hideOverlay();measureClear(window.map);}}最终实现效果如下:
源码地址连接:https://github.com/enjoyMaps/map_vue