由于课题可能用上cut&tag这个技术,遂跟教程学习一波,记录一下以便后续的学习(主要是怕忘了)
教程网址cut&tag教程
背景知识:靶标下裂解与标记(Cleavage Under Targets & Tagmentation,CUT&Tag)是一种使用蛋白-A-Tn5(pA-Tn5)转座子融合蛋白的系留方法(图 1b)。在 CUT&Tag 中,用特定染色质蛋白抗体孵育透化细胞或细胞核,然后将装有镶嵌末端适配体的 pA-Tn5 依次拴系在抗体结合位点上。通过添加镁离子激活转座子,将适配体整合到附近的 DNA 中。然后对这些基因进行扩增,生成测序文库。基于抗体拴系 Tn5 的方法灵敏度高,因为 pA-Tn5 拴系后会对样本进行严格清洗,而且适配体整合效率高。与 ChIP-seq 相比,信噪比的提高使绘制染色质特征图所需的测序量减少了一个数量级,这样就可以通过对文库进行条形码 PCR,在 Illumina NGS 测序仪上进行成对端测序。通过CUT&Tag可以检测组蛋白修饰状态。
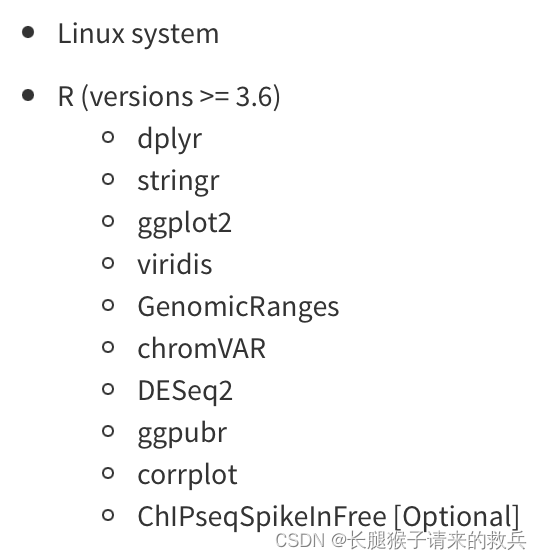
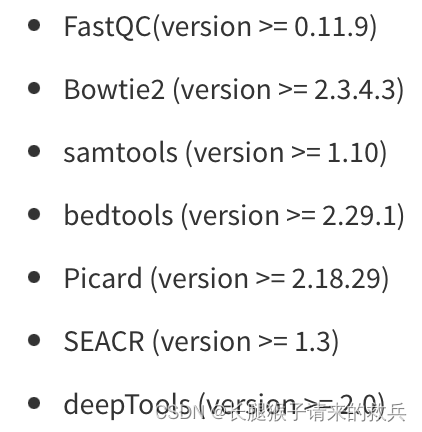
环境要求:
一、安装环境所需要的所有包
参考我前面的博客,通过conda安装
二、数据准备

1.下载数据
首先获取SRR_Acc_List.txt,然后批量下载,下载的SRA数据存放路径~/my_project/PRJNA606273/raw
cd raw/
cat ../SRR_Acc_List.txt |while read id;do (prefetch ${id} &);done
2.SRR数据转fastq
cd ../
mkdir -p PRJNA606273/data
for i in `ls raw`;do fastq-dump --split-3 $i --gzip -O ./data;done
3.FastQC质量检测
cd data/
ls *fastq.gz|while read id;do fastqc $id;done
二、比对
1.Alignment to HG38
1)需要先建立hg38索引
cd my_project/PRJNA606273
mkdir -p ref/hg38
mkdir -p ref/index
cd ref/hg38
nohup wget http://hgdownload.cse.ucsc.edu/goldenPath/hg38/bigZips/hg38.fa.gz  &
cd ref
bowtie2-build ./hg38/hg38.fa ./index/hg38 #耗时比较久,可以挂后台运行
2)比对
#!/bin/bashcores=8
projPath=~/my_project/PRJNA606273
ref="${projPath}/ref/index/hg38"mkdir -p ${projPath}/alignment/sam/bowtie2_summary
mkdir -p ${projPath}/alignment/bam
mkdir -p ${projPath}/alignment/bed
mkdir -p ${projPath}/alignment/bedgraphls *_1.fastq.gz|while read id; do id=${id/_1.fastq.gz/} #将字符串 id 中的_1.fq.gz 部分替换为空字符串,即将_1.fq.gz删除
bowtie2 --end-to-end --very-sensitive --no-mixed --no-discordant --phred33 -I 10 -X 700 -p ${cores} -x ${ref} -1 \
${projPath}/data/${id}_1.fastq.gz -2 ${projPath}/data/${id}_2.fastq.gz \
-S ${projPath}/alignment/sam/${id}_bowtie2.sam &> ${projPath}/alignment/sam/bowtie2_summary/${id}_bowtie2.txt
done
比对完之后可以在alignment/sam/bowtie2_summary/${id}_bowtie2.txt看到比对结果的summary,如下

我发现我做出来的结果测序深度一致,但是比对的结果有一点差异,不知道是我的操作问题,还是参考基因组更新了导致比对结果出现了些许不同
2.Alignment to spike-in genome for spike-in calibration
1)需要先建立Ecoli索引
cd my_project/PRJNA606273
mkdir -p ref/Ecoli
cd ./ref/Ecoli
wget ftp://ftp.ncbi.nlm.nih.gov/genomes/all/GCF/000/005/845/GCF_000005845.2_ASM584v2/GCF_000005845.2_ASM584v2_genomic.fna.gz
gzip -dc GCF_000005845.2_ASM584v2_genomic.fna.gz > E.coli_K12_MG1655.fa
cd ../
bowtie2-build ./Ecoli/E.coli_K12_MG1655.fa ./index/Ecoli
wget https://hgdownload.cse.ucsc.edu/goldenpath/hg38/bigZips/hg38.chrom.sizes
2)比对
#!/bin/bash
cores=8
projPath=~/my_project/PRJNA606273
spikeInRef="${projPath}/ref/index/Ecoli"
chromSize="~/my_project/PRJNA606273/ref/hg38.chrom.sizes"ls *_1.fastq.gz|while read id; do id=${id/_1.fastq.gz/} #将字符串 id 中的_1.fq.gz 部分替换为空字符串,即将_1.fq.gz删除
bowtie2 --end-to-end --very-sensitive --no-mixed --no-discordant --phred33 -I 10 -X 700 -p ${cores} -x ${spikeInRef} -1 ${projPath}/data/${id}_1.fastq.gz -2 ${projPath}/data/${id}_2.fastq.gz -S $projPath/alignment/sam/${id}_bowtie2_spikeIn.sam &> $projPath/alignment/sam/bowtie2_summary/${id}_bowtie2_spikeIn.txtseqDepthDouble=`samtools view -F 0x04 $projPath/alignment/sam/${id}_bowtie2_spikeIn.sam | wc -l`
seqDepth=$((seqDepthDouble/2))
echo $seqDepth >$projPath/alignment/sam/bowtie2_summary/${id}_bowtie2_spikeIn.seqDepth
done
在运行上面的代码的时候遇到一个关于samtools的报错
samtools: /home/administrator/miniconda3/envs/breakseq/bin/…/lib/libtinfow.so.6: no version information available (required by samtools)
samtools: /home/administrator/miniconda3/envs/breakseq/bin/…/lib/libncursesw.so.6: no version information available (required by samtools)
samtools: /home/administrator/miniconda3/envs/breakseq/bin/…/lib/libncursesw.so.6: no version information available (required by samtools)
解决办法:
conda install -c conda-forge ncurses
3.汇报比对结果
此部分在R上进行
因为前面部分我一直采用都是SRR的编号命名,而教程提供的代码都是用K4me3和K27me3命名,为了直接套用这里的代码,我就按照对应的关系将文件重命名
cd sam
rename 's/SRR11074254/K4me3_rep1/g' *
rename 's/SRR11074240/K27me3_rep2/g' *
rename 's/SRR11074258/K4me3_rep2/g' *
rename 's/SRR12246717/K27me3_rep1/g' *
rename 's/SRR8754611/IgG_rep2/g' *
rename 's/SRR8754612/IgG_rep1/g' *cd bowtie2_summary/
rename 's/SRR11074254/K4me3_rep1/g' *
rename 's/SRR11074240/K27me3_rep2/g' *
rename 's/SRR11074258/K4me3_rep2/g' *
rename 's/SRR12246717/K27me3_rep1/g' *
rename 's/SRR8754611/IgG_rep2/g' *
rename 's/SRR8754612/IgG_rep1/g' *
1)Sequencing depth
library(dplyr)
library(stringr)
library(ggplot2)
library(viridis)
library(GenomicRanges)
library(chromVAR) ## For FRiP analysis and differential analysis
library(DESeq2) ## For differential analysis section
library(ggpubr) ## For customizing figures
library(corrplot) ## For correlation plot
##=== R command ===##
## Path to the project and histone list
projPath = "~/my_project/PRJNA606273"
sampleList = c("K27me3_rep1", "K27me3_rep2", "K4me3_rep1", "K4me3_rep2", "IgG_rep1", "IgG_rep2")
histList = c("K27me3", "K4me3", "IgG")## Collect the alignment results from the bowtie2 alignment summary files
alignResult = c()
for(hist in sampleList){alignRes = read.table(paste0(projPath, "/alignment/sam/bowtie2_summary/", hist, "_bowtie2.txt"), header = FALSE, fill = TRUE)alignRate = substr(alignRes$V1[6], 1, nchar(as.character(alignRes$V1[6]))-1)histInfo = strsplit(hist, "_")[[1]]alignResult = data.frame(Histone = histInfo[1], Replicate = histInfo[2], SequencingDepth = alignRes$V1[1] %>% as.character %>% as.numeric, MappedFragNum_hg38 = alignRes$V1[4] %>% as.character %>% as.numeric + alignRes$V1[5] %>% as.character %>% as.numeric, AlignmentRate_hg38 = alignRate %>% as.numeric)  %>% rbind(alignResult, .)
}
alignResult$Histone = factor(alignResult$Histone, levels = histList)
alignResult %>% mutate(AlignmentRate_hg38 = paste0(AlignmentRate_hg38, "%"))


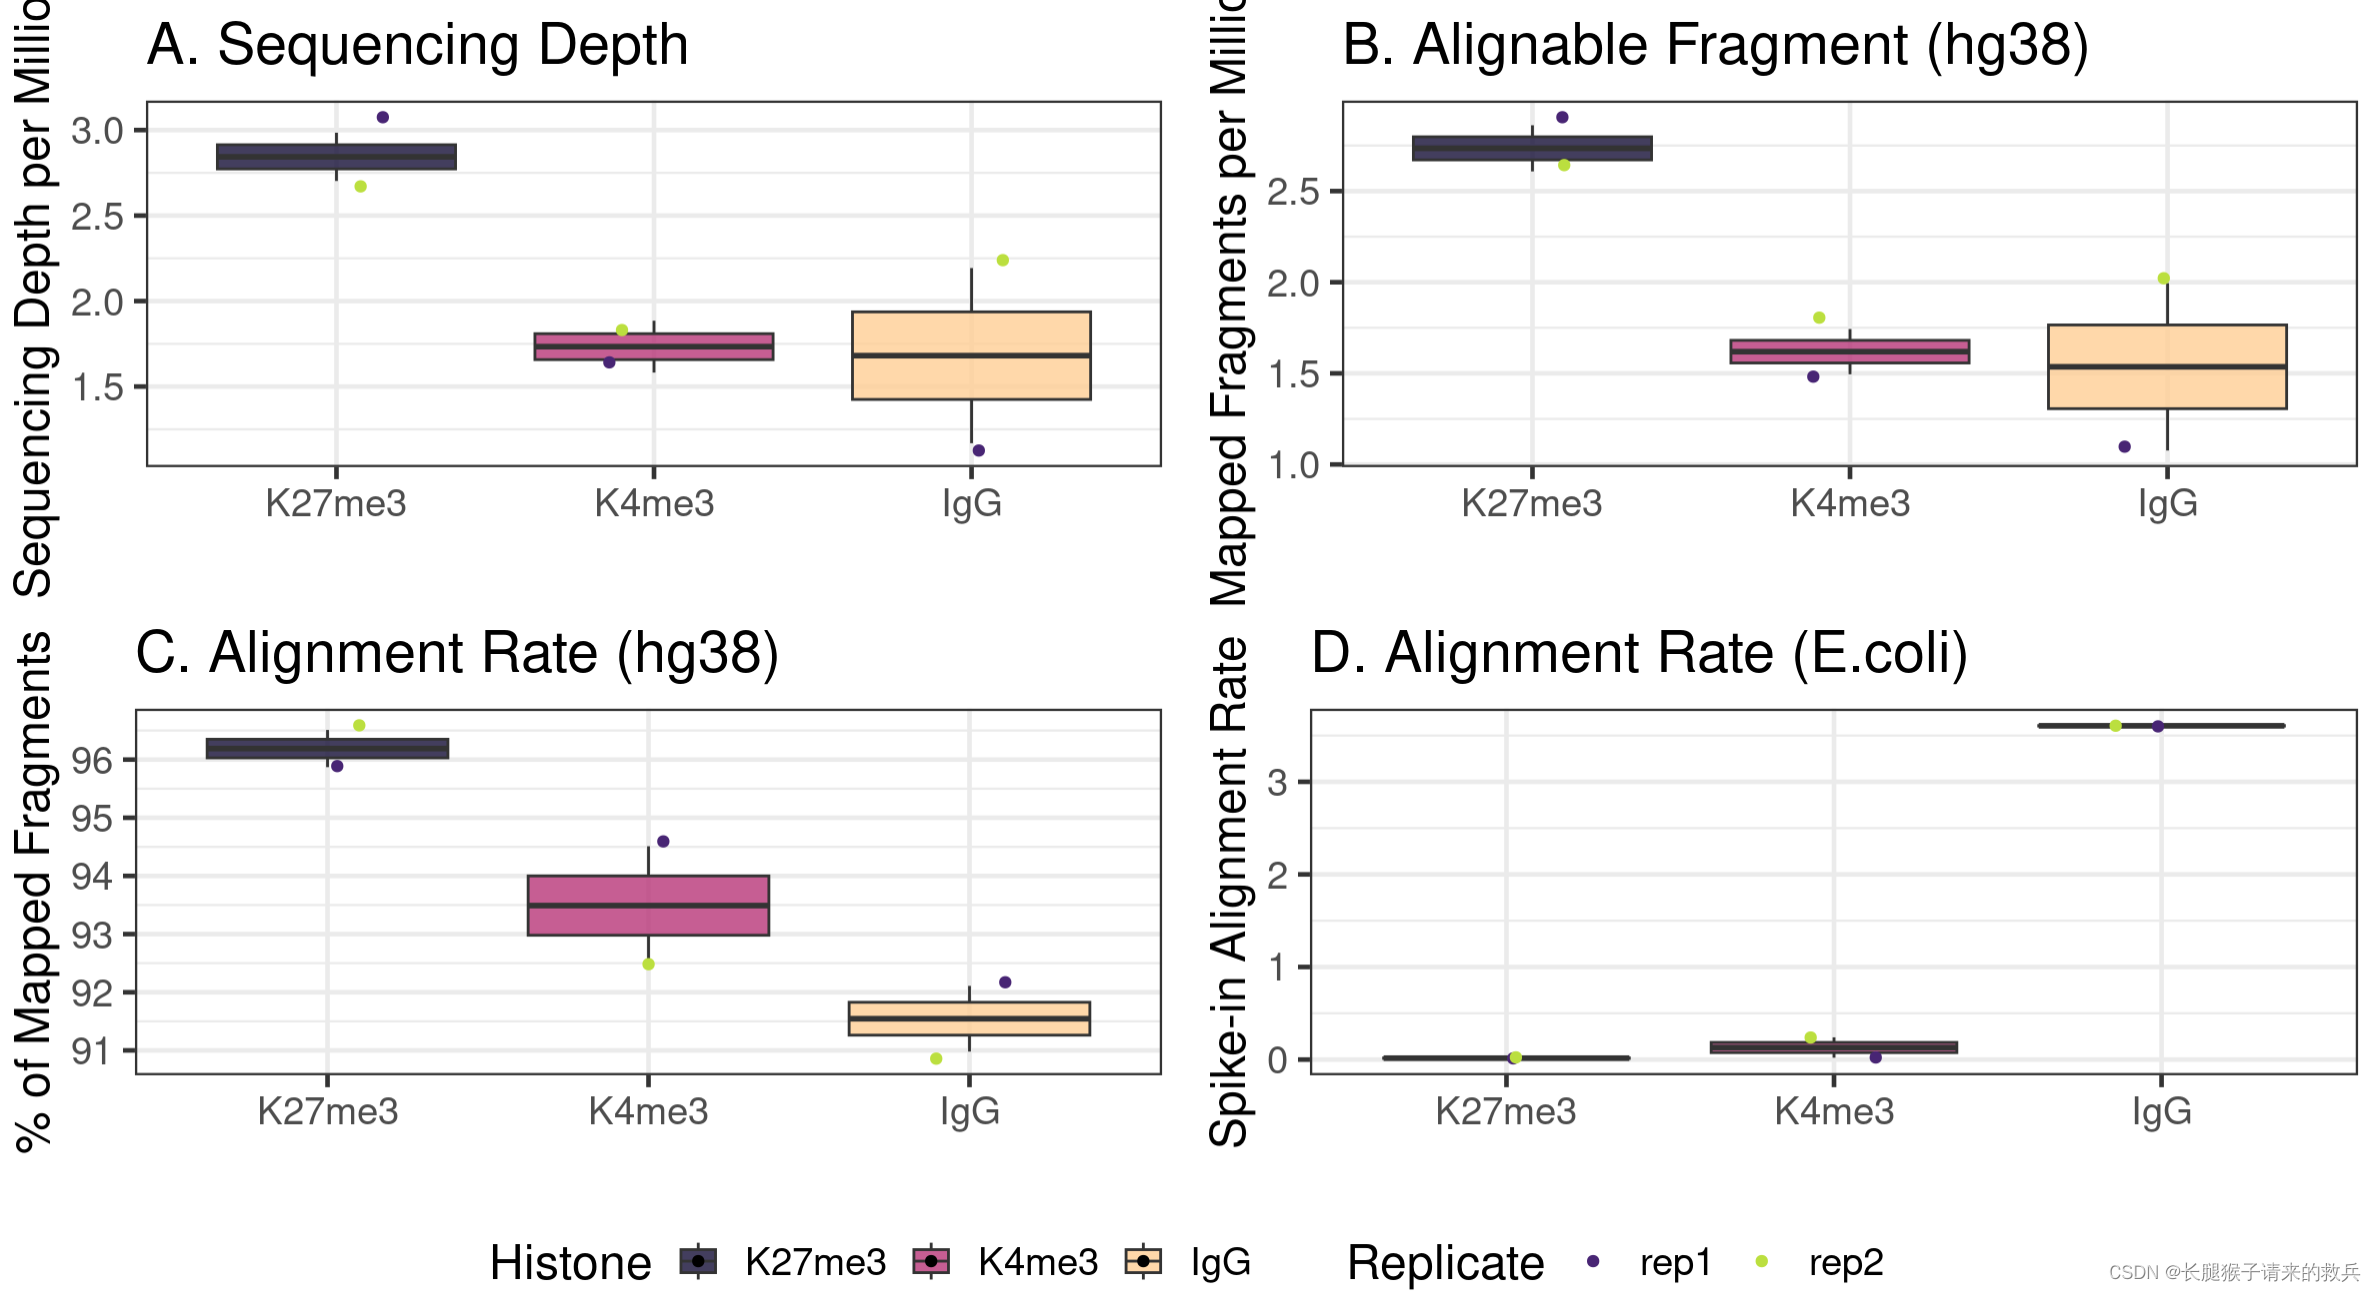
上图是我得到的结果,下图是教程的结果,比对结果有一些差异,我也不知道具体原因是啥。特别是IgG_rep1,我后续直接按照教程下载的fastq文件重新跑也是一样结果,奇怪的很。
2)Spike-in alignment
##=== R command ===##
spikeAlign = c()
for(hist in sampleList){spikeRes = read.table(paste0(projPath, "/alignment/sam/bowtie2_summary/", hist, "_bowtie2_spikeIn.txt"), header = FALSE, fill = TRUE)alignRate = substr(spikeRes$V1[6], 1, nchar(as.character(spikeRes$V1[6]))-1)histInfo = strsplit(hist, "_")[[1]]spikeAlign = data.frame(Histone = histInfo[1], Replicate = histInfo[2], SequencingDepth = spikeRes$V1[1] %>% as.character %>% as.numeric, MappedFragNum_spikeIn = spikeRes$V1[4] %>% as.character %>% as.numeric + spikeRes$V1[5] %>% as.character %>% as.numeric, AlignmentRate_spikeIn = alignRate %>% as.numeric)  %>% rbind(spikeAlign, .)
}
spikeAlign$Histone = factor(spikeAlign$Histone, levels = histList)
spikeAlign %>% mutate(AlignmentRate_spikeIn = paste0(AlignmentRate_spikeIn, "%"))


上图是我得到的结果,下图是教程的结果,除了IgG_rep1外比对结果一致。感觉是IgG_rep1给错了数据编号。
3)Summarize the alignment to hg38 and E.coli
##=== R command ===##
alignSummary = left_join(alignResult, spikeAlign, by = c("Histone", "Replicate", "SequencingDepth")) %>%mutate(AlignmentRate_hg38 = paste0(AlignmentRate_hg38, "%"), AlignmentRate_spikeIn = paste0(AlignmentRate_spikeIn, "%"))
alignSummary
4)Visualizing the sequencing depth and alignment results
##=== R command ===##
## Generate sequencing depth boxplot
fig3A = alignResult %>% ggplot(aes(x = Histone, y = SequencingDepth/1000000, fill = Histone)) +geom_boxplot() +geom_jitter(aes(color = Replicate), position = position_jitter(0.15)) +scale_fill_viridis(discrete = TRUE, begin = 0.1, end = 0.9, option = "magma", alpha = 0.8) +scale_color_viridis(discrete = TRUE, begin = 0.1, end = 0.9) +theme_bw(base_size = 18) +ylab("Sequencing Depth per Million") +xlab("") + ggtitle("A. Sequencing Depth")fig3B = alignResult %>% ggplot(aes(x = Histone, y = MappedFragNum_hg38/1000000, fill = Histone)) +geom_boxplot() +geom_jitter(aes(color = Replicate), position = position_jitter(0.15)) +scale_fill_viridis(discrete = TRUE, begin = 0.1, end = 0.9, option = "magma", alpha = 0.8) +scale_color_viridis(discrete = TRUE, begin = 0.1, end = 0.9) +theme_bw(base_size = 18) +ylab("Mapped Fragments per Million") +xlab("") +ggtitle("B. Alignable Fragment (hg38)")fig3C = alignResult %>% ggplot(aes(x = Histone, y = AlignmentRate_hg38, fill = Histone)) +geom_boxplot() +geom_jitter(aes(color = Replicate), position = position_jitter(0.15)) +scale_fill_viridis(discrete = TRUE, begin = 0.1, end = 0.9, option = "magma", alpha = 0.8) +scale_color_viridis(discrete = TRUE, begin = 0.1, end = 0.9) +theme_bw(base_size = 18) +ylab("% of Mapped Fragments") +xlab("") +ggtitle("C. Alignment Rate (hg38)")fig3D = spikeAlign %>% ggplot(aes(x = Histone, y = AlignmentRate_spikeIn, fill = Histone)) +geom_boxplot() +geom_jitter(aes(color = Replicate), position = position_jitter(0.15)) +scale_fill_viridis(discrete = TRUE, begin = 0.1, end = 0.9, option = "magma", alpha = 0.8) +scale_color_viridis(discrete = TRUE, begin = 0.1, end = 0.9) +theme_bw(base_size = 18) +ylab("Spike-in Alignment Rate") +xlab("") +ggtitle("D. Alignment Rate (E.coli)")ggarrange(fig3A, fig3B, fig3C, fig3D, ncol = 2, nrow=2, common.legend = TRUE, legend="bottom")
三、去重
1.安装picard
conda install picard
在使用picard时出现了报错,Unable to access jarfile picard.jar
谷歌了一下,发现原因可能是因为环境变量的问题,系统不知道picard的具体位置,需要设置全局环境变量,遂查了一下picard的位置

应该是位于上一级share目录中,知道具体picard具体位置后,就去设置环境变量
cd
vim .bashrc
#将下面这两句命令添加至.bashrc文件末尾
PICARD=~/miniconda3/envs/rna_seq/share/picard-3.1.1-0/picard.jar
alias picard="java -jar $PICARD"
当我以为成功的时候,再用picard的时候再次出现了报错
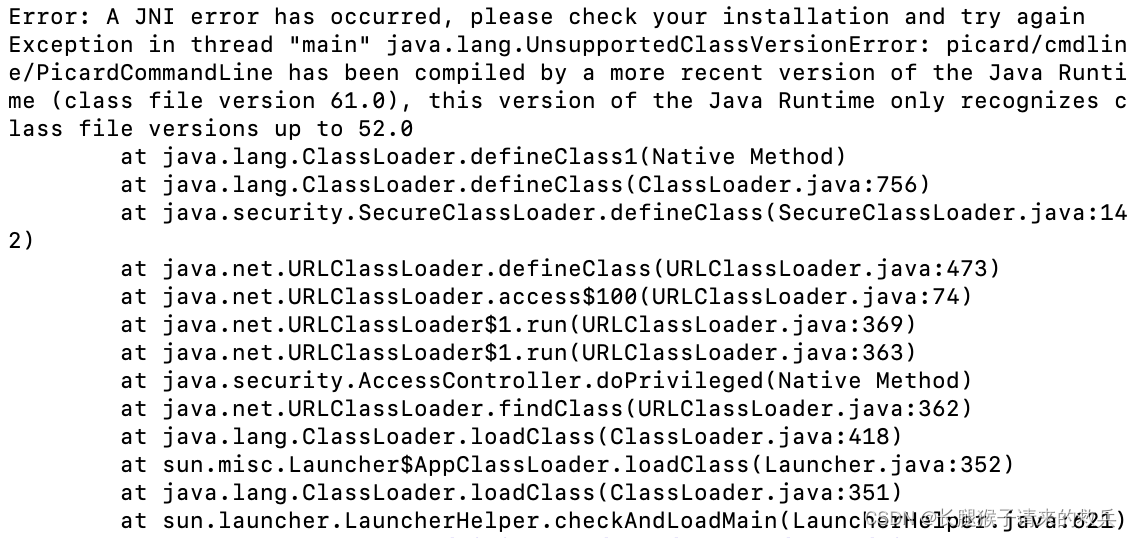
Error: A JNI error has occurred, please check your installation and try again
Exception in thread “main” java.lang.UnsupportedClassVersionError: picard/cmdline/PicardCommandLine has been compiled by a more recent version of the Java Runtime (class file version 61.0), this version of the Java Runtime only recognizes class file versions up to 52.0
at java.lang.ClassLoader.defineClass1(Native Method)
at java.lang.ClassLoader.defineClass(ClassLoader.java:756)
at java.security.SecureClassLoader.defineClass(SecureClassLoader.java:142)
at java.net.URLClassLoader.defineClass(URLClassLoader.java:473)
at java.net.URLClassLoader.access$100(URLClassLoader.java:74)
at java.net.URLClassLoader$1.run(URLClassLoader.java:369)
at java.net.URLClassLoader 1. r u n ( U R L C l a s s L o a d e r . j a v a : 363 ) a t j a v a . s e c u r i t y . A c c e s s C o n t r o l l e r . d o P r i v i l e g e d ( N a t i v e M e t h o d ) a t j a v a . n e t . U R L C l a s s L o a d e r . f i n d C l a s s ( U R L C l a s s L o a d e r . j a v a : 362 ) a t j a v a . l a n g . C l a s s L o a d e r . l o a d C l a s s ( C l a s s L o a d e r . j a v a : 418 ) a t s u n . m i s c . L a u n c h e r 1.run(URLClassLoader.java:363) at java.security.AccessController.doPrivileged(Native Method) at java.net.URLClassLoader.findClass(URLClassLoader.java:362) at java.lang.ClassLoader.loadClass(ClassLoader.java:418) at sun.misc.Launcher 1.run(URLClassLoader.java:363)atjava.security.AccessController.doPrivileged(NativeMethod)atjava.net.URLClassLoader.findClass(URLClassLoader.java:362)atjava.lang.ClassLoader.loadClass(ClassLoader.java:418)atsun.misc.LauncherAppClassLoader.loadClass(Launcher.java:352)
at java.lang.ClassLoader.loadClass(ClassLoader.java:351)
at sun.launcher.LauncherHelper.checkAndLoadMain(LauncherHelper.java:621)
发现可能是因为picard版本太新的原因,遂卸载当前版本,下载旧版本2.25.5的picard
conda remove picard
conda install picard=2.25.5
然后终于成功了,可以使用了
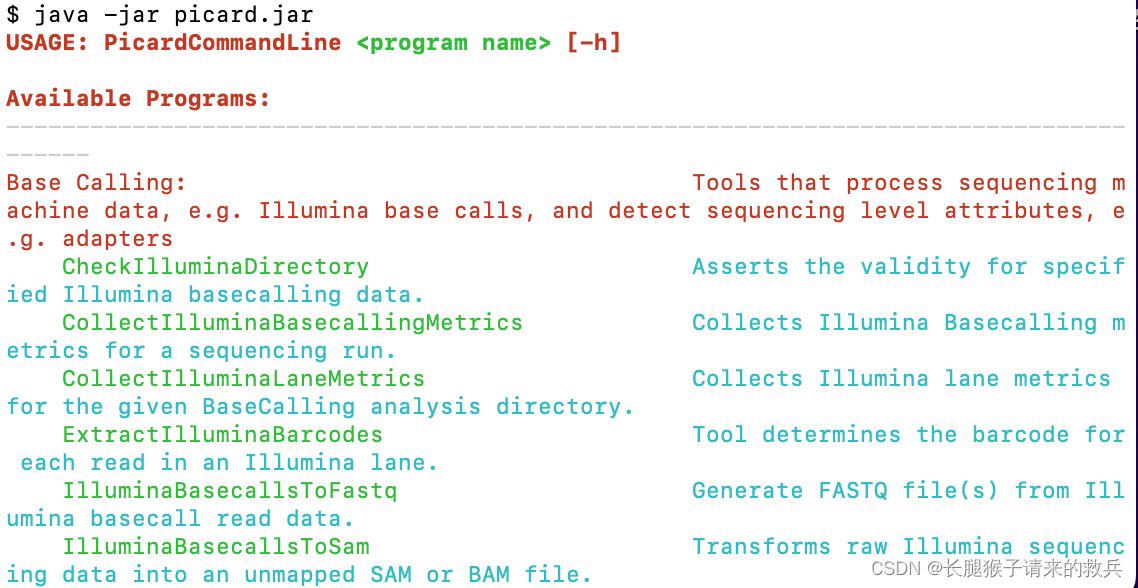
这个时候再去更新.bashrc文件,就可以随处可用picard了
2.去重
#!/bin/bashprojPath=~/my_project/PRJNA606273mkdir -p $projPath/alignment/removeDuplicate/picard_summaryls *bowtie2.sam|while read histName; do histName=${histName/_bowtie2.sam/} #将字符串 id 中的_bowtie2.sam 部分替换为空字符串,即将_bowtie2.sam删除
## Sort by coordinate
picard SortSam I=$projPath/alignment/sam/${histName}_bowtie2.sam O=$projPath/alignment/sam/${histName}_bowtie2.sorted.sam SORT_ORDER=coordinate## mark duplicates
picard MarkDuplicates I=$projPath/alignment/sam/${histName}_bowtie2.sorted.sam O=$projPath/alignment/removeDuplicate/${histName}_bowtie2.sorted.dupMarked.sam METRICS_FILE=$projPath/alignment/removeDuplicate/picard_summary/${histName}_picard.dupMark.txt## remove duplicates
picard MarkDuplicates I=$projPath/alignment/sam/${histName}_bowtie2.sorted.sam O=$projPath/alignment/removeDuplicate/${histName}_bowtie2.sorted.rmDup.sam REMOVE_DUPLICATES=true METRICS_FILE=$projPath/alignment/removeDuplicate/picard_summary/${histName}_picard.rmDup.txt
done
3.汇报结果
##=== R command ===##
## Summarize the duplication information from the picard summary outputs.
dupResult = c()
for(hist in sampleList){dupRes = read.table(paste0(projPath, "/alignment/removeDuplicate/picard_summary/", hist, "_picard.rmDup.txt"), header = TRUE, fill = TRUE)histInfo = strsplit(hist, "_")[[1]]dupResult = data.frame(Histone = histInfo[1], Replicate = histInfo[2], MappedFragNum_hg38 = dupRes$READ_PAIRS_EXAMINED[1] %>% as.character %>% as.numeric, DuplicationRate = dupRes$PERCENT_DUPLICATION[1] %>% as.character %>% as.numeric * 100, EstimatedLibrarySize = dupRes$ESTIMATED_LIBRARY_SIZE[1] %>% as.character %>% as.numeric) %>% mutate(UniqueFragNum = MappedFragNum_hg38 * (1-DuplicationRate/100))  %>% rbind(dupResult, .)
}
dupResult$Histone = factor(dupResult$Histone, levels = histList)
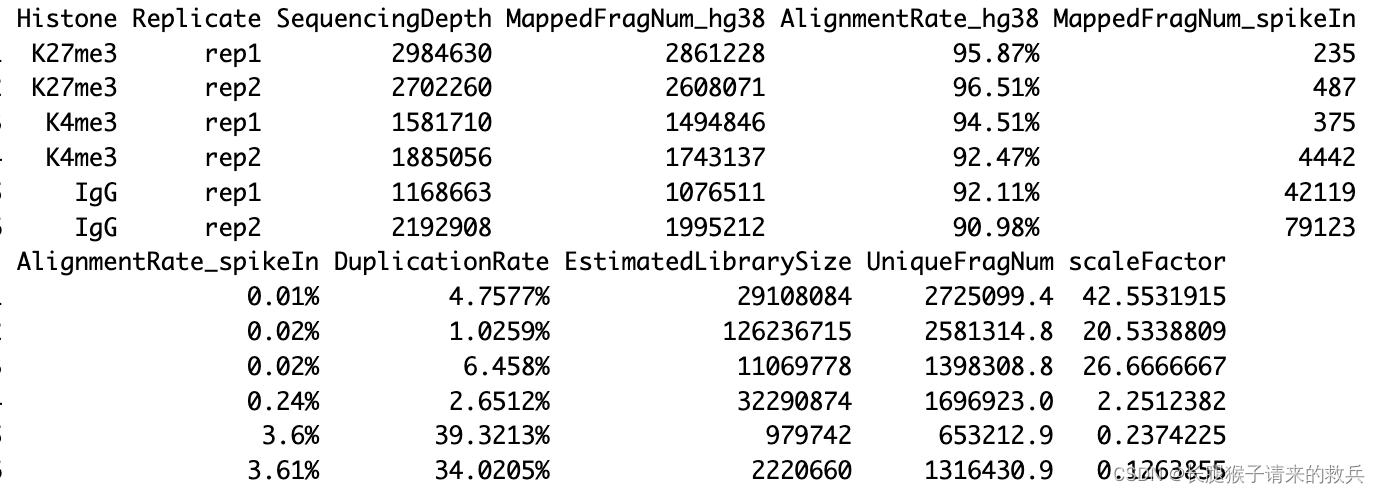
alignDupSummary = left_join(alignSummary, dupResult, by = c("Histone", "Replicate", "MappedFragNum_hg38")) %>% mutate(DuplicationRate = paste0(DuplicationRate, "%"))
alignDupSummary


上图是我的结果,下图是教程的结果,结果不太一致,不知道是具体的原因是什么。
可视化结果:
##=== R command ===##
## generate boxplot figure for the  duplication rate
fig4A = dupResult %>% ggplot(aes(x = Histone, y = DuplicationRate, fill = Histone)) +geom_boxplot() +geom_jitter(aes(color = Replicate), position = position_jitter(0.15)) +scale_fill_viridis(discrete = TRUE, begin = 0.1, end = 0.9, option = "magma", alpha = 0.8) +scale_color_viridis(discrete = TRUE, begin = 0.1, end = 0.9) +theme_bw(base_size = 18) +ylab("Duplication Rate (*100%)") +xlab("") fig4B = dupResult %>% ggplot(aes(x = Histone, y = EstimatedLibrarySize, fill = Histone)) +geom_boxplot() +geom_jitter(aes(color = Replicate), position = position_jitter(0.15)) +scale_fill_viridis(discrete = TRUE, begin = 0.1, end = 0.9, option = "magma", alpha = 0.8) +scale_color_viridis(discrete = TRUE, begin = 0.1, end = 0.9) +theme_bw(base_size = 18) +ylab("Estimated Library Size") +xlab("") fig4C = dupResult %>% ggplot(aes(x = Histone, y = UniqueFragNum, fill = Histone)) +geom_boxplot() +geom_jitter(aes(color = Replicate), position = position_jitter(0.15)) +scale_fill_viridis(discrete = TRUE, begin = 0.1, end = 0.9, option = "magma", alpha = 0.8) +scale_color_viridis(discrete = TRUE, begin = 0.1, end = 0.9) +theme_bw(base_size = 18) +ylab("# of Unique Fragments") +xlab("")ggarrange(fig4A, fig4B, fig4C, ncol = 3, common.legend = TRUE, legend="bottom")
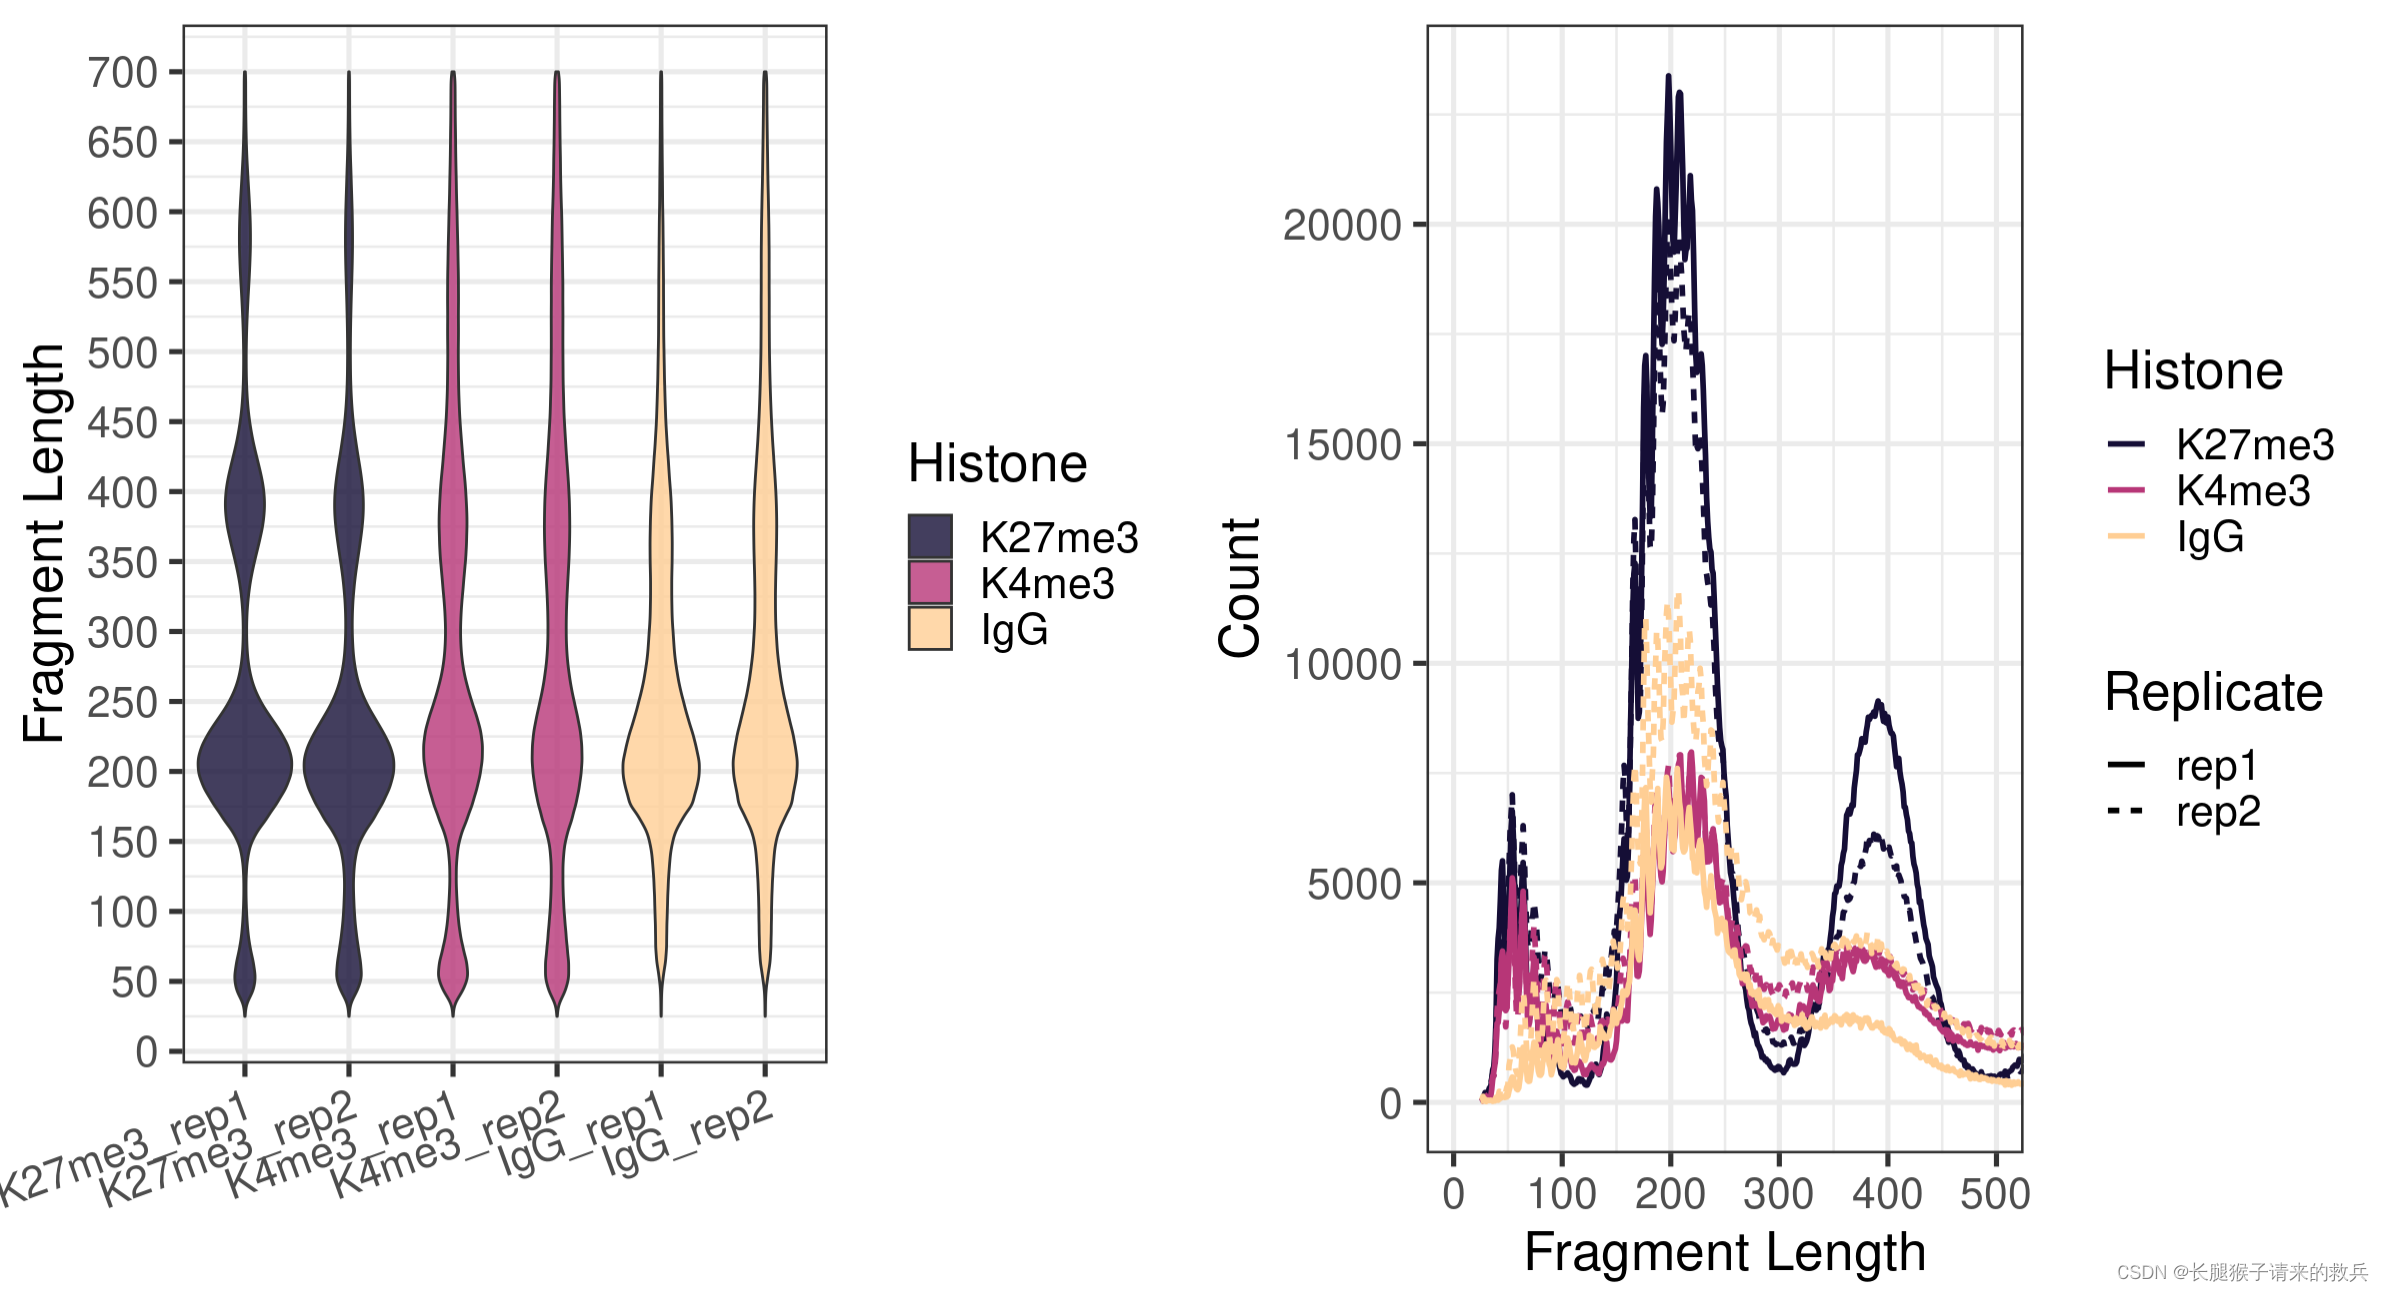
四. Assess mapped fragment size distribution
#!/bin/bash
projPath=~/my_project/PRJNA606273
mkdir -p $projPath/alignment/sam/fragmentLenls *bowtie2.sam|while read histName; do histName=${histName/_bowtie2.sam/} #将字符串 id 中的_bowtie2.sam 部分替换为空字符串,即将_bowtie2.sam删除
## Extract the 9th column from the alignment sam file which is the fragment length
samtools view -F 0x04 $projPath/alignment/sam/${histName}_bowtie2.sam | awk -F'\t' 'function abs(x){return ((x < 0.0) ? -x : x)} {print abs($9)}' | sort | uniq -c | awk -v OFS="\t" '{print $2, $1/2}' >$projPath/alignment/sam/fragmentLen/${histName}_fragmentLen.txt
done
##=== R command ===##
## Collect the fragment size information
fragLen = c()
for(hist in sampleList){histInfo = strsplit(hist, "_")[[1]]fragLen = read.table(paste0(projPath, "/alignment/sam/fragmentLen/", hist, "_fragmentLen.txt"), header = FALSE) %>% mutate(fragLen = V1 %>% as.numeric, fragCount = V2 %>% as.numeric, Weight = as.numeric(V2)/sum(as.numeric(V2)), Histone = histInfo[1], Replicate = histInfo[2], sampleInfo = hist) %>% rbind(fragLen, .)
}
fragLen$sampleInfo = factor(fragLen$sampleInfo, levels = sampleList)
fragLen$Histone = factor(fragLen$Histone, levels = histList)
## Generate the fragment size density plot (violin plot)
fig5A = fragLen %>% ggplot(aes(x = sampleInfo, y = fragLen, weight = Weight, fill = Histone)) +geom_violin(bw = 5) +scale_y_continuous(breaks = seq(0, 800, 50)) +scale_fill_viridis(discrete = TRUE, begin = 0.1, end = 0.9, option = "magma", alpha = 0.8) +scale_color_viridis(discrete = TRUE, begin = 0.1, end = 0.9) +theme_bw(base_size = 20) +ggpubr::rotate_x_text(angle = 20) +ylab("Fragment Length") +xlab("")fig5B = fragLen %>% ggplot(aes(x = fragLen, y = fragCount, color = Histone, group = sampleInfo, linetype = Replicate)) +geom_line(size = 1) +scale_color_viridis(discrete = TRUE, begin = 0.1, end = 0.9, option = "magma") +theme_bw(base_size = 20) +xlab("Fragment Length") +ylab("Count") +coord_cartesian(xlim = c(0, 500))ggarrange(fig5A, fig5B, ncol = 2)

五.Alignment results filtering and file format conversion
1.Filtering mapped reads by the mapping quality filtering (可选)
#!/bin/bash
projPath=~/my_project/PRJNA606273
minQualityScore=2
ls *bowtie2.sam|while read histName; do histName=${histName/_bowtie2.sam/} #将字符串 id 中的_bowtie2.sam 部分替换为空字符串,即将_bowtie2.sam删除
samtools view -q $minQualityScore ${projPath}/alignment/sam/${histName}_bowtie2.sam >${projPath}/alignment/sam/${histName}_bowtie2.qualityScore$minQualityScore.sam
done
2.File format conversion
#!/bin/bash
projPath=~/my_project/PRJNA606273
ls *bowtie2.sam|while read histName; do histName=${histName/_bowtie2.sam/} #将字符串 id 中的_bowtie2.sam 部分替换为空字符串,即将_bowtie2.sam删除
## Filter and keep the mapped read pairs
samtools view -bS -F 0x04 $projPath/alignment/sam/${histName}_bowtie2.sam >$projPath/alignment/bam/${histName}_bowtie2.mapped.bam## Convert into bed file format
bedtools bamtobed -i $projPath/alignment/bam/${histName}_bowtie2.mapped.bam -bedpe >$projPath/alignment/bed/${histName}_bowtie2.bed## Keep the read pairs that are on the same chromosome and fragment length less than 1000bp.
awk '$1==$4 && $6-$2 < 1000 {print $0}' $projPath/alignment/bed/${histName}_bowtie2.bed >$projPath/alignment/bed/${histName}_bowtie2.clean.bed## Only extract the fragment related columns
cut -f 1,2,6 $projPath/alignment/bed/${histName}_bowtie2.clean.bed | sort -k1,1 -k2,2n -k3,3n  >$projPath/alignment/bed/${histName}_bowtie2.fragments.bed
done
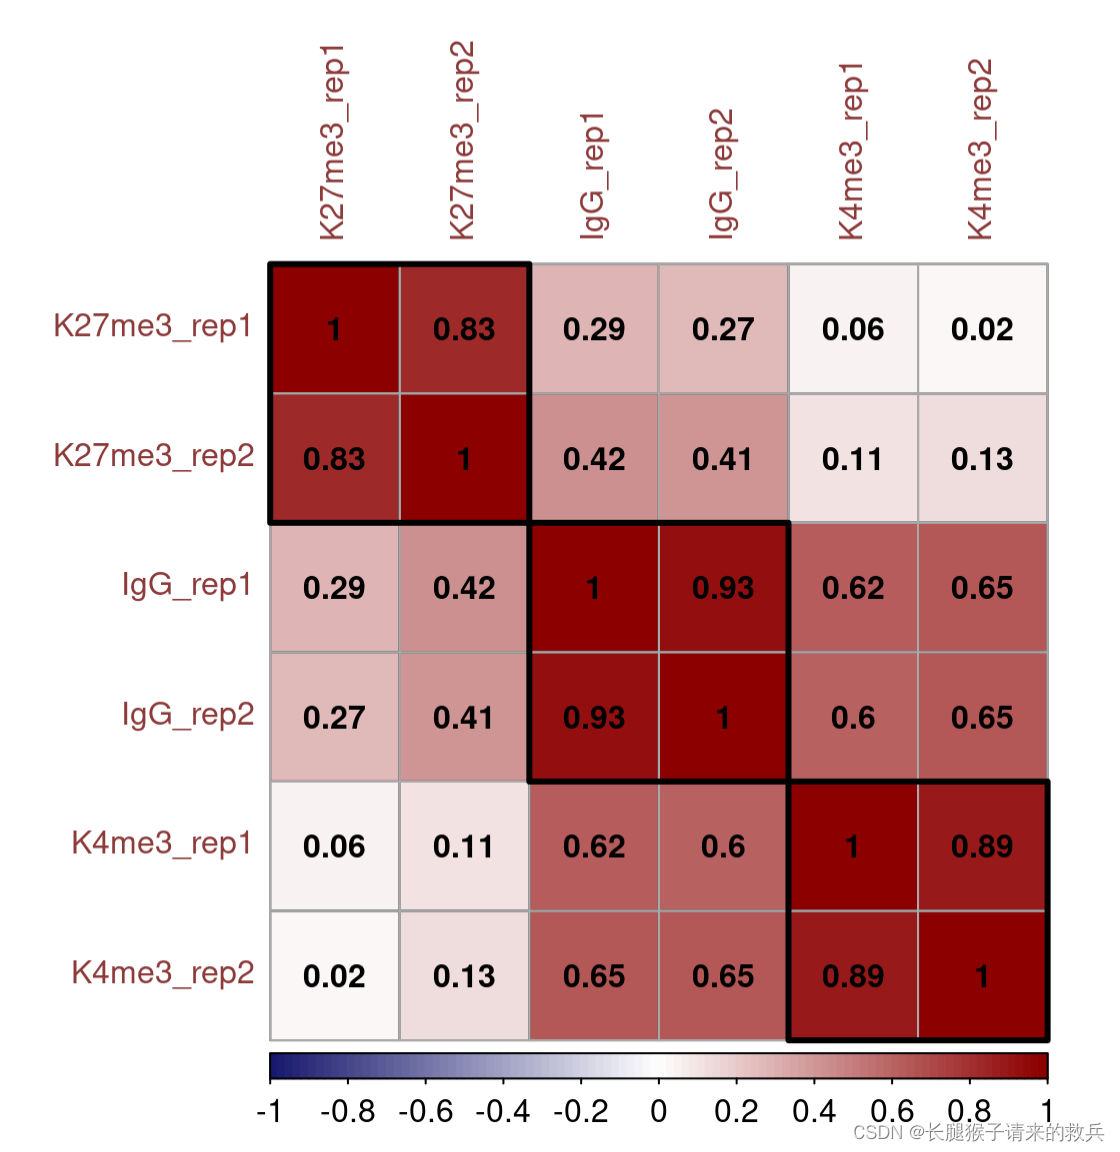
3.Assess replicate reproducibility
#!/bin/bash
projPath=~/my_project/PRJNA606273
ls *bowtie2.sam|while read histName; do histName=${histName/_bowtie2.sam/} #将字符串 id 中的_bowtie2.sam 部分替换为空字符串,即将_bowtie2.sam删除
## We use the mid point of each fragment to infer which 500bp bins does this fragment belong to.
binLen=500
awk -v w=$binLen '{print $1, int(($2 + $3)/(2*w))*w + w/2}' $projPath/alignment/bed/${histName}_bowtie2.fragments.bed | sort -k1,1V -k2,2n | uniq -c | awk -v OFS="\t" '{print $2, $3, $1}' |  sort -k1,1V -k2,2n  >$projPath/alignment/bed/${histName}_bowtie2.fragmentsCount.bin$binLen.bed
done
##== R command ==##
reprod = c()
fragCount = NULL
for(hist in sampleList){if(is.null(fragCount)){fragCount = read.table(paste0(projPath, "/alignment/bed/", hist, "_bowtie2.fragmentsCount.bin500.bed"), header = FALSE) colnames(fragCount) = c("chrom", "bin", hist)}else{fragCountTmp = read.table(paste0(projPath, "/alignment/bed/", hist, "_bowtie2.fragmentsCount.bin500.bed"), header = FALSE)colnames(fragCountTmp) = c("chrom", "bin", hist)fragCount = full_join(fragCount, fragCountTmp, by = c("chrom", "bin"))}
}M = cor(fragCount %>% select(-c("chrom", "bin")) %>% log2(), use = "complete.obs") corrplot(M, method = "color", outline = T, addgrid.col = "darkgray", order="hclust", addrect = 3, rect.col = "black", rect.lwd = 3,cl.pos = "b", tl.col = "indianred4", tl.cex = 1, cl.cex = 1, addCoef.col = "black", number.digits = 2, number.cex = 1, col = colorRampPalette(c("midnightblue","white","darkred"))(100))
六. Spike-in calibration
#!/bin/bash
projPath=~/my_project/PRJNA606273
chromSize=$projPath/ref/hg38.chrom.sizes
ls *bowtie2.sam|while read histName; do histName=${histName/_bowtie2.sam/} #将字符串 id 中的_bowtie2.sam 部分替换为空字符串,即将_bowtie2.sam删除
seqDepth=`cat $projPath/alignment/sam/bowtie2_summary/${histName}_bowtie2_spikeIn.seqDepth`if [[ "$seqDepth" -gt "1" ]]; thenmkdir -p $projPath/alignment/bedgraphscale_factor=`echo "10000 / $seqDepth" | bc -l`echo "Scaling factor for $histName is: $scale_factor!"bedtools genomecov -bg -scale $scale_factor -i $projPath/alignment/bed/${histName}_bowtie2.fragments.bed -g $chromSize > $projPath/alignment/bedgraph/${histName}_bowtie2.fragments.normalized.bedgraph
fidone
##=== R command ===##
scaleFactor = c()
multiplier = 10000
for(hist in sampleList){spikeDepth = read.table(paste0(projPath, "/alignment/sam/bowtie2_summary/", hist, "_bowtie2_spikeIn.seqDepth"), header = FALSE, fill = TRUE)$V1[1]histInfo = strsplit(hist, "_")[[1]]scaleFactor = data.frame(scaleFactor = multiplier/spikeDepth, Histone = histInfo[1], Replicate = histInfo[2])  %>% rbind(scaleFactor, .)
}
scaleFactor$Histone = factor(scaleFactor$Histone, levels = histList)
left_join(alignDupSummary, scaleFactor, by = c("Histone", "Replicate"))
##=== R command ===##
## Generate sequencing depth boxplot
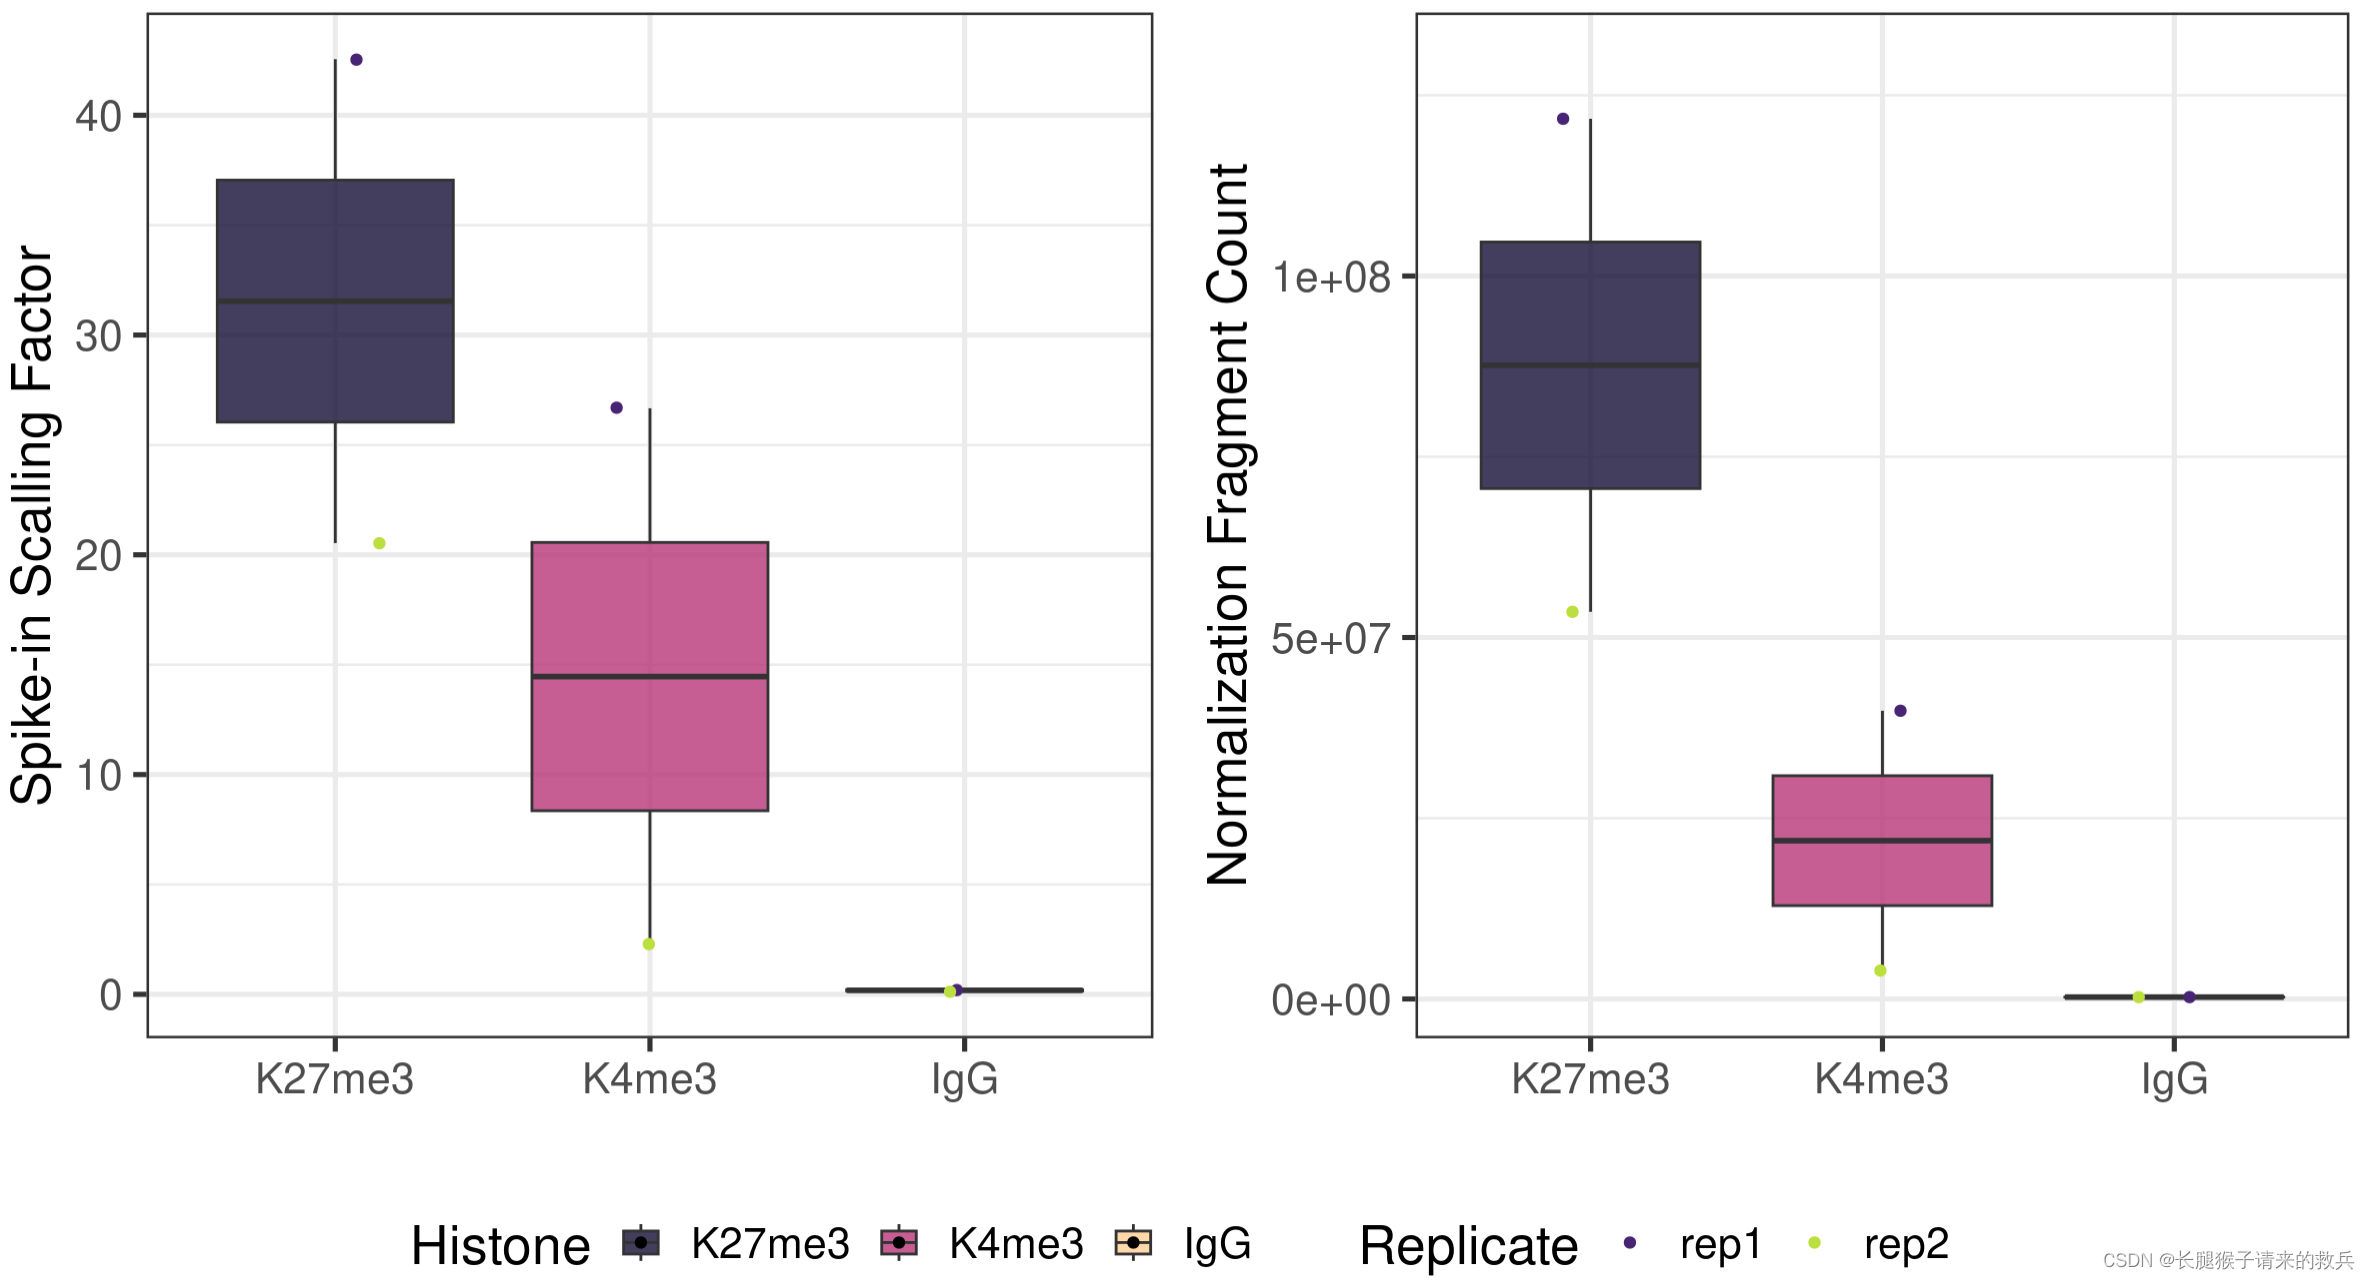
fig6A = scaleFactor %>% ggplot(aes(x = Histone, y = scaleFactor, fill = Histone)) +geom_boxplot() +geom_jitter(aes(color = Replicate), position = position_jitter(0.15)) +scale_fill_viridis(discrete = TRUE, begin = 0.1, end = 0.9, option = "magma", alpha = 0.8) +scale_color_viridis(discrete = TRUE, begin = 0.1, end = 0.9) +theme_bw(base_size = 20) +ylab("Spike-in Scalling Factor") +xlab("")normDepth = inner_join(scaleFactor, alignResult, by = c("Histone", "Replicate")) %>% mutate(normDepth = MappedFragNum_hg38 * scaleFactor)fig6B = normDepth %>% ggplot(aes(x = Histone, y = normDepth, fill = Histone)) +geom_boxplot() +geom_jitter(aes(color = Replicate), position = position_jitter(0.15)) +scale_fill_viridis(discrete = TRUE, begin = 0.1, end = 0.9, option = "magma", alpha = 0.8) +scale_color_viridis(discrete = TRUE, begin = 0.1, end = 0.9) +theme_bw(base_size = 20) +ylab("Normalization Fragment Count") +xlab("") + coord_cartesian(ylim = c(1000000, 130000000))
ggarrange(fig6A, fig6B, ncol = 2, common.legend = TRUE, legend="bottom")
七. Peak calling
#!/bin/bash
projPath=~/my_project/PRJNA606273
mkdir -p $projPath/peakCalling/SEACR
seacr="$projPath/SEACR_1.3.sh"
ls *bowtie2.sam|while read histName; do histName=${histName/_bowtie2.sam/} #将字符串 id 中的_bowtie2.sam 部分替换为空字符串,即将_bowtie2.sam删除
histControl=IgG_rep1bash $seacr $projPath/alignment/bedgraph/${histName}_bowtie2.fragments.normalized.bedgraph \$projPath/alignment/bedgraph/${histControl}_bowtie2.fragments.normalized.bedgraph \non stringent $projPath/peakCalling/SEACR/${histName}_seacr_control.peaksbash $seacr $projPath/alignment/bedgraph/${histName}_bowtie2.fragments.normalized.bedgraph 0.01 non stringent $projPath/peakCalling/SEACR/${histName}_seacr_top0.01.peaks
done
1.Number of peaks called
##=== R command ===##
peakN = c()
peakWidth = c()
peakType = c("control", "top0.01")
for(hist in sampleList){histInfo = strsplit(hist, "_")[[1]]if(histInfo[1] != "IgG"){for(type in peakType){peakInfo = read.table(paste0(projPath, "/peakCalling/SEACR/", hist, "_seacr_", type, ".peaks.stringent.bed"), header = FALSE, fill = TRUE)  %>% mutate(width = abs(V3-V2))peakN = data.frame(peakN = nrow(peakInfo), peakType = type, Histone = histInfo[1], Replicate = histInfo[2]) %>% rbind(peakN, .)peakWidth = data.frame(width = peakInfo$width, peakType = type, Histone = histInfo[1], Replicate = histInfo[2])  %>% rbind(peakWidth, .)}}
}
peakN %>% select(Histone, Replicate, peakType, peakN)
IgG_rep1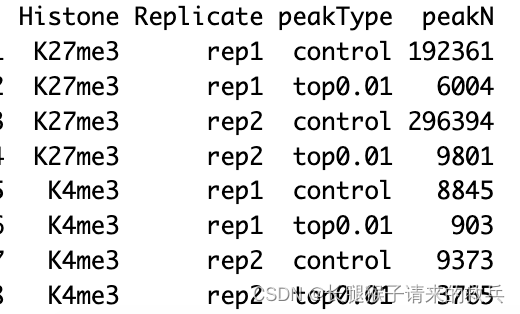
IgG_rep2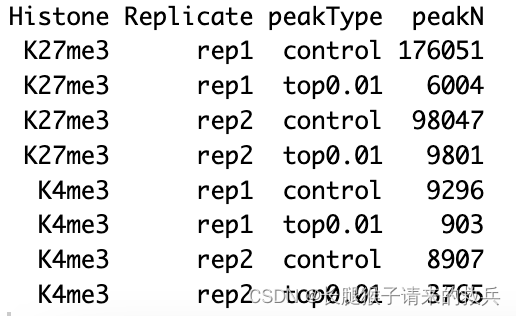
2.Reproducibility of the peak across biological replicates
##=== R command ===##
histL = c("K27me3", "K4me3")
repL = paste0("rep", 1:2)
peakType = c("control", "top0.01")
peakOverlap = c()
for(type in peakType){for(hist in histL){overlap.gr = GRanges()for(rep in repL){peakInfo = read.table(paste0(projPath, "/peakCalling/SEACR/", hist, "_", rep, "_seacr_", type, ".peaks.stringent.bed"), header = FALSE, fill = TRUE)peakInfo.gr = GRanges(peakInfo$V1, IRanges(start = peakInfo$V2, end = peakInfo$V3), strand = "*")if(length(overlap.gr) >0){overlap.gr = overlap.gr[findOverlaps(overlap.gr, peakInfo.gr)@from]}else{overlap.gr = peakInfo.gr}}peakOverlap = data.frame(peakReprod = length(overlap.gr), Histone = hist, peakType = type) %>% rbind(peakOverlap, .)}
}peakReprod = left_join(peakN, peakOverlap, by = c("Histone", "peakType")) %>% mutate(peakReprodRate = peakReprod/peakN * 100)
peakReprod %>% select(Histone, Replicate, peakType, peakN, peakReprodNum = peakReprod, peakReprodRate)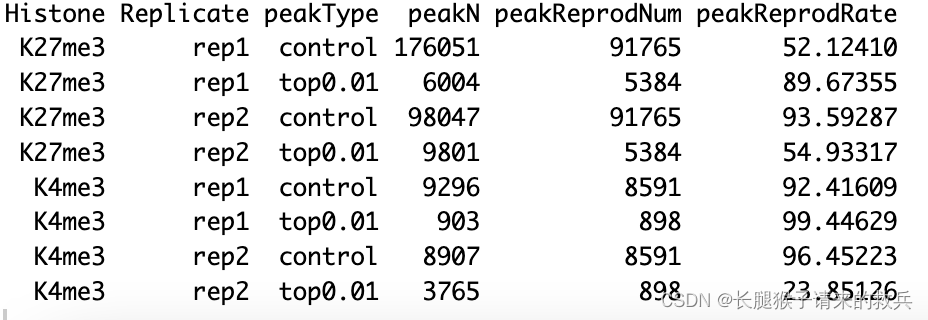
3.FRagment proportion in Peaks regions (FRiPs)
##=== R command ===##
library(chromVAR)bamDir = paste0(projPath, "/alignment/bam")
inPeakData = c()
## overlap with bam file to get count
for(hist in histL){for(rep in repL){peakRes = read.table(paste0(projPath, "/peakCalling/SEACR/", hist, "_", rep, "_seacr_control.peaks.stringent.bed"), header = FALSE, fill = TRUE)peak.gr = GRanges(seqnames = peakRes$V1, IRanges(start = peakRes$V2, end = peakRes$V3), strand = "*")bamFile = paste0(bamDir, "/", hist, "_", rep, "_bowtie2.mapped.bam")fragment_counts <- getCounts(bamFile, peak.gr, paired = TRUE, by_rg = FALSE, format = "bam")inPeakN = counts(fragment_counts)[,1] %>% suminPeakData = rbind(inPeakData, data.frame(inPeakN = inPeakN, Histone = hist, Replicate = rep))}
}frip = left_join(inPeakData, alignResult, by = c("Histone", "Replicate")) %>% mutate(frip = inPeakN/MappedFragNum_hg38 * 100)
frip %>% select(Histone, Replicate, SequencingDepth, MappedFragNum_hg38, AlignmentRate_hg38, FragInPeakNum = inPeakN, FRiPs = frip)

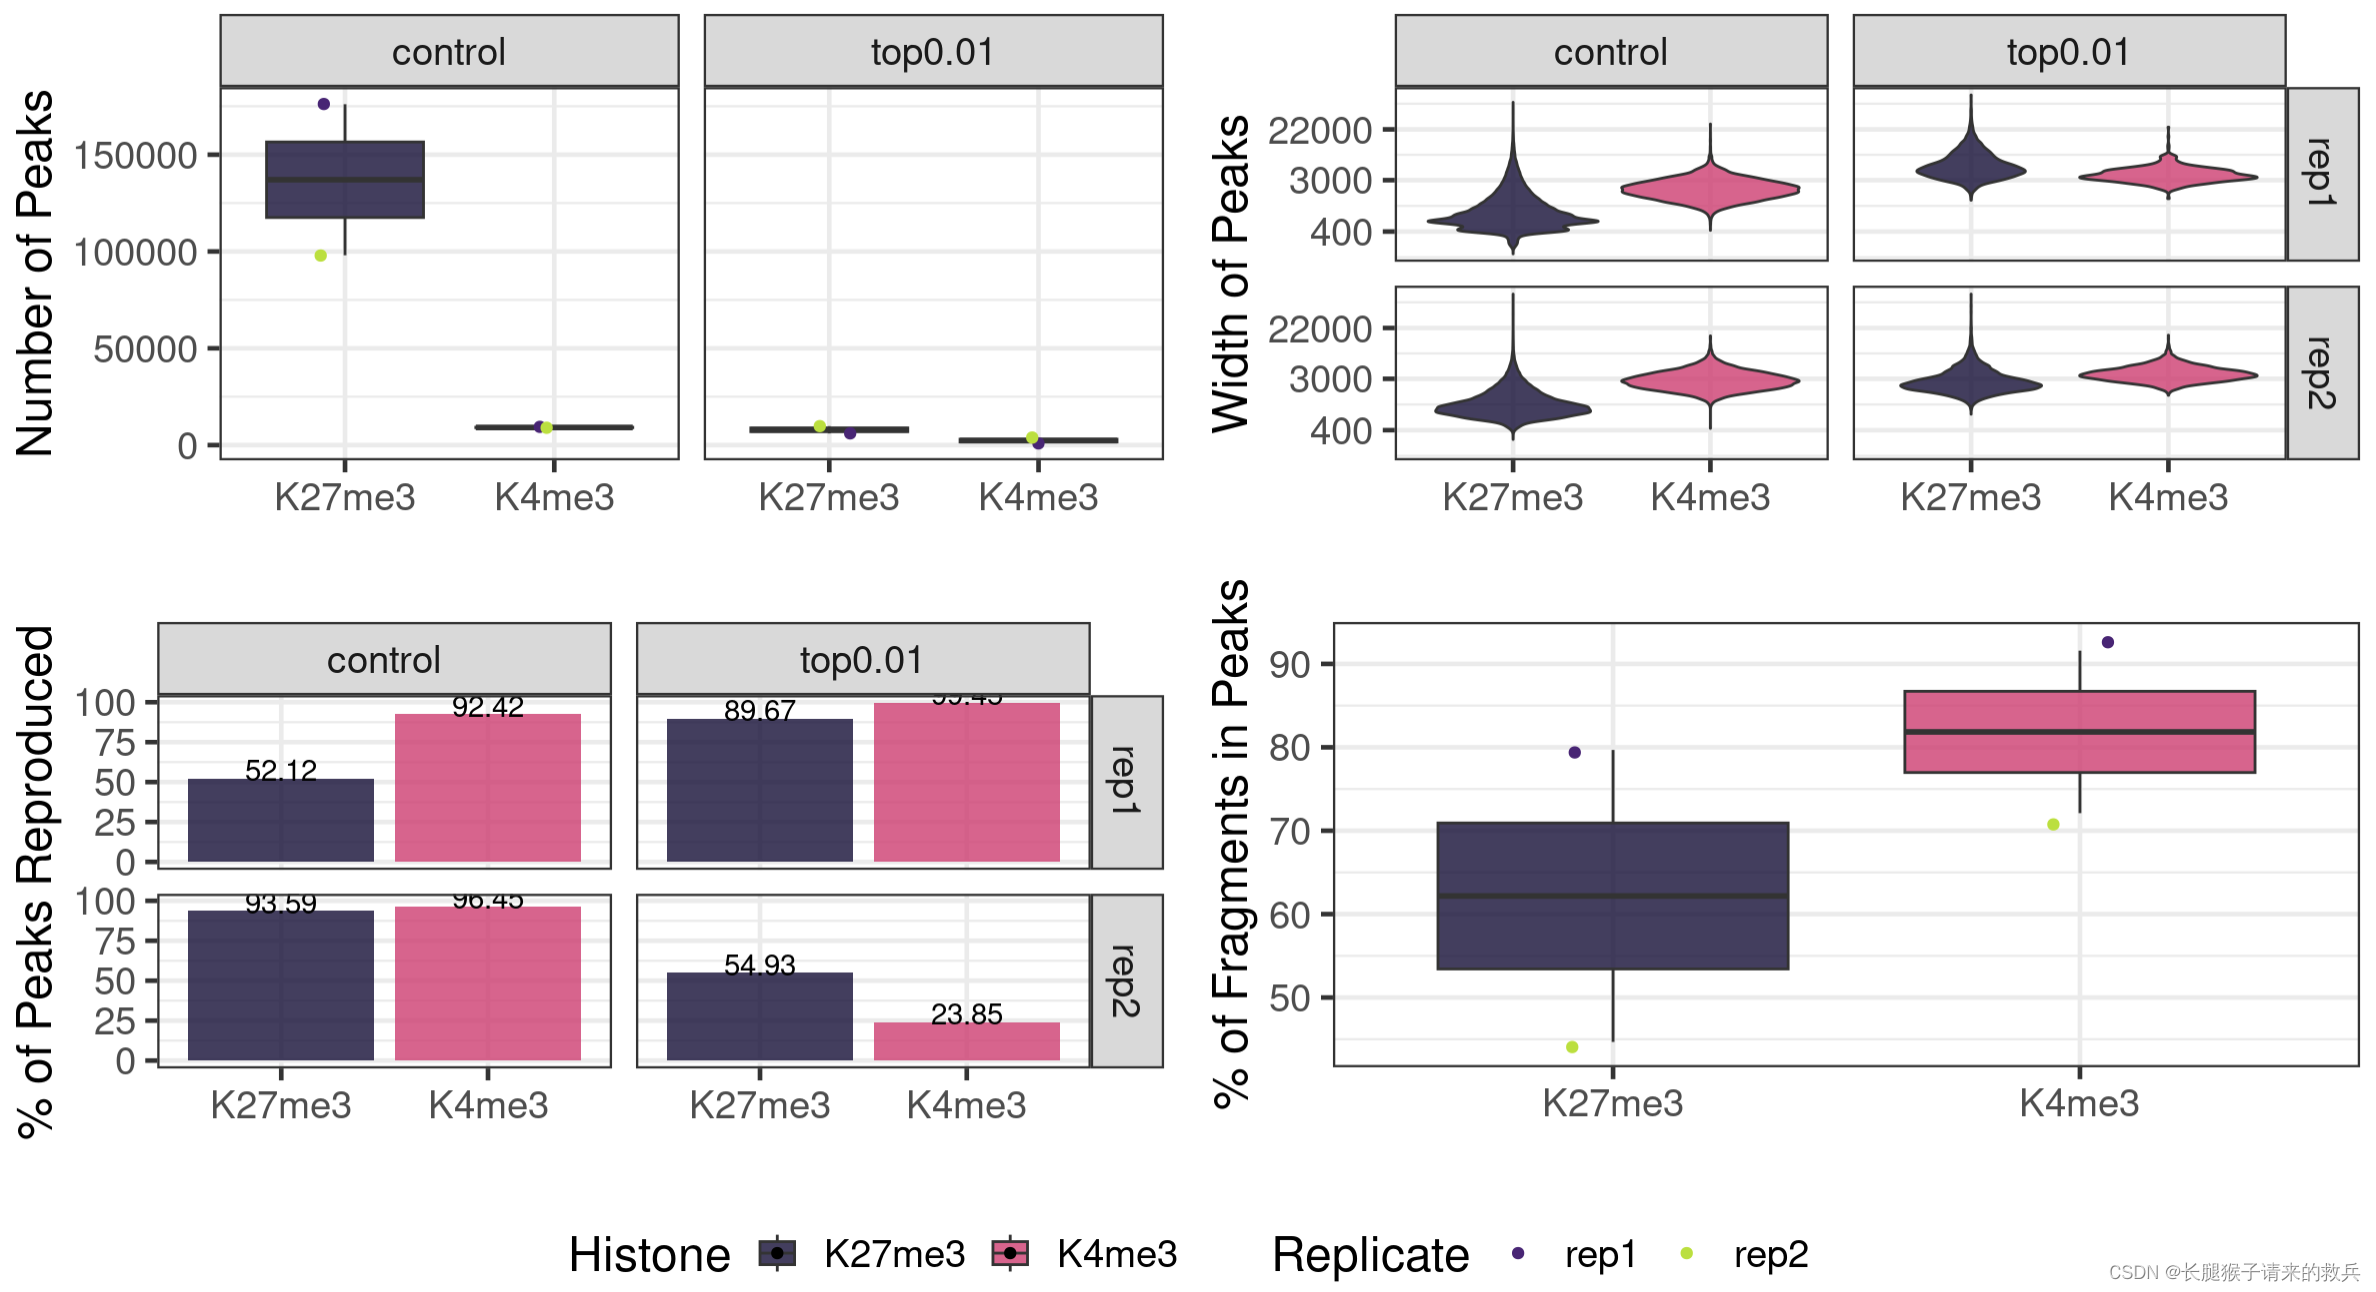
4.Visualization of peak number, peak width, peak reproducibility and FRiPs
fig7A = peakN %>% ggplot(aes(x = Histone, y = peakN, fill = Histone)) +geom_boxplot() +geom_jitter(aes(color = Replicate), position = position_jitter(0.15)) +facet_grid(~peakType) +scale_fill_viridis(discrete = TRUE, begin = 0.1, end = 0.55, option = "magma", alpha = 0.8) +scale_color_viridis(discrete = TRUE, begin = 0.1, end = 0.9) +theme_bw(base_size = 18) +ylab("Number of Peaks") +xlab("")fig7B = peakWidth %>% ggplot(aes(x = Histone, y = width, fill = Histone)) +geom_violin() +facet_grid(Replicate~peakType) +scale_fill_viridis(discrete = TRUE, begin = 0.1, end = 0.55, option = "magma", alpha = 0.8) +scale_color_viridis(discrete = TRUE, begin = 0.1, end = 0.9) +scale_y_continuous(trans = "log", breaks = c(400, 3000, 22000)) +theme_bw(base_size = 18) +ylab("Width of Peaks") +xlab("")fig7C = peakReprod %>% ggplot(aes(x = Histone, y = peakReprodRate, fill = Histone, label = round(peakReprodRate, 2))) +geom_bar(stat = "identity") +geom_text(vjust = 0.1) +facet_grid(Replicate~peakType) +scale_fill_viridis(discrete = TRUE, begin = 0.1, end = 0.55, option = "magma", alpha = 0.8) +scale_color_viridis(discrete = TRUE, begin = 0.1, end = 0.9) +theme_bw(base_size = 18) +ylab("% of Peaks Reproduced") +xlab("")fig7D = frip %>% ggplot(aes(x = Histone, y = frip, fill = Histone, label = round(frip, 2))) +geom_boxplot() +geom_jitter(aes(color = Replicate), position = position_jitter(0.15)) +scale_fill_viridis(discrete = TRUE, begin = 0.1, end = 0.55, option = "magma", alpha = 0.8) +scale_color_viridis(discrete = TRUE, begin = 0.1, end = 0.9) +theme_bw(base_size = 18) +ylab("% of Fragments in Peaks") +xlab("")ggarrange(fig7A, fig7B, fig7C, fig7D, ncol = 2, nrow=2, common.legend = TRUE, legend="bottom")
八.Visualization
1.Heatmap over transcription units
#!/bin/bash
projPath=~/my_project/PRJNA606273
mkdir -p $projPath/alignment/bigwig
ls *bowtie2.sam|while read histName; do histName=${histName/_bowtie2.sam/} #将字符串 id 中的_bowtie2.sam 部分替换为空字符串,即将_bowtie2.sam删除
samtools sort -o $projPath/alignment/bam/${histName}.sorted.bam $projPath/alignment/bam/${histName}_bowtie2.mapped.bam
samtools index $projPath/alignment/bam/${histName}.sorted.bam
bamCoverage -b $projPath/alignment/bam/${histName}.sorted.bam -o $projPath/alignment/bigwig/${histName}_raw.bw
cores=8
computeMatrix scale-regions -S $projPath/alignment/bigwig/K27me3_rep1_raw.bw \$projPath/alignment/bigwig/K27me3_rep2_raw.bw \$projPath/alignment/bigwig/K4me3_rep1_raw.bw \$projPath/alignment/bigwig/K4me3_rep2_raw.bw \-R $projPath/hg38_gene \--beforeRegionStartLength 3000 \--regionBodyLength 5000 \--afterRegionStartLength 3000 \--skipZeros -o $projPath/hg38_heatmap/matrix_gene.mat.gz -p $coresplotHeatmap -m $projPath/hg38_heatmap/matrix_gene.mat.gz -out $projPath/hg38_heatmap/Histone_gene.png --sortUsing sum
done
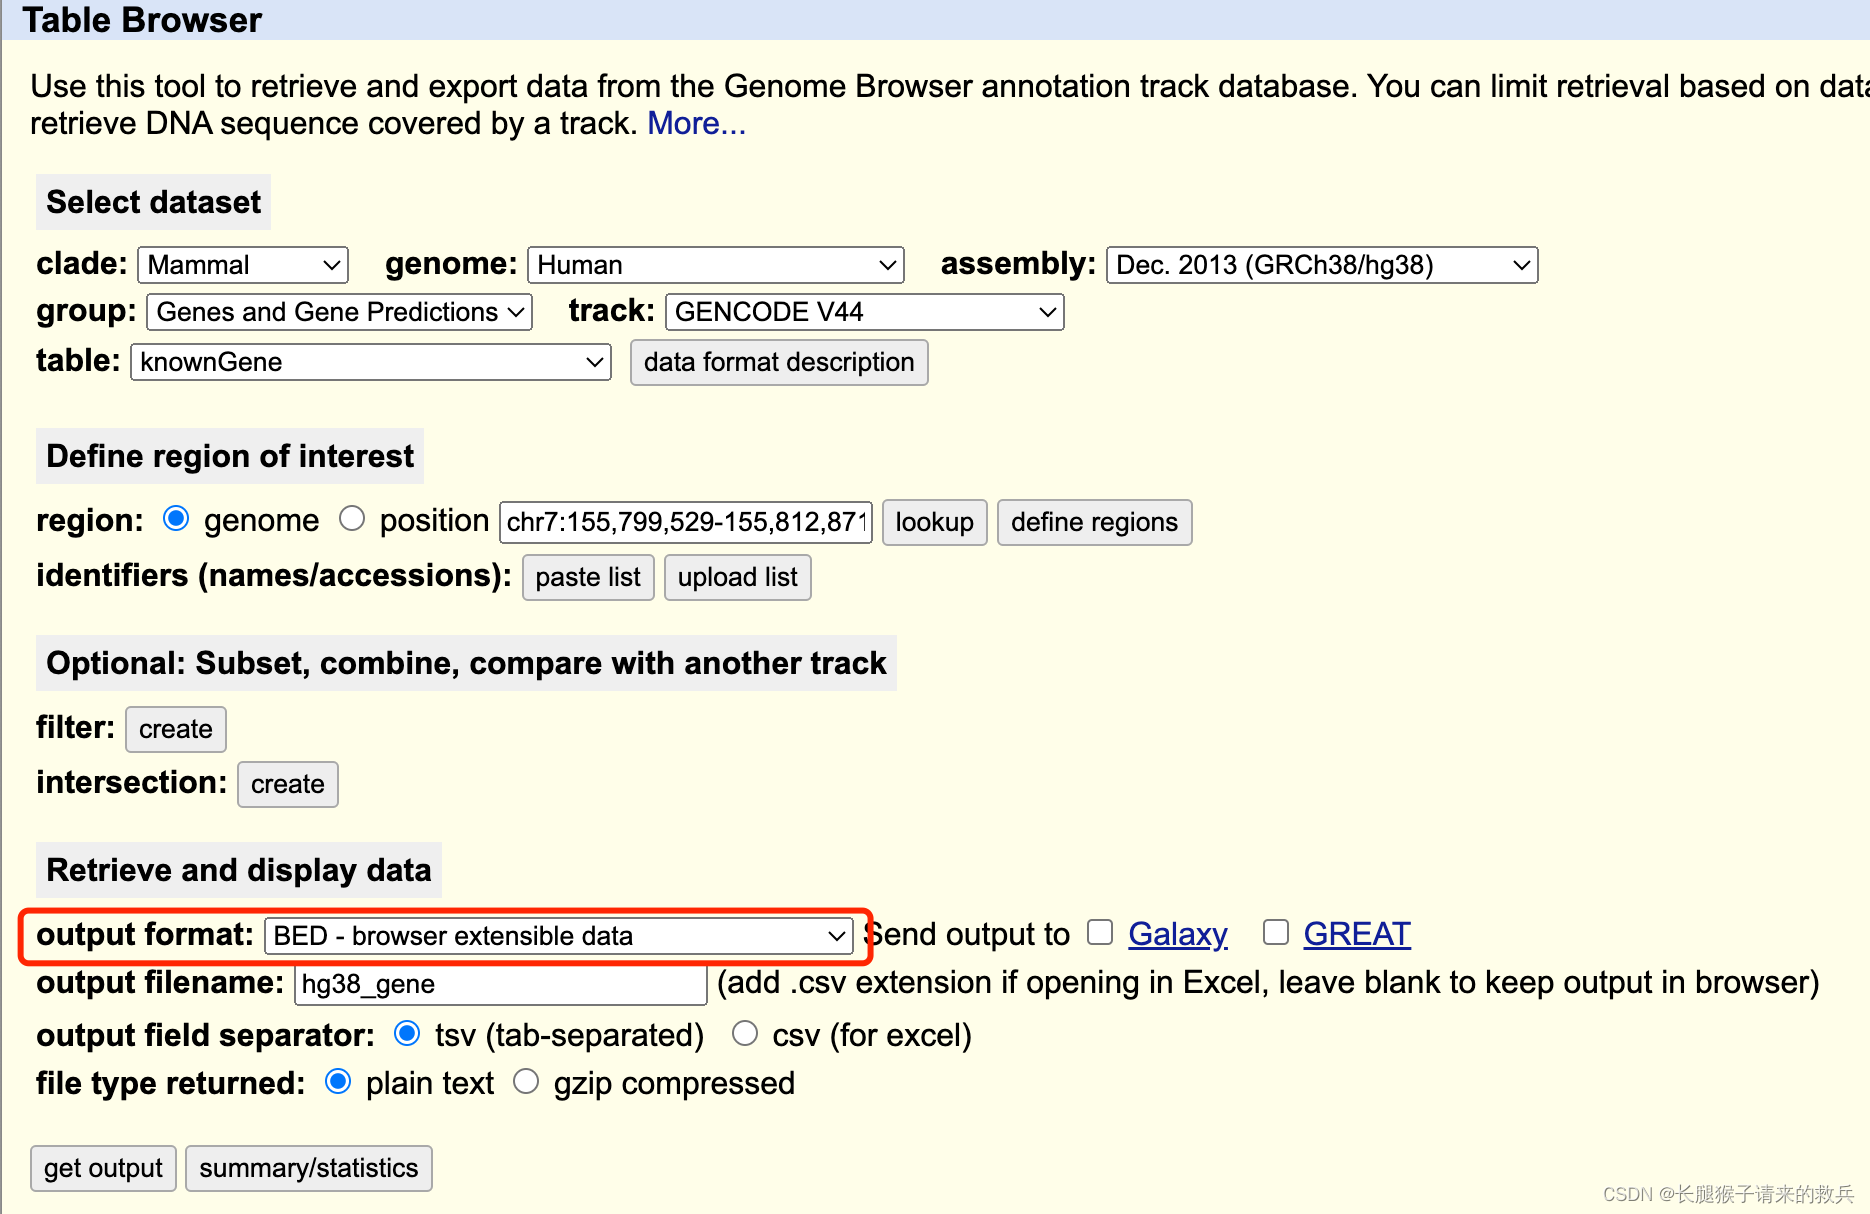
hg38_gene获取:
https://genome.ucsc.edu/cgi-bin/hgTables
output format改为BED,其他不变
跑出了一个奇奇怪怪的图,怎么那么多黑线啊

2.Heatmap on CUT&Tag peaks
#!/bin/bash
projPath=~/my_project/PRJNA606273
for histName in K27me3 K4me3
dofor repName in rep1 rep1 rep2doawk '{split($6, summit, ":"); split(summit[2], region, "-"); print summit[1]"\t"region[1]"\t"region[2]}' $projPath/peakCalling/SEACR/${histName}_${repName}_seacr_control.peaks.stringent.bed >$projPath/peakCalling/SEACR/${histName}_${repName}_seacr_control.peaks.summitRegion.bedcomputeMatrix reference-point -S $projPath/alignment/bigwig/${histName}_${repName}_raw.bw \-R $projPath/peakCalling/SEACR/${histName}_${repName}_seacr_control.peaks.summitRegion.bed \--skipZeros -o $projPath/peakCalling/SEACR/${histName}_${repName}_SEACR.mat.gz -p 8 -a 3000 -b 3000 --referencePoint centerplotHeatmap -m $projPath/peakCalling/SEACR/${histName}_${repName}_SEACR.mat.gz -out $projPath/peakCalling/SEACR/${histName}_${repName}_SEACR_heatmap.png --sortUsing sum --startLabel "Peak Start" --endLabel "Peak End" --xAxisLabel "" --regionsLabel "Peaks" --samplesLabel "${histName} ${repName}"done
done

九. Differential analysis
- Create a master peak list merging all the peaks called for each sample
##=== R command ===##
mPeak = GRanges()
## overlap with bam file to get count
for(hist in histL){for(rep in repL){peakRes = read.table(paste0(projPath, "/peakCalling/SEACR/", hist, "_", rep, "_seacr_control.peaks.stringent.bed"), header = FALSE, fill = TRUE)mPeak = GRanges(seqnames = peakRes$V1, IRanges(start = peakRes$V2, end = peakRes$V3), strand = "*") %>% append(mPeak, .)}
}
masterPeak = reduce(mPeak)
- Get the fragment counts for each peak in the master peak list
##=== R command ===##
library(DESeq2)
bamDir = paste0(projPath, "/alignment/bam")
countMat = matrix(NA, length(masterPeak), length(histL)*length(repL))
## overlap with bam file to get count
i = 1
for(hist in histL){for(rep in repL){bamFile = paste0(bamDir, "/", hist, "_", rep, "_bowtie2.mapped.bam")fragment_counts <- getCounts(bamFile, masterPeak, paired = TRUE, by_rg = FALSE, format = "bam")countMat[, i] = counts(fragment_counts)[,1]i = i + 1}
}
colnames(countMat) = paste(rep(histL, 2), rep(repL, each = 2), sep = "_")- Sequencing depth normalization and differential enriched peaks detection
##=== R command ===##
selectR = which(rowSums(countMat) > 5) ## remove low count genes
dataS = countMat[selectR,]
condition = factor(rep(histL, each = length(repL)))
dds = DESeqDataSetFromMatrix(countData = dataS,colData = DataFrame(condition),design = ~ condition)
DDS = DESeq(dds)
normDDS = counts(DDS, normalized = TRUE) ## normalization with respect to the sequencing depth
colnames(normDDS) = paste0(colnames(normDDS), "_norm")
res = results(DDS, independentFiltering = FALSE, altHypothesis = "greaterAbs")countMatDiff = cbind(dataS, normDDS, res)
head(countMatDiff)
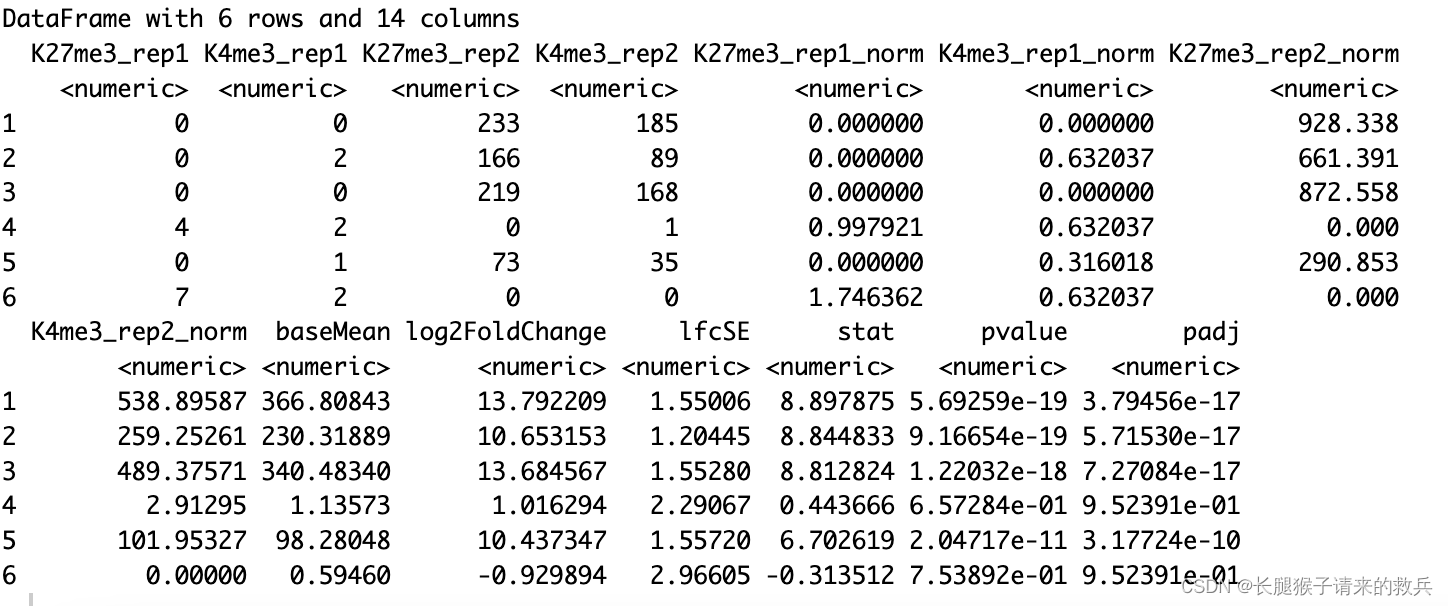
总算是跑完一轮没有报错了,但是结果有一些差异,还不清楚原因是什么,后面再看看是啥问题吧
长腿猴子请来的救兵写于2024.5.13

