目录
- 前置工作
- 用户组(按需创建)
- Grafana
- Loki
- Loki 配置文件
- Promtail
- 配置文件
- 配置数据源
- 创建仪表盘
- 添加查询项
前置工作
- Centos 7
- 关闭防火墙 (systemctl stop firewalld)
- 独立的用户组(可以不创建)
用户组(按需创建)
# 创建用户组
groupadd grafana
# 新建一个家目录为`/home/grafana`,用户组为`grafana`,用户名为`grafana`的用户
useradd -d /home/grafana -g grafana grafana
# 切换用户
su - grafana
# 创建软件目录及按安装包目录
mkdir -p software
mkdir -p packages
Grafana
# 切换目录
cd packages
# 下载grafana
wget https://dl.grafana.com/enterprise/release/grafana-enterprise-11.1.0.linux-amd64.tar.gz
# 解压
tar -zxf grafana-enterprise-11.1.0.linux-amd64.tar.gz
# 移动目录
mv grafana-v11.1.0 ../software
# 切换目录
cd ../software/grafana-v11.1.0
# 启动服务(访问地址: http://ip:3000,默认用户名及密码:admin/admin),若出现无法访问,请检查防火墙状态是否为关闭的状态
./bin/grafana server
Loki
# 下载地址:https://github.com/grafana/loki/releases,请根据当前系统版本下载相应的文件,并将下载的文件放到packages目录中
# 解压并移动目录
unzip loki-linux-amd64.zip -d ../software/loki
# 创建loki配置文件
touch ../software/loki/loki.yaml
# 启动loki服务(-config.file 指定配置文件位置)
./loki-linux-amd64 -config.file=loki.yaml
Loki 配置文件
auth_enabled: falseserver:http_listen_port: 3100 # 服务http监听端口grpc_listen_port: 9096 # 服务grpc监听端口common:instance_addr: 127.0.0.1path_prefix: /tmp/lokistorage:filesystem:chunks_directory: /tmp/loki/chunksrules_directory: /tmp/loki/rulesreplication_factor: 1ring:kvstore:store: inmemoryquery_range:results_cache:cache:embedded_cache:enabled: truemax_size_mb: 100schema_config:configs:- from: 2020-10-24store: tsdbobject_store: filesystemschema: v13index:prefix: index_period: 24hruler:alertmanager_url: http://localhost:9093# By default, Loki will send anonymous, but uniquely-identifiable usage and configuration
# analytics to Grafana Labs. These statistics are sent to https://stats.grafana.org/
#
# Statistics help us better understand how Loki is used, and they show us performance
# levels for most users. This helps us prioritize features and documentation.
# For more information on what's sent, look at
# https://github.com/grafana/loki/blob/main/pkg/analytics/stats.go
# Refer to the buildReport method to see what goes into a report.
#
# If you would like to disable reporting, uncomment the following lines:
#analytics:
#  reporting_enabled: false
Promtail
# 下载地址:https://github.com/grafana/loki/releases,请根据当前系统版本下载相应的文件,并将下载的文件放到packages目录中
# 解压并移动目录
unzip promtail-linux-amd64.zip -d ../software/promtail
# 创建promtail配置文件
touch ../software/promtail/promtail.yaml
# 启动Promtail服务
./promtail-linux-amd64 -config.file=promtail.yaml  -config.expand-env=true
配置文件
Promtail.yaml ,详细配置参考官方文档:https://grafana.com/docs/loki/latest/send-data/promtail/configuration/
server:http_listen_port: 9080grpc_listen_port: 0positions:filename: /home/grafana/software/promtail/pos/positions.yamlsync_period: 10clients:- url: http://192.168.200.128:3100/loki/api/v1/push # 这里需要修改为loki服务的ip地址scrape_configs:- job_name: test_1 # 任务名称(可以通过job_name字段区分项目)static_configs:- targets:- localhostlabels: # 可以自定义标签,比如主机ip,项目名称,项目环境等等ip: 192.168.200.128name: test_1env: test__path__: /home/grafana/logs/test_1.log # 日志路径pipeline_stages:- json:expressions:log_level: levelmsg: msgtimestamp: tsuuid: uuidrequest_data: request_data{"level":"info","ts":"2024-07-04T22:53:26+08:00","msg":"用户查询函数","uuid":"2613d4a4-719e-488e-80c5-a18076ed041f","request_data":"map[]"}
{"level":"info","ts":"2024-07-04T22:53:26+08:00","msg":"用户查询成功","uuid":"2613d4a4-719e-488e-80c5-a18076ed041f"}
{"level":"info","ts":"2024-07-04T22:57:28+08:00","msg":"用户查询函数","uuid":"7887f8bf-8c29-407c-8534-d16ac9e779de","request_data":"map[page:1 pageSize:10]"}
{"level":"error","ts":"2024-07-04T22:57:28+08:00","msg":"用户查询失败","uuid":"7887f8bf-8c29-407c-8534-d16ac9e779de"}
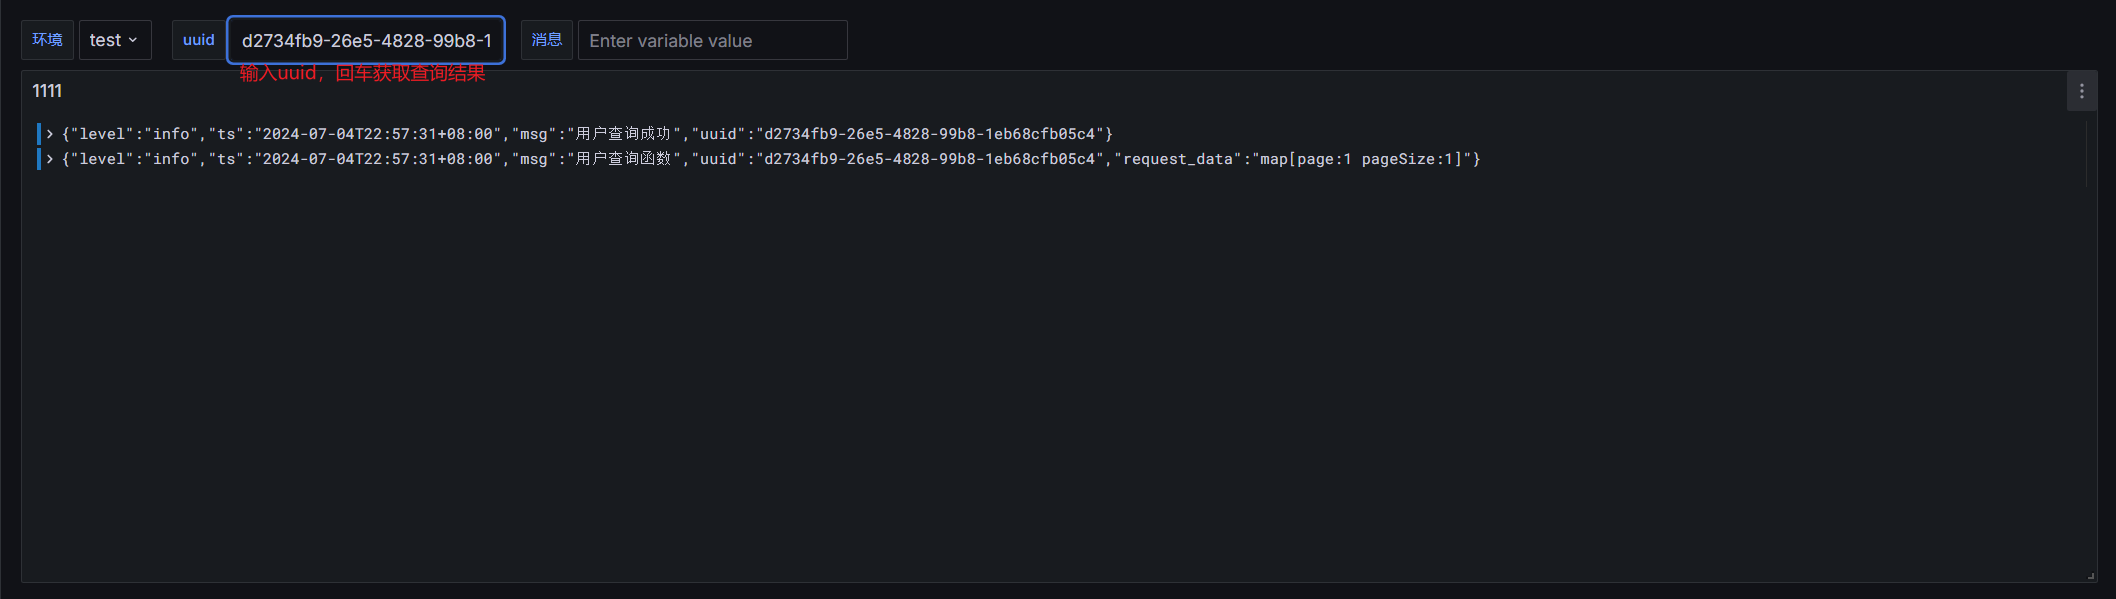
{"level":"info","ts":"2024-07-04T22:57:31+08:00","msg":"用户查询函数","uuid":"d2734fb9-26e5-4828-99b8-1eb68cfb05c4","request_data":"map[page:1 pageSize:1]"}
{"level":"info","ts":"2024-07-04T22:57:31+08:00","msg":"用户查询成功","uuid":"d2734fb9-26e5-4828-99b8-1eb68cfb05c4"}
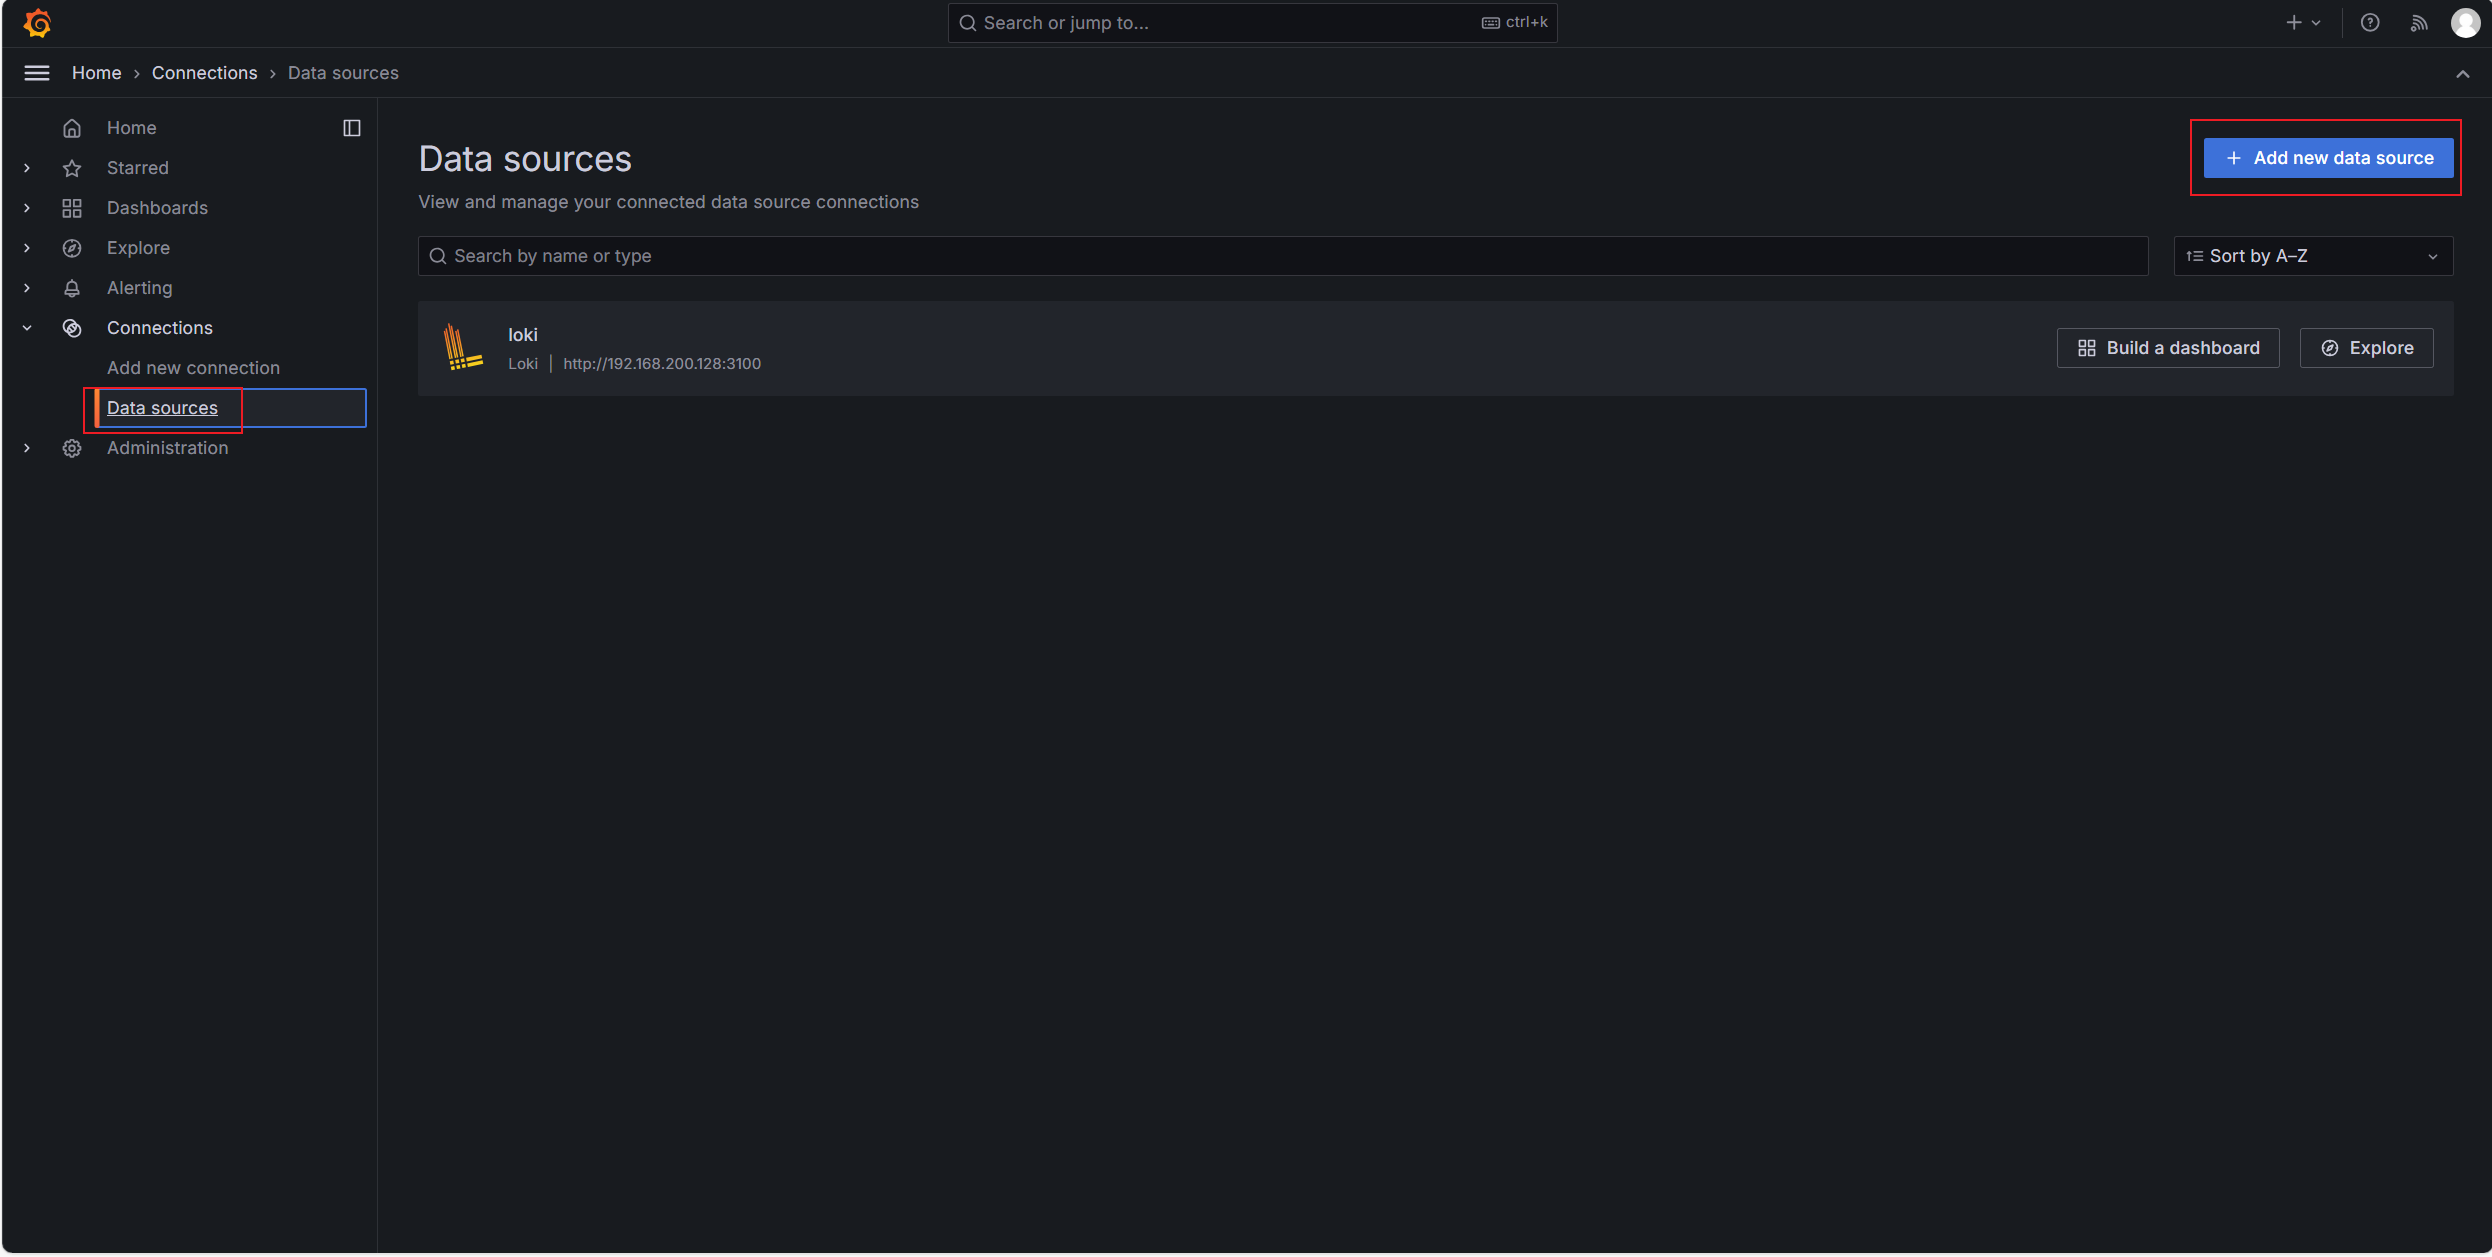
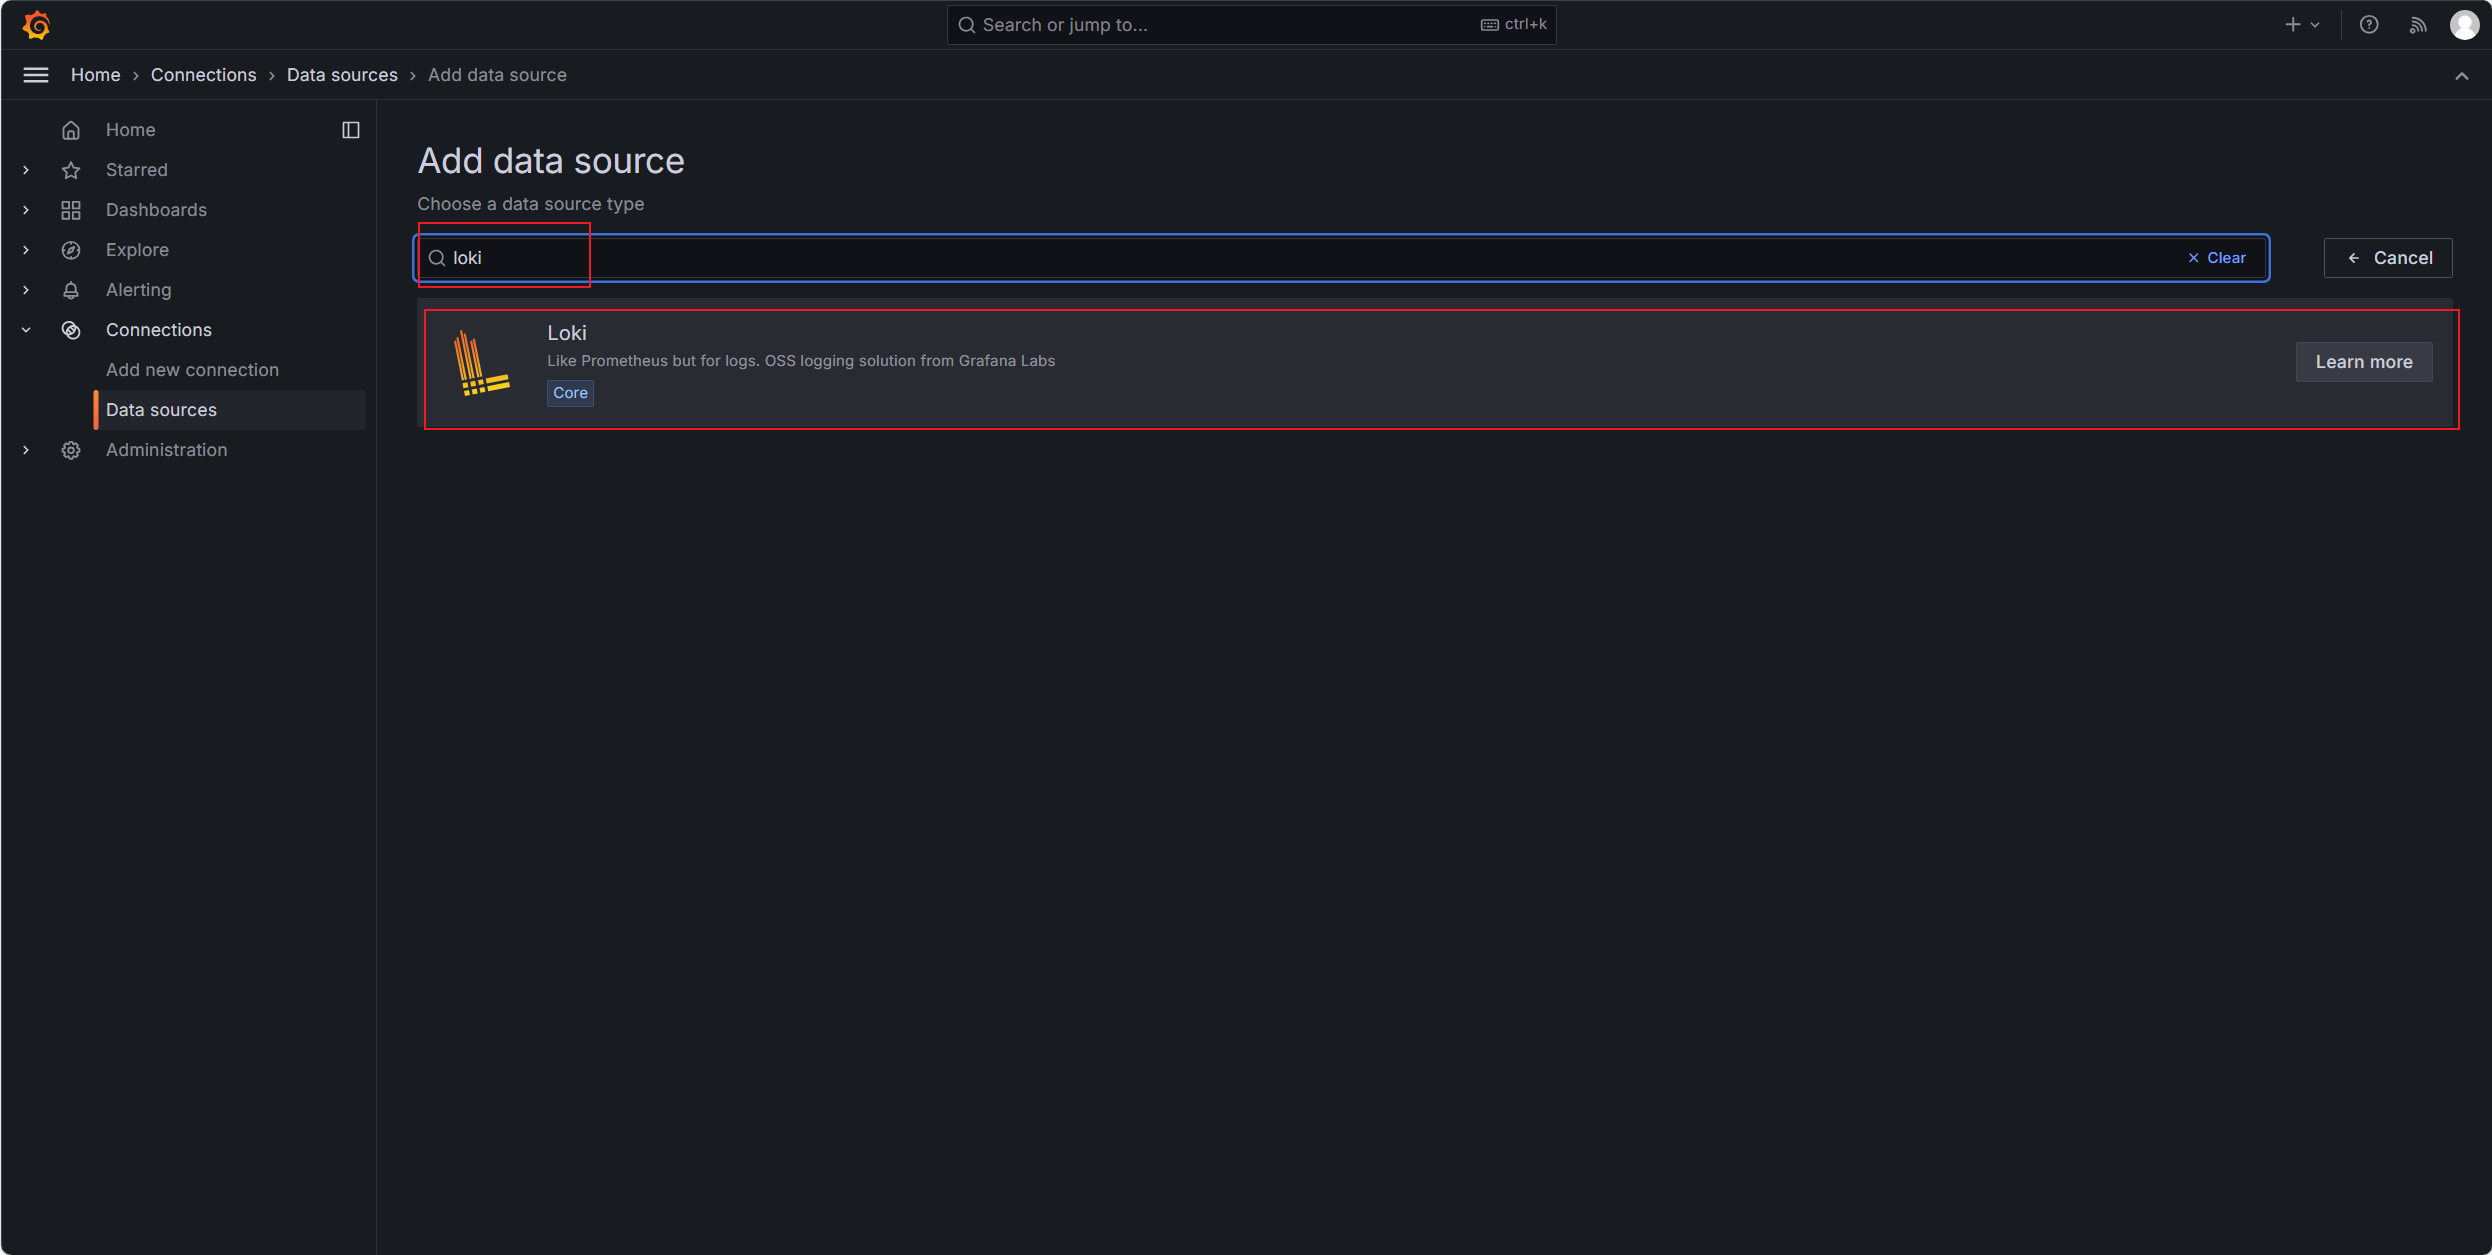
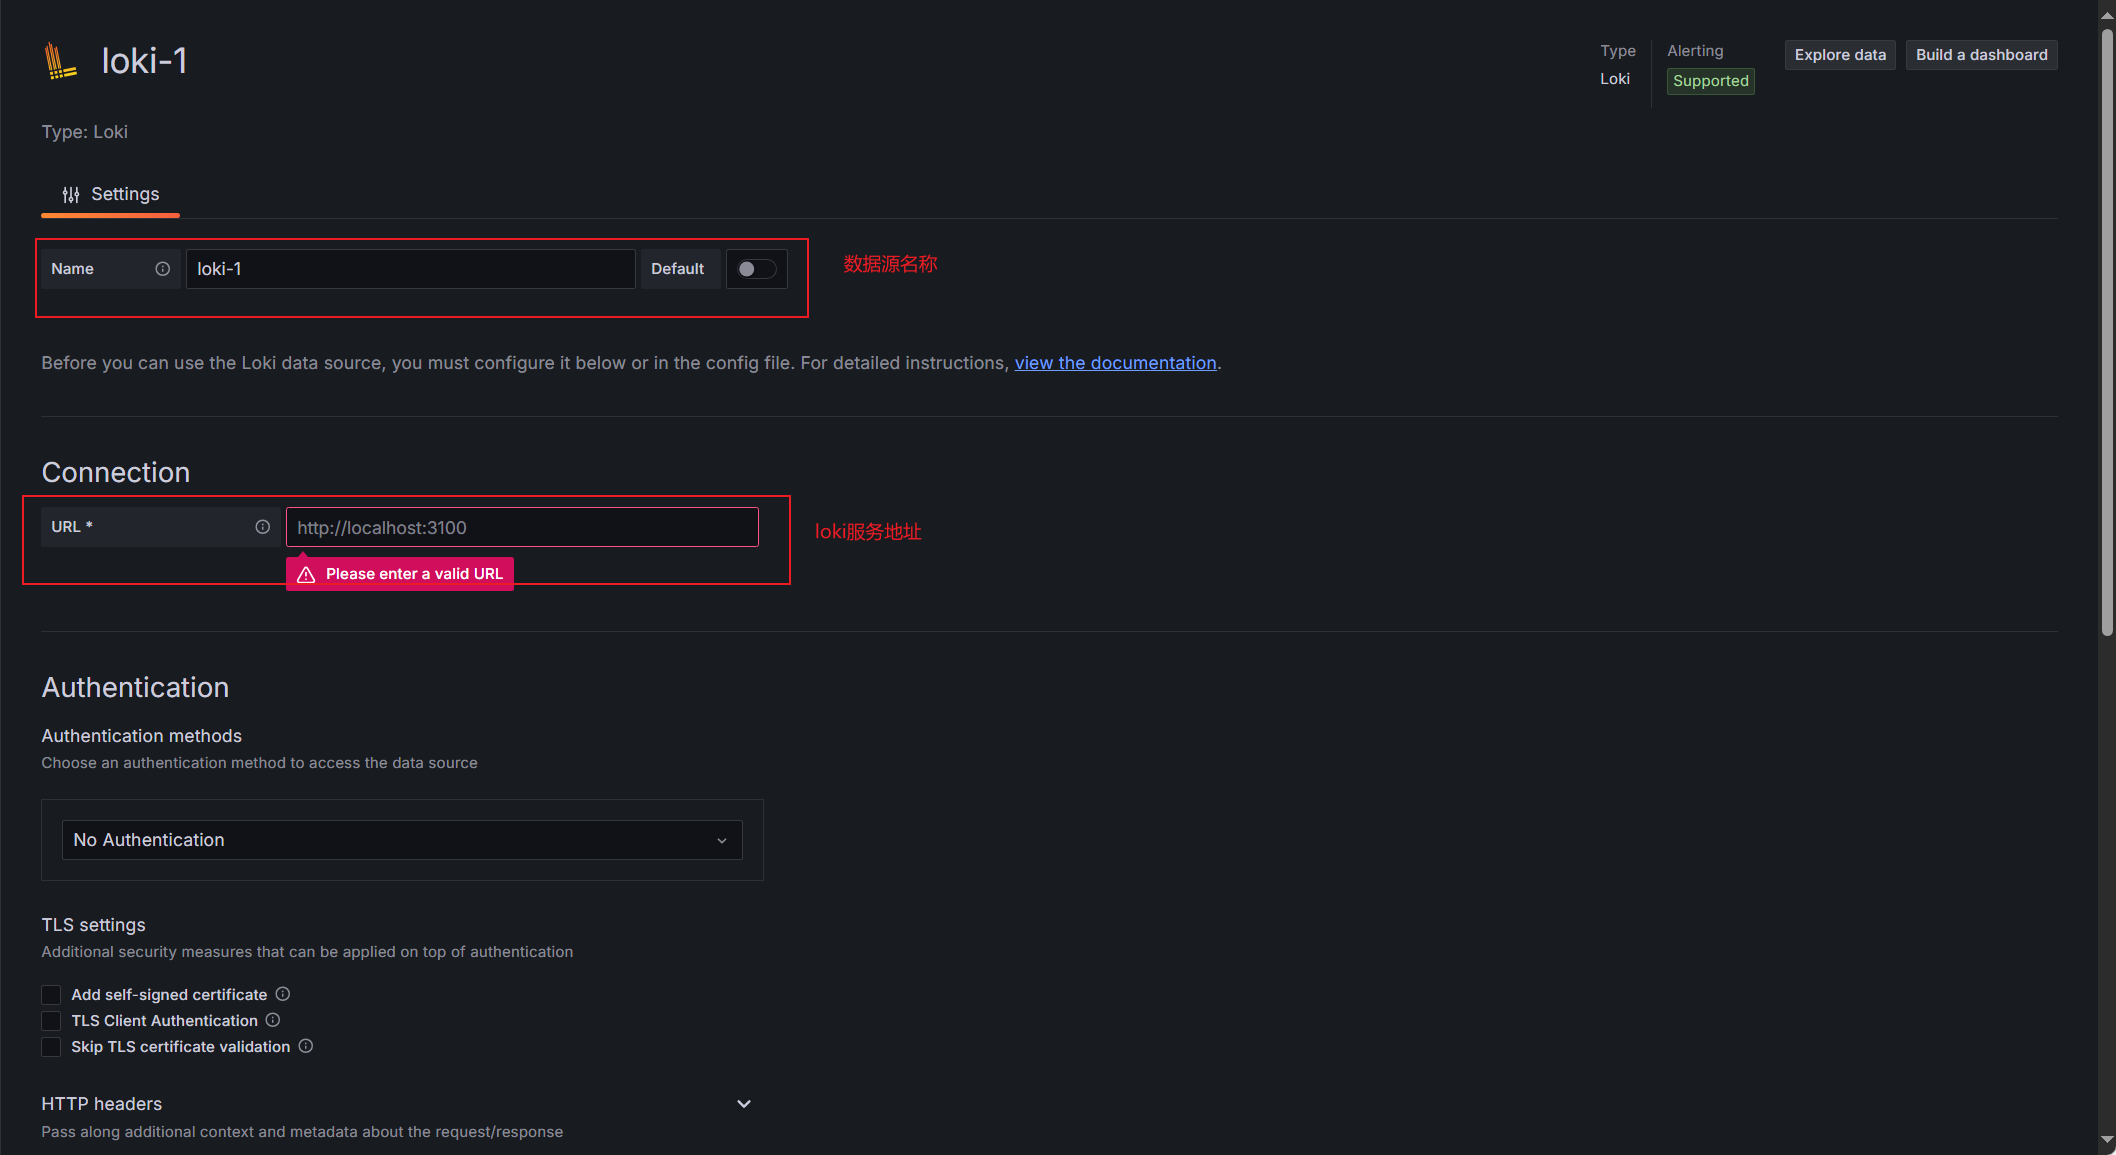
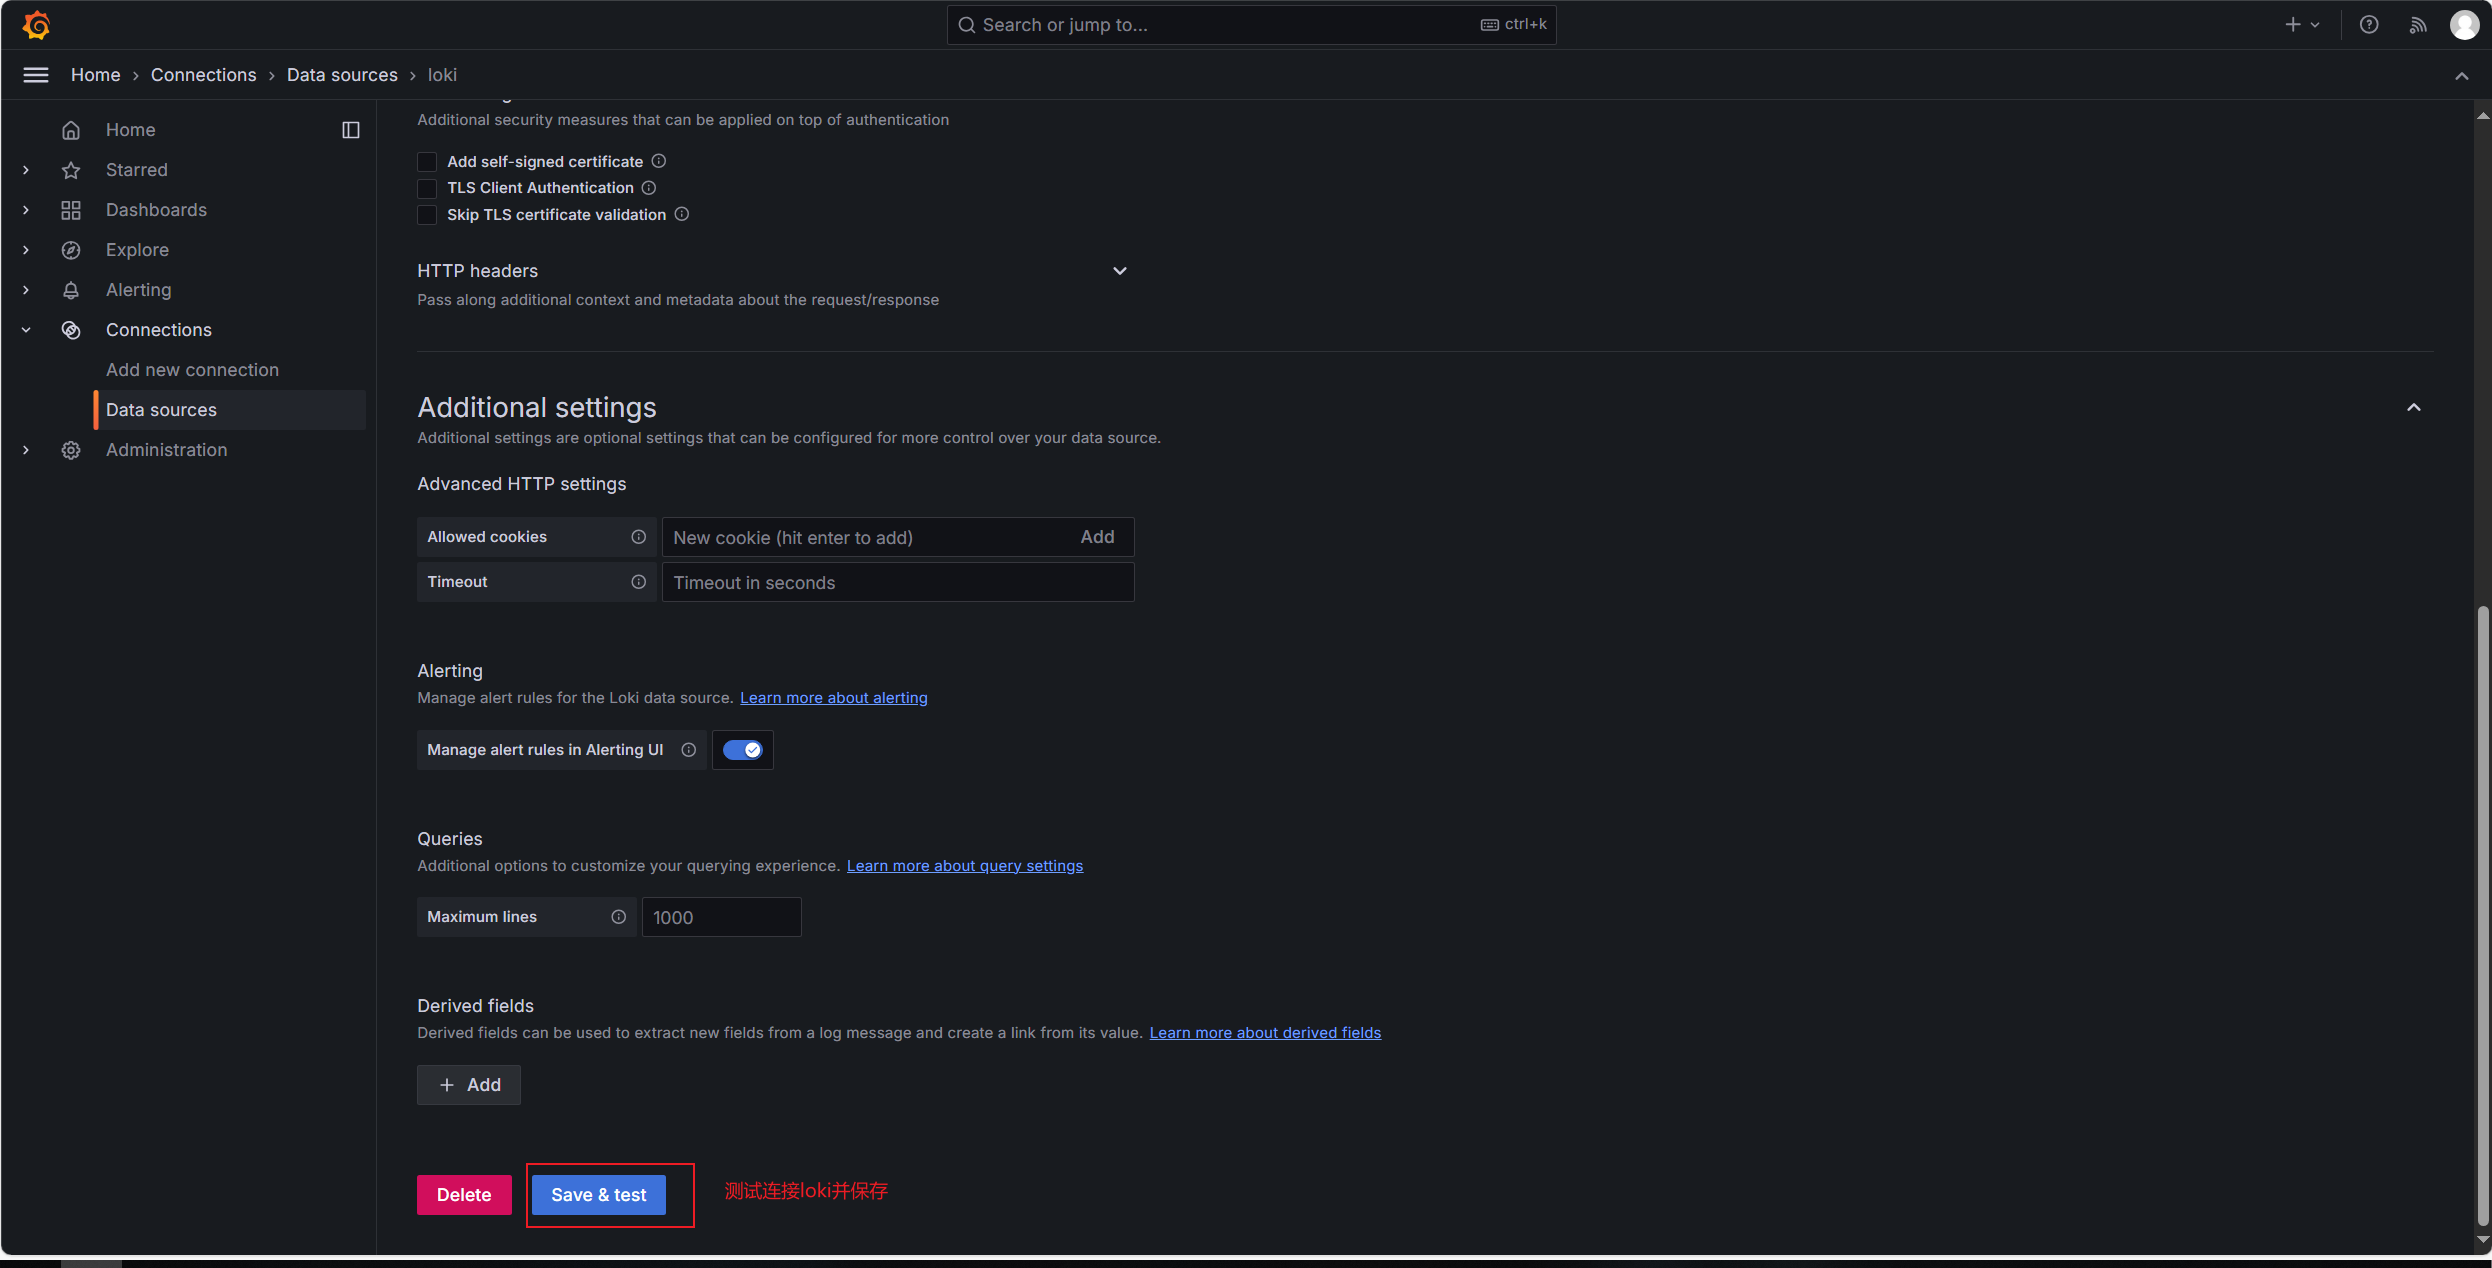
配置数据源
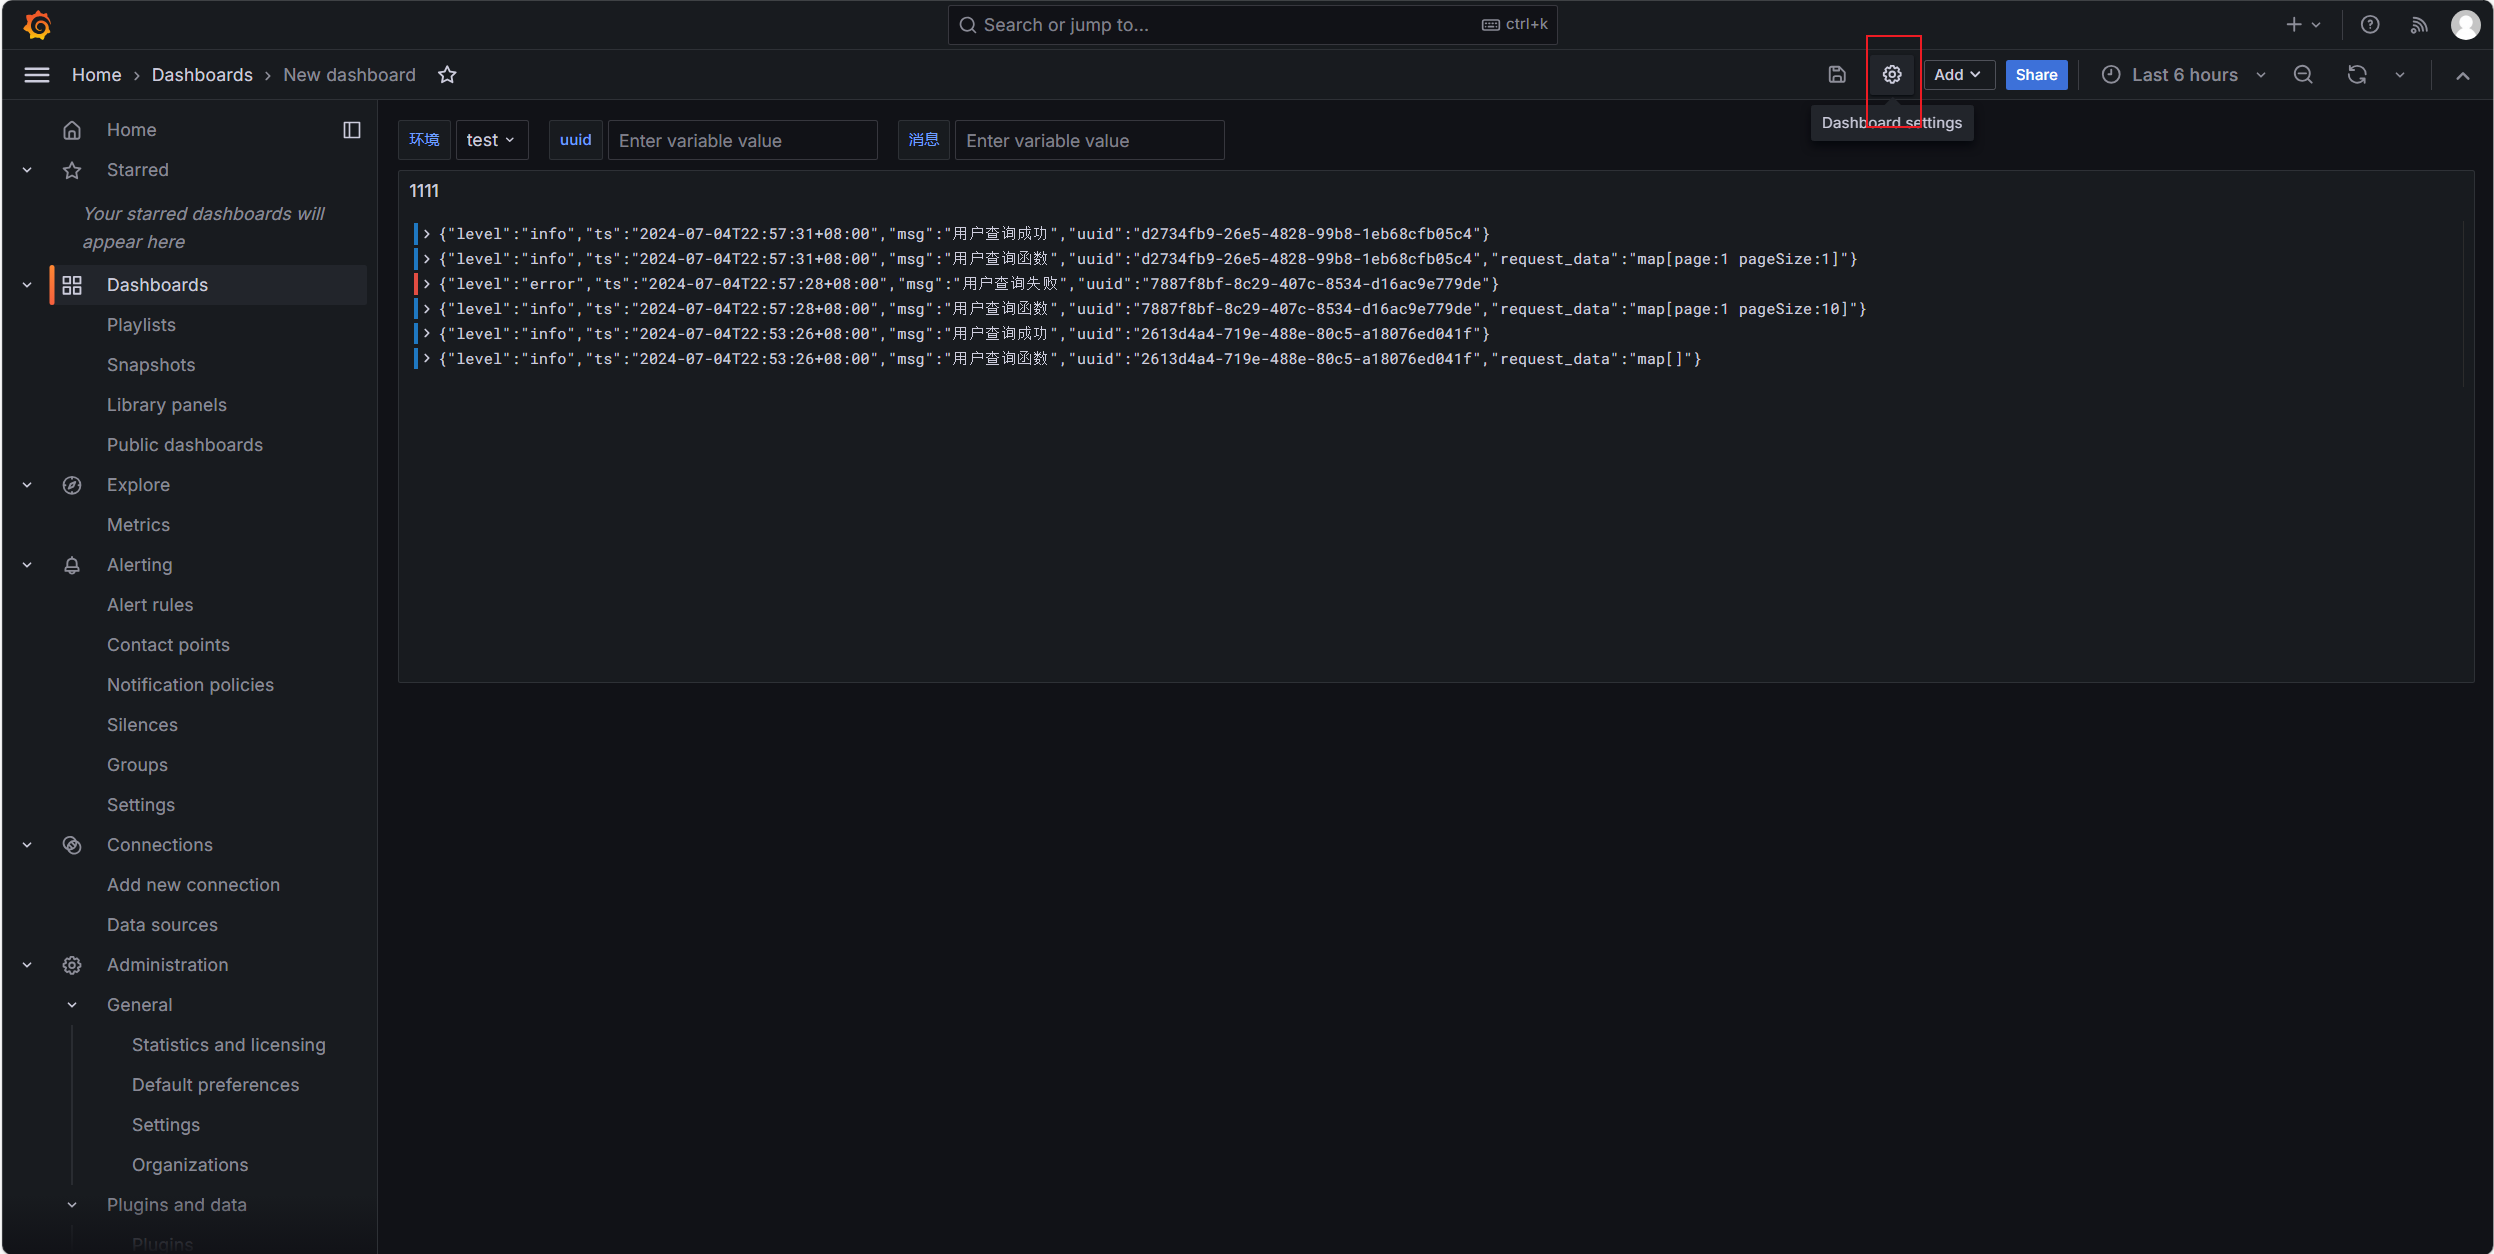
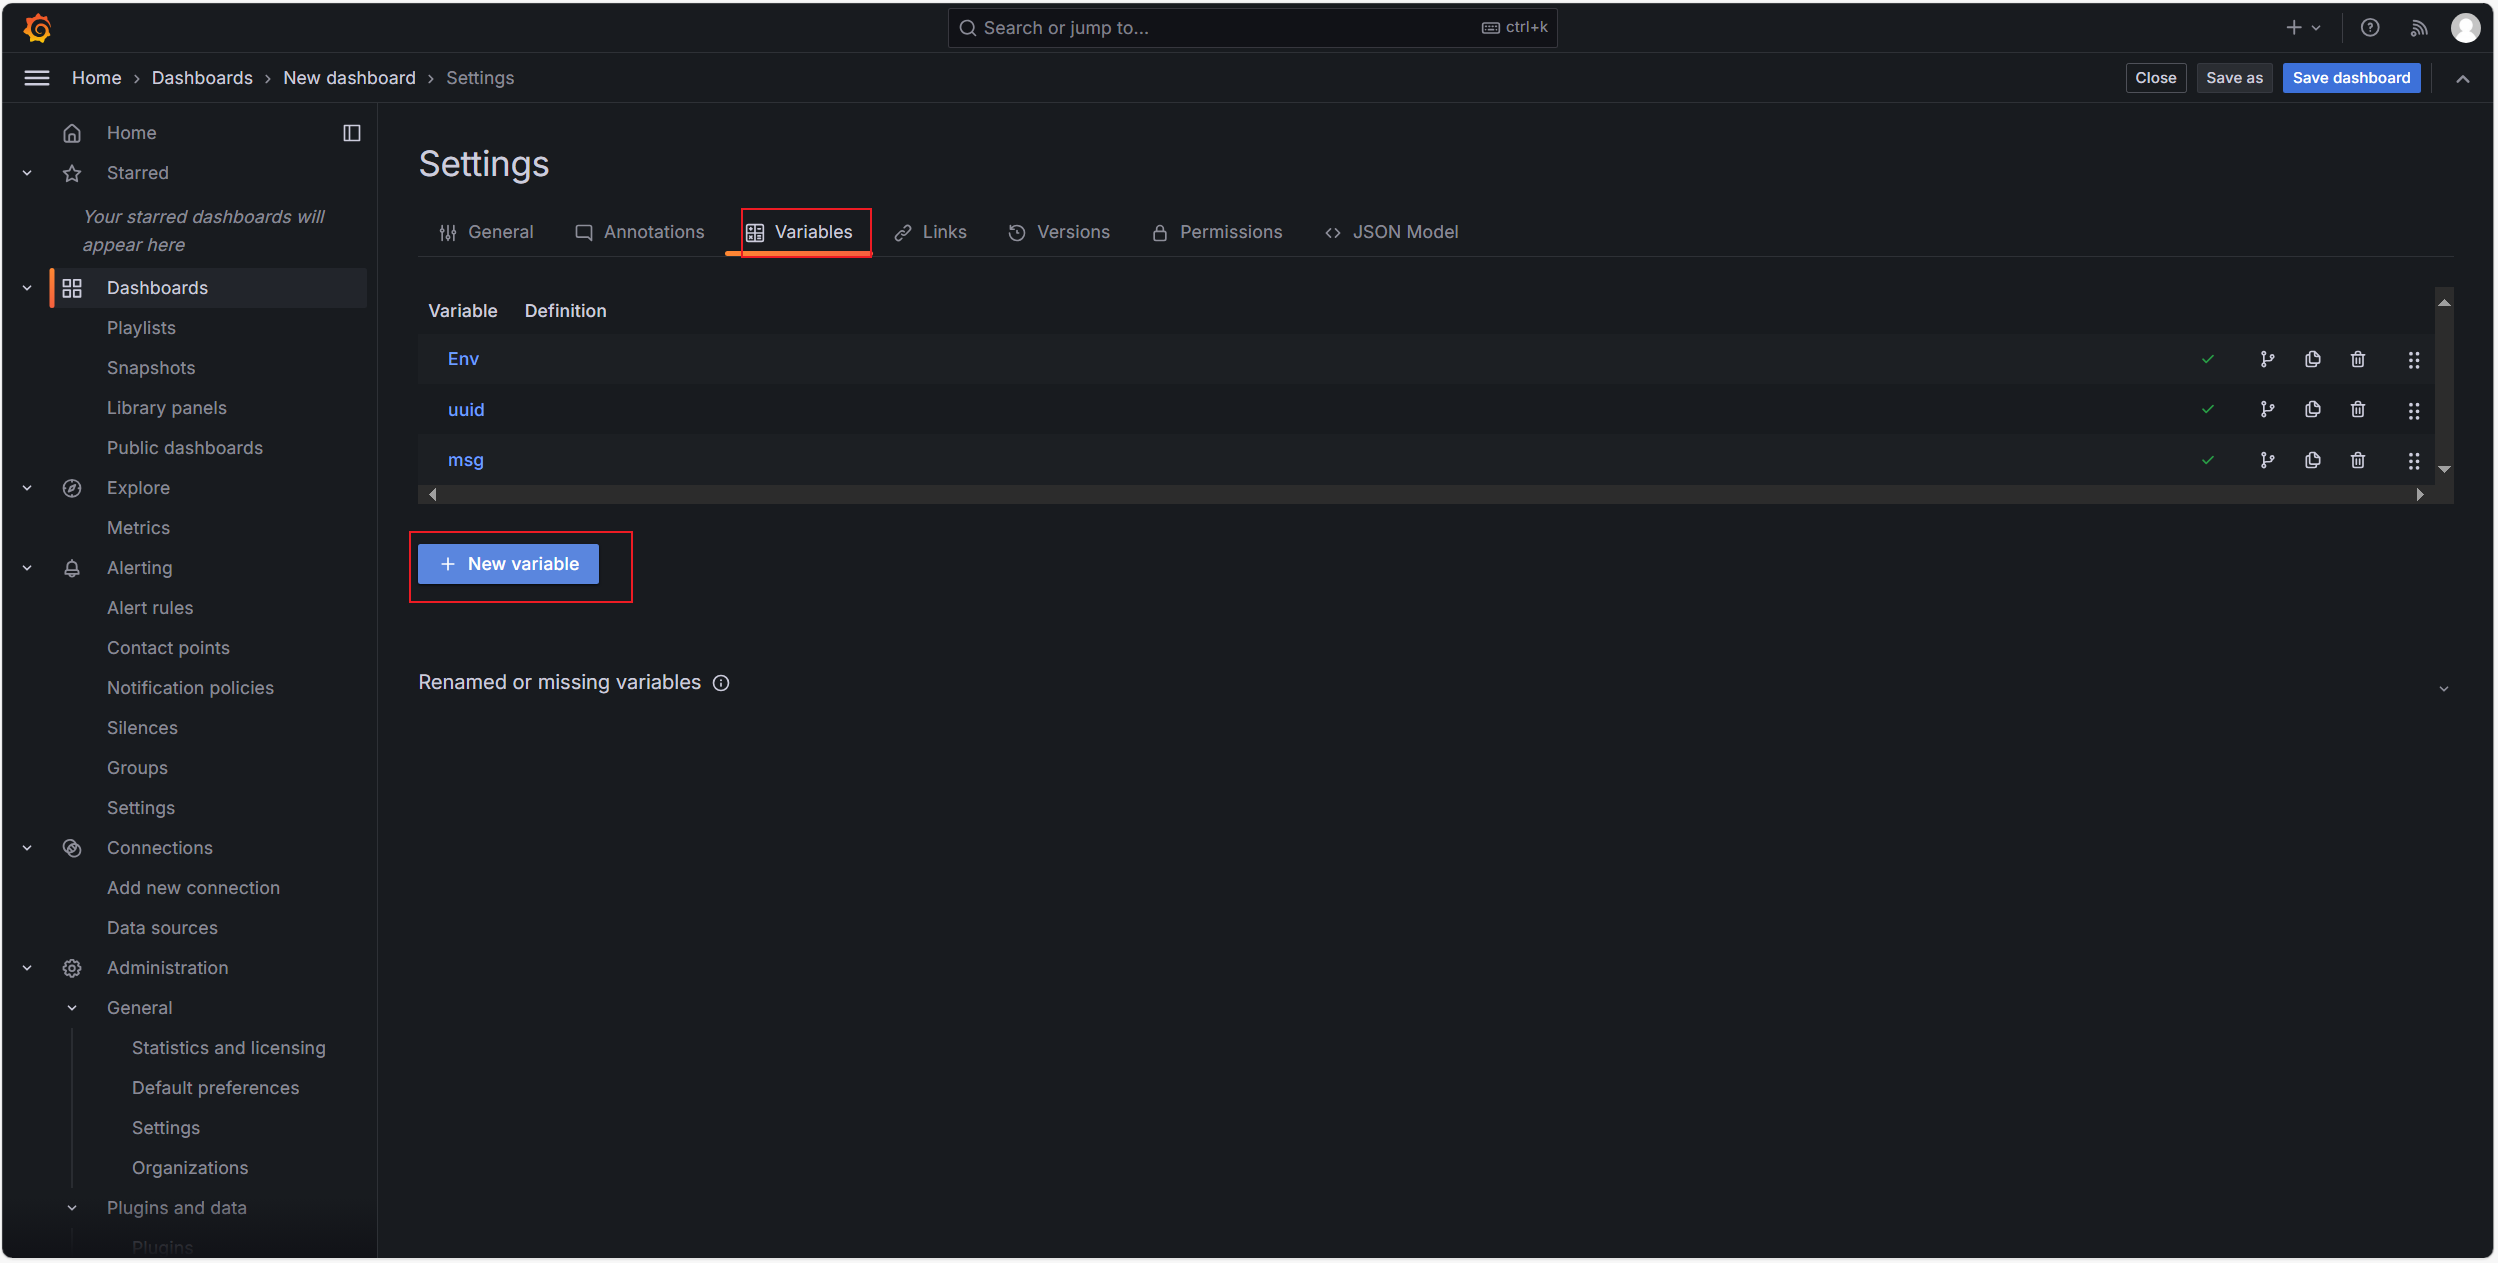
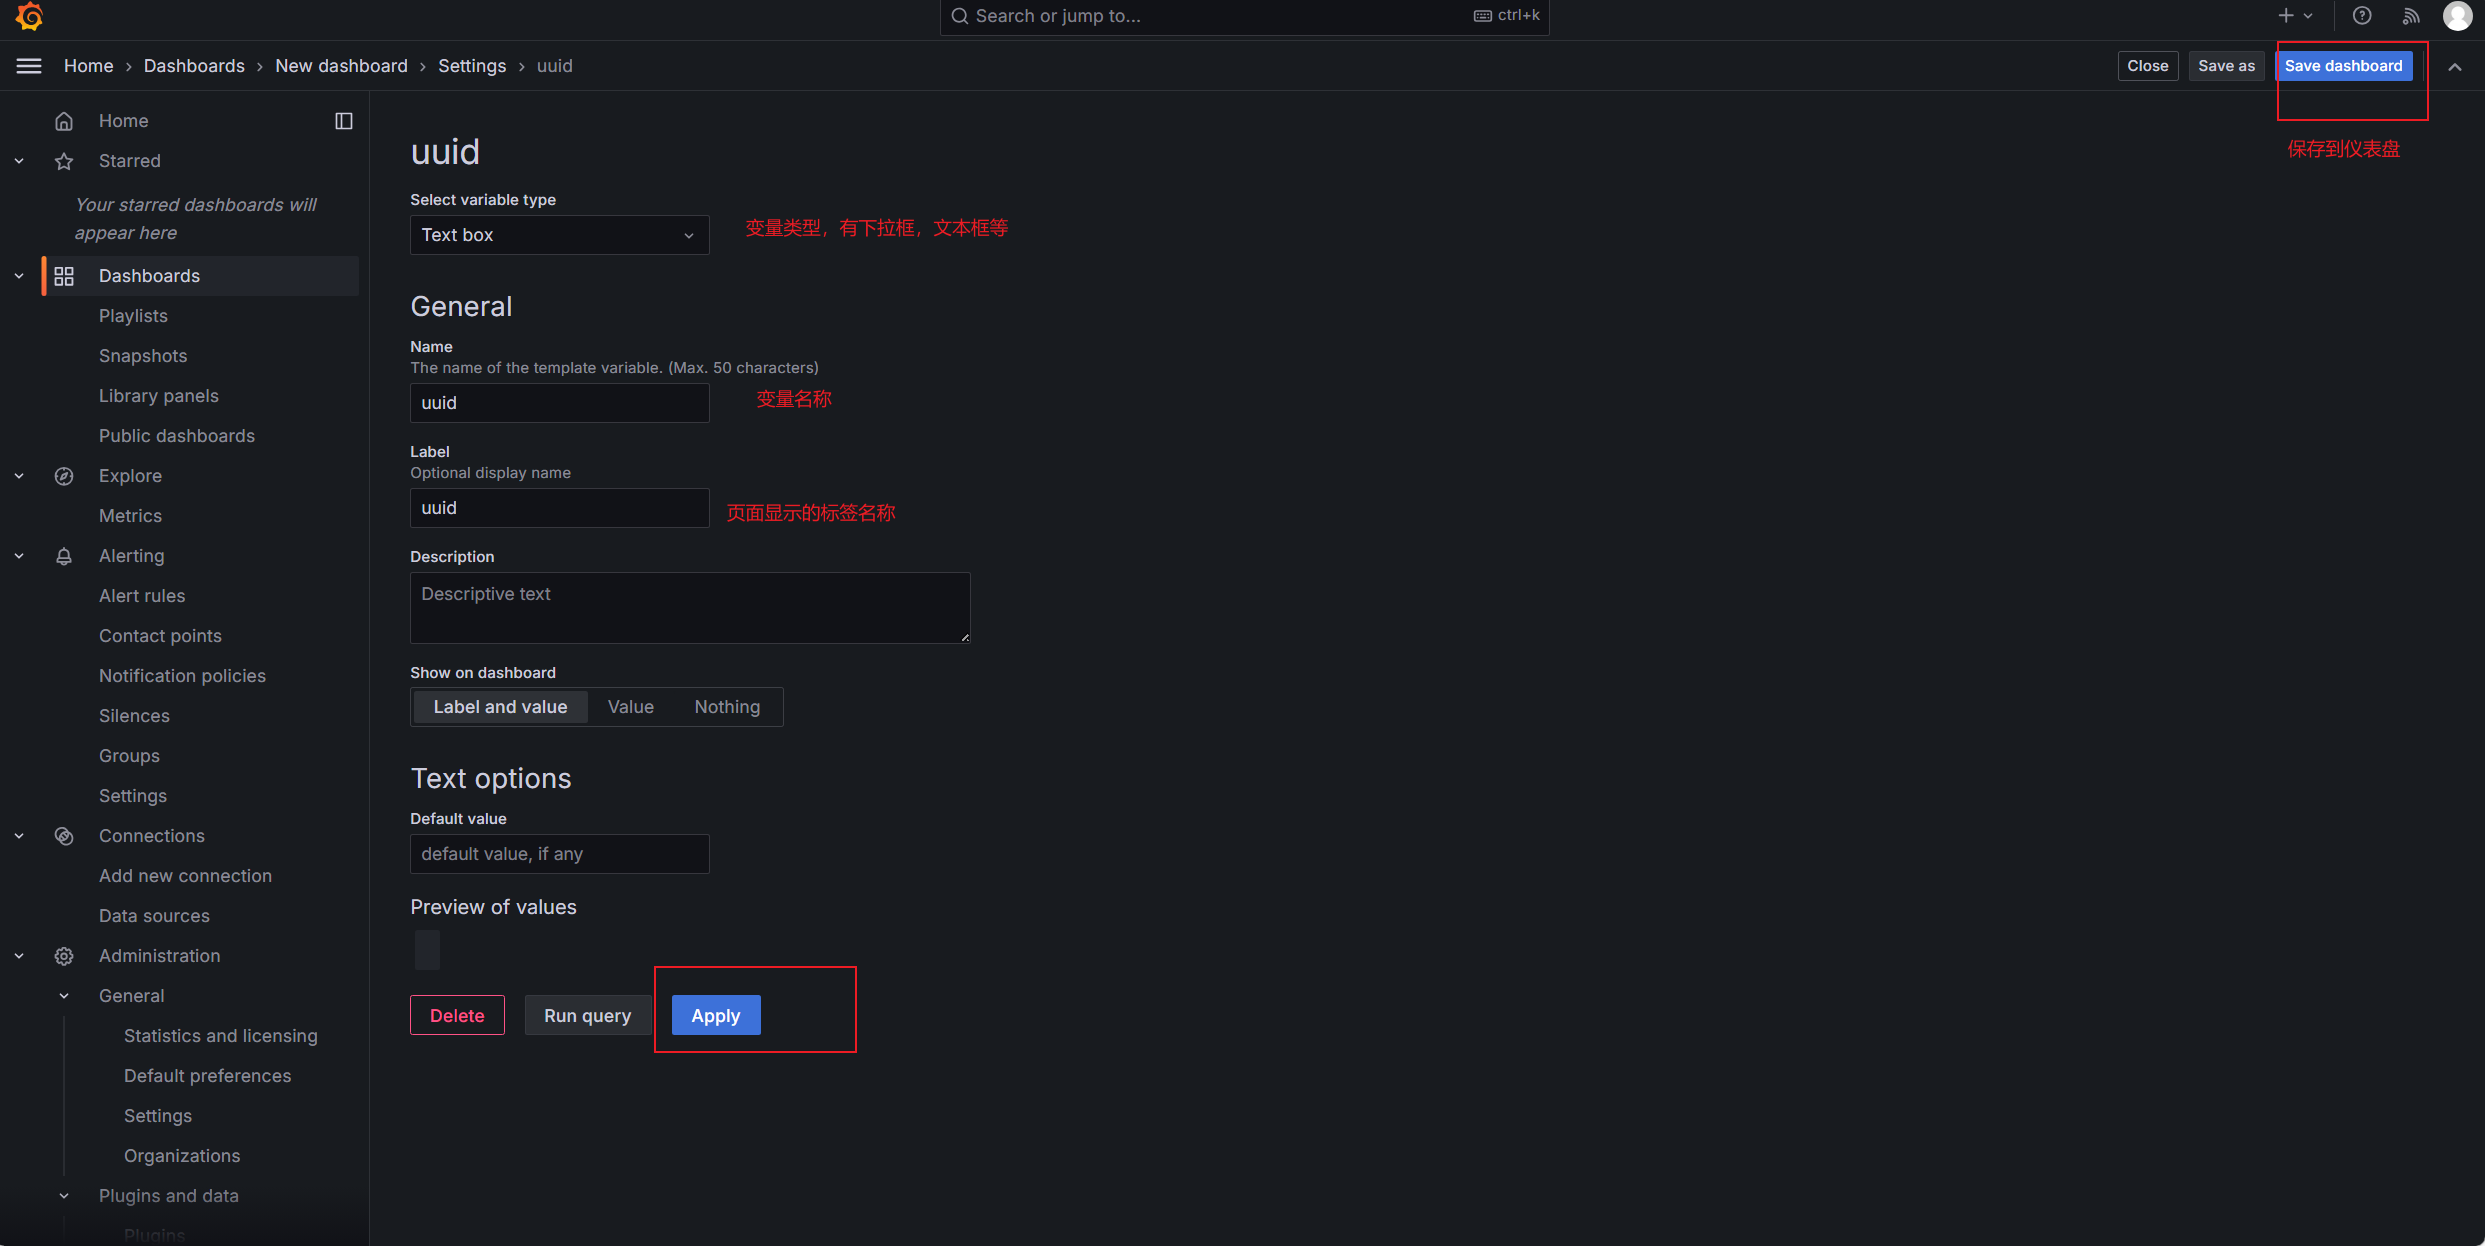
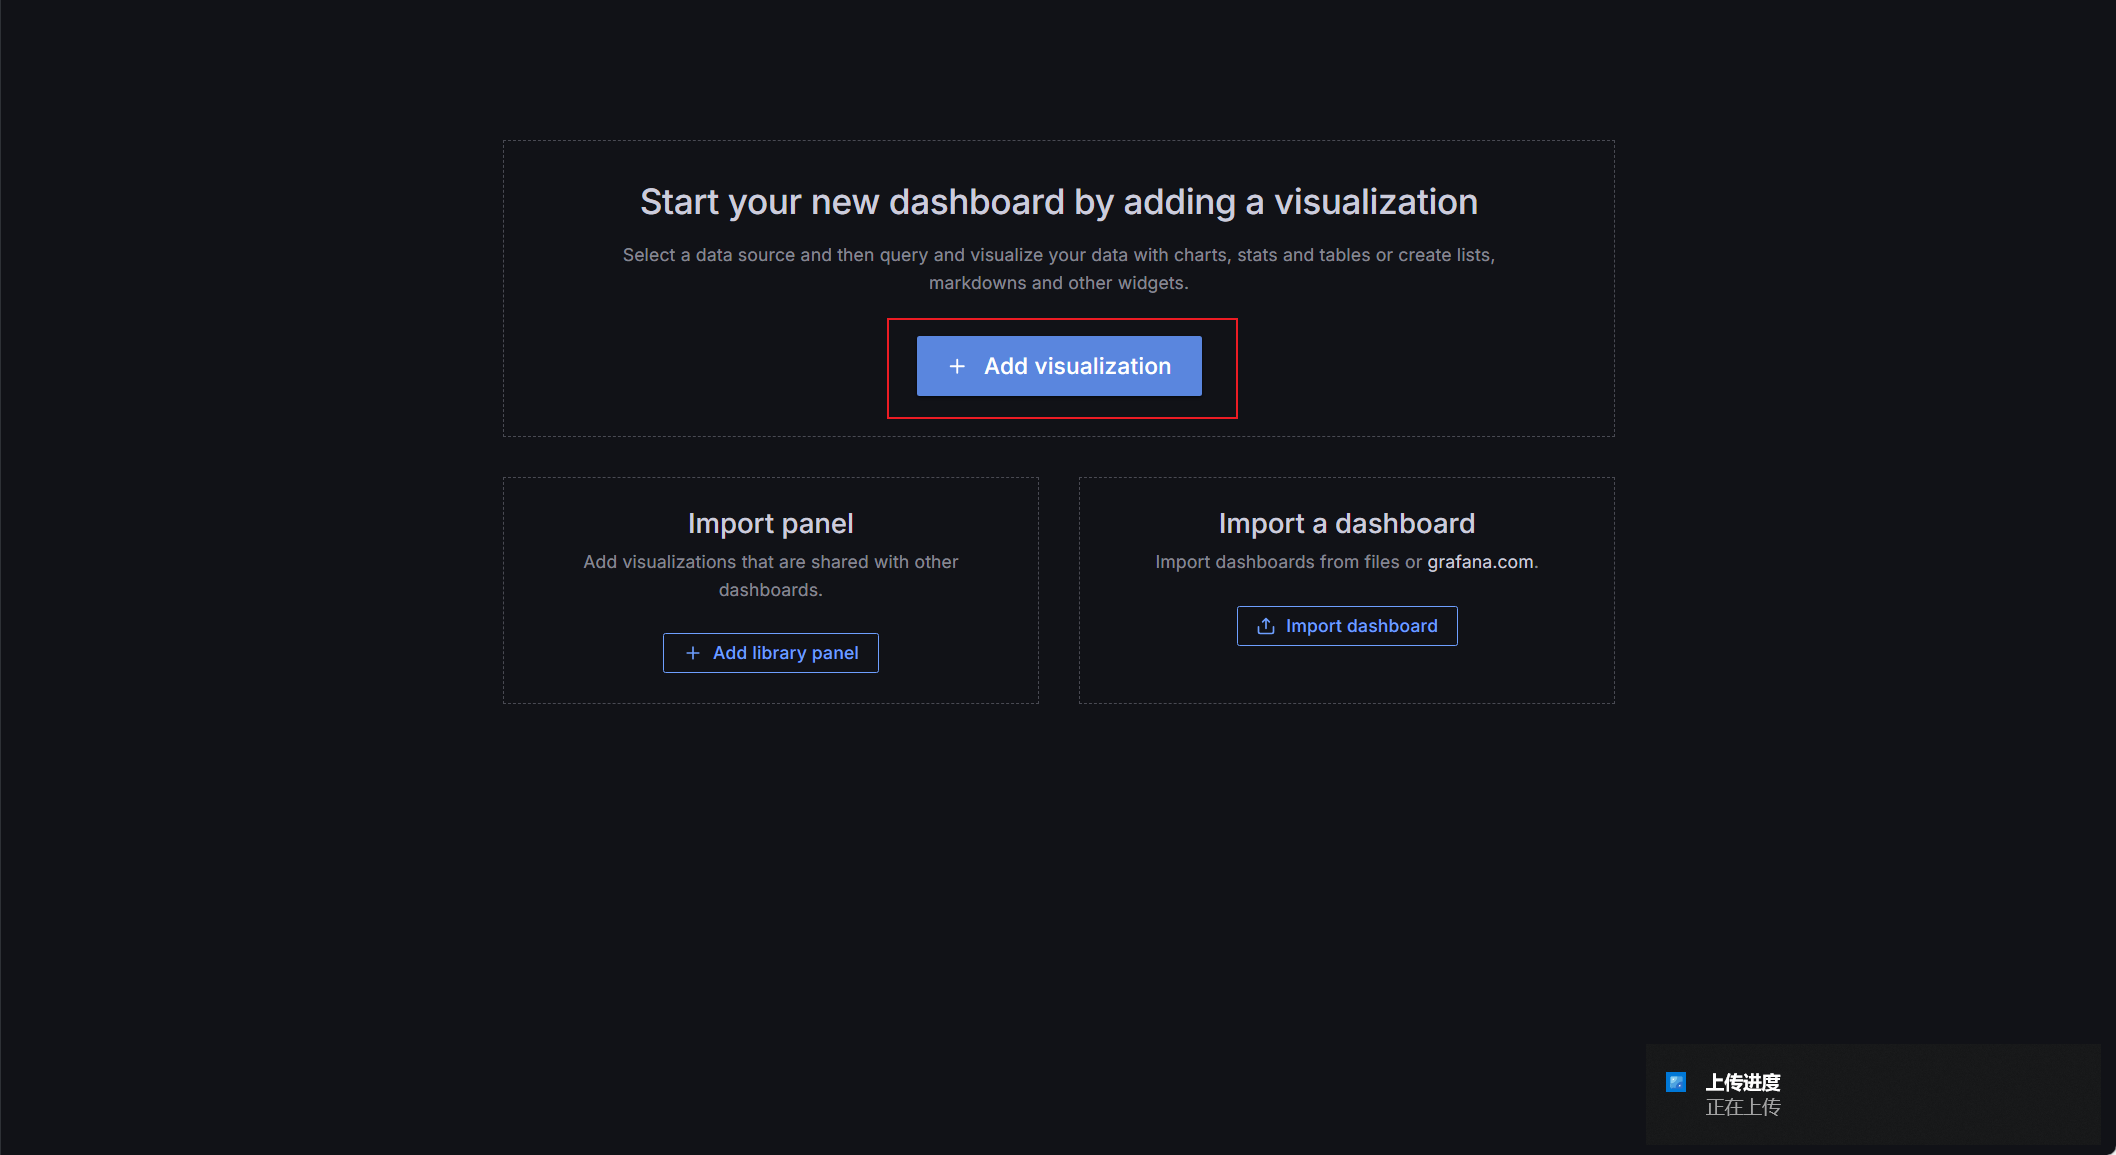
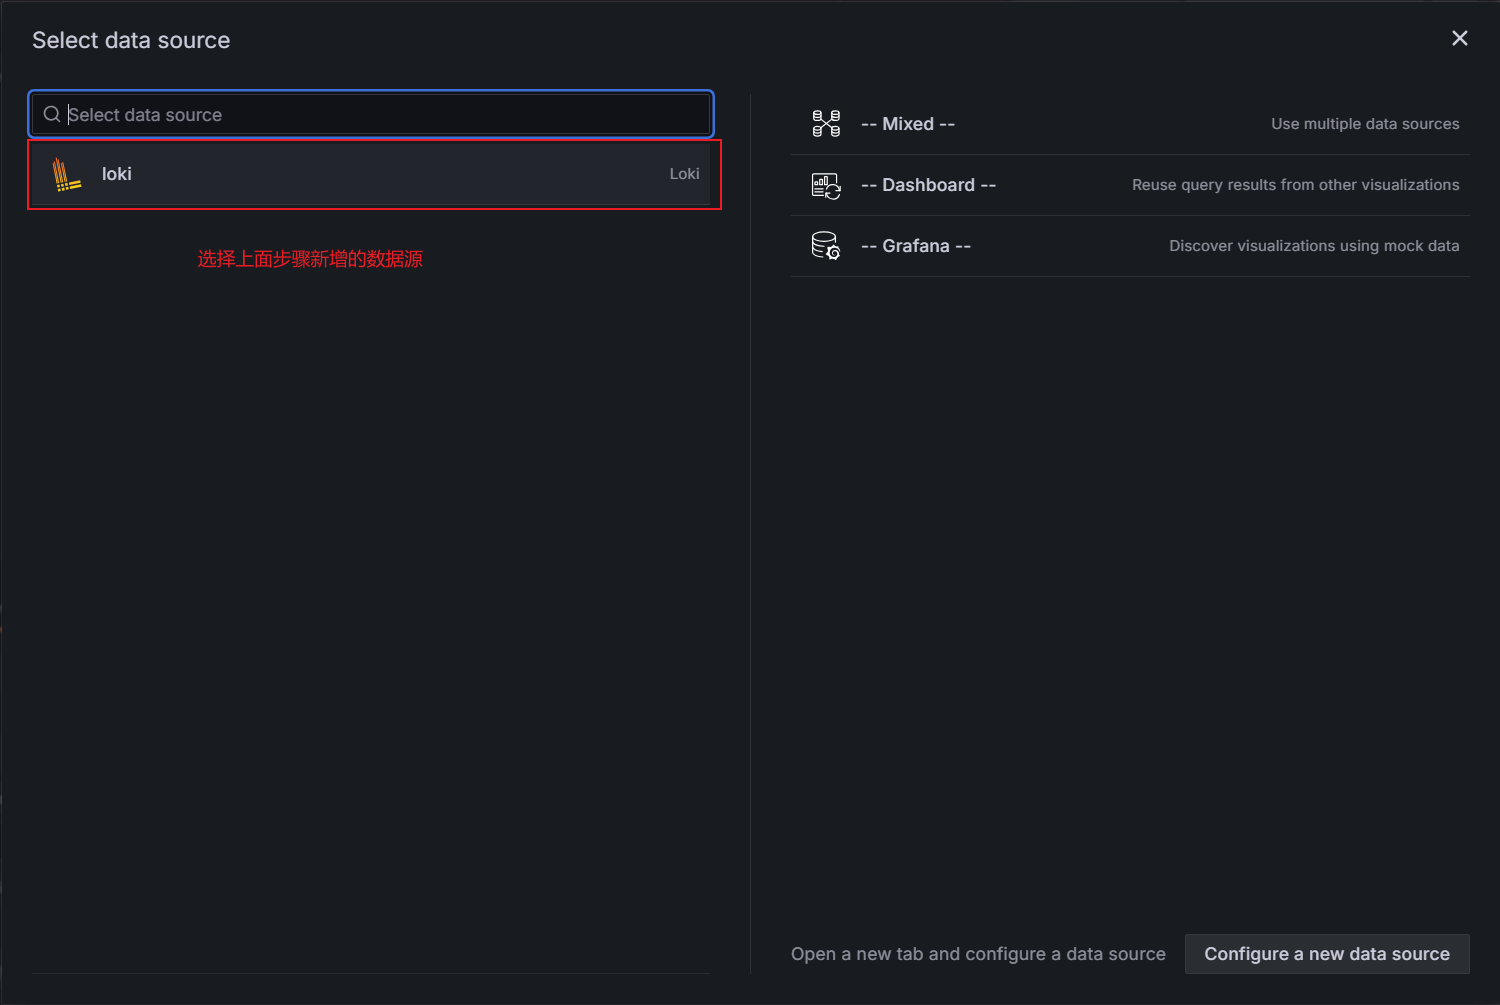
创建仪表盘
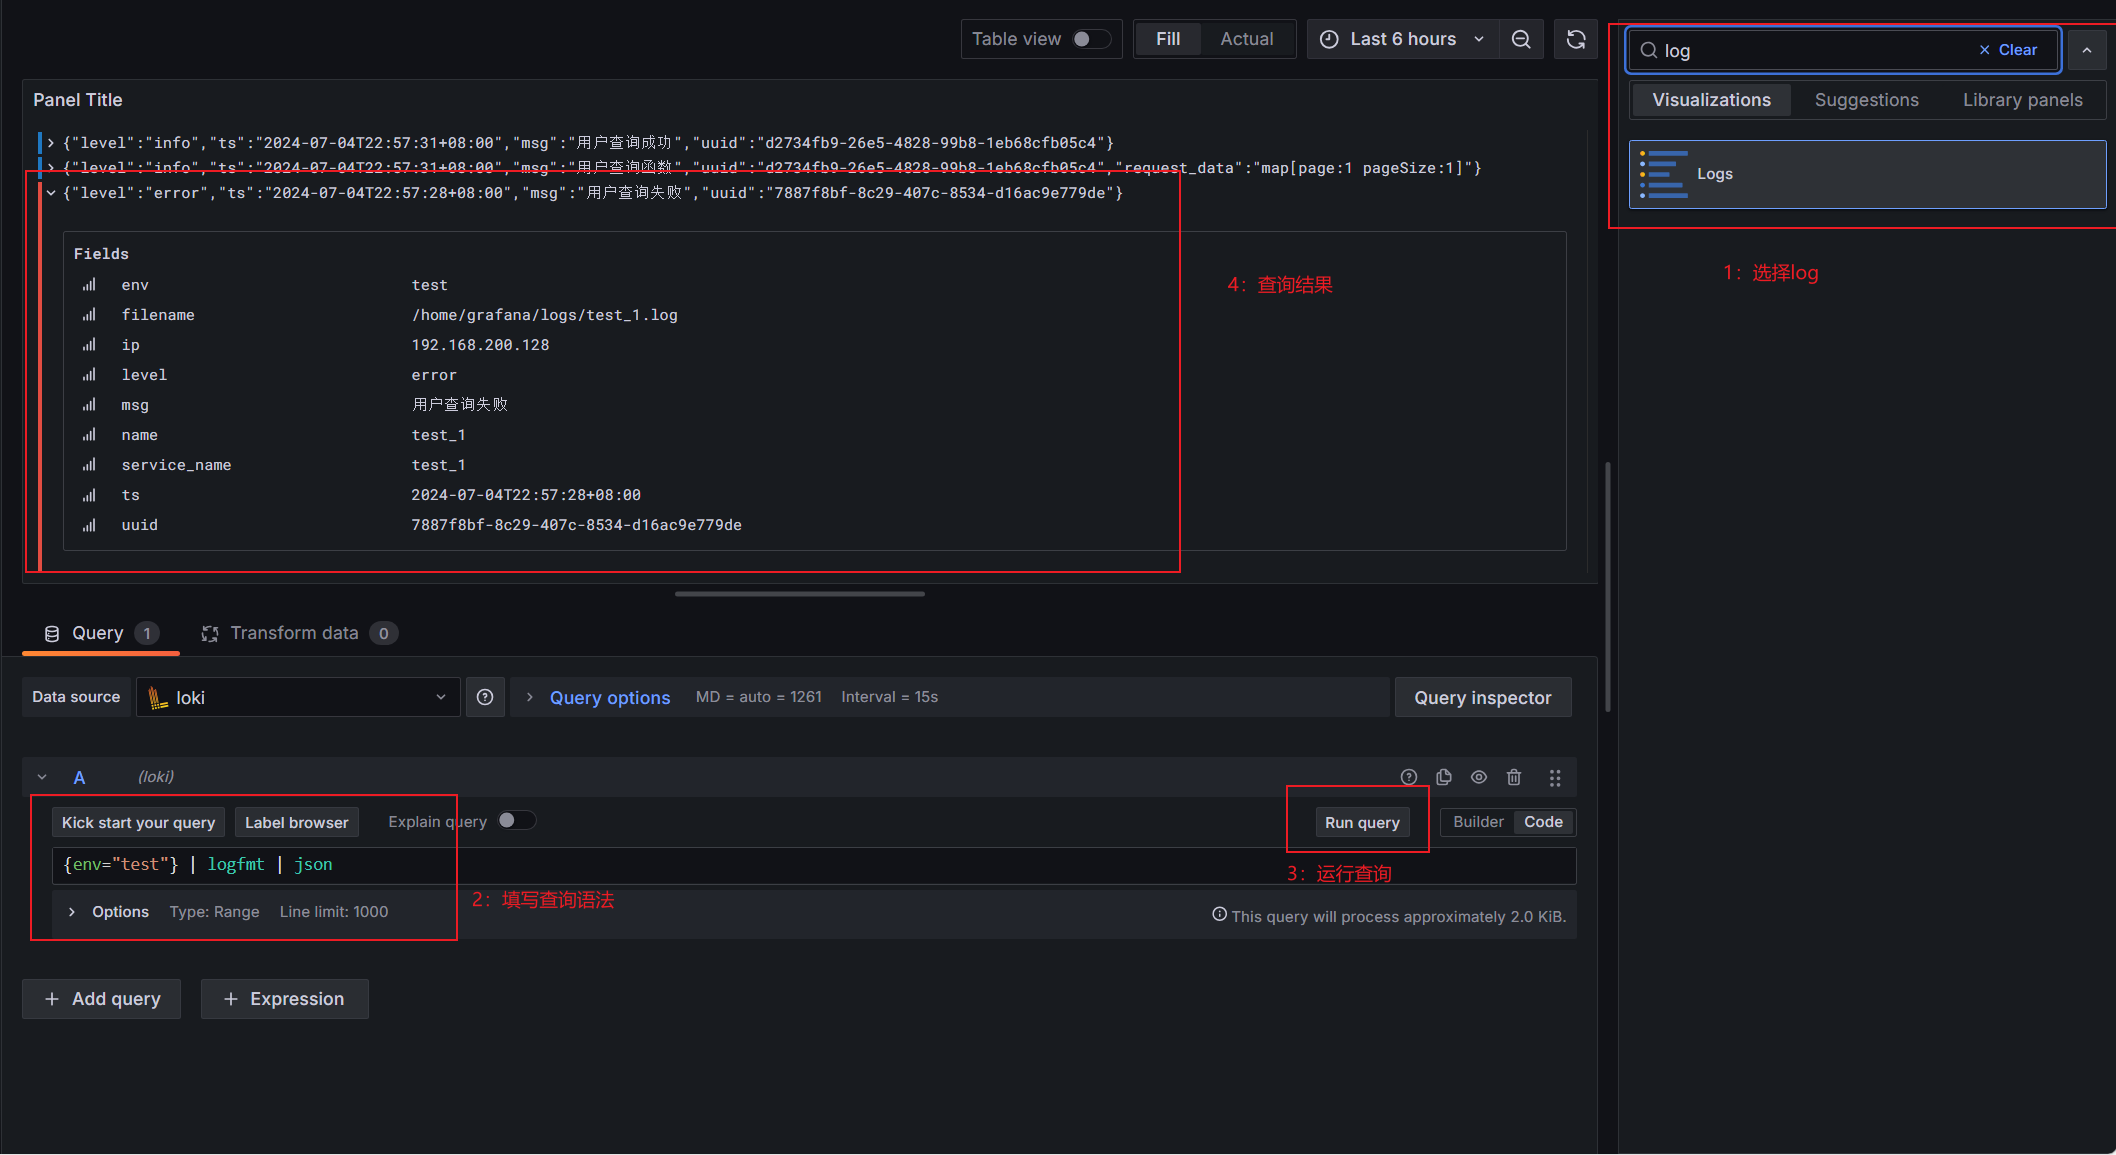
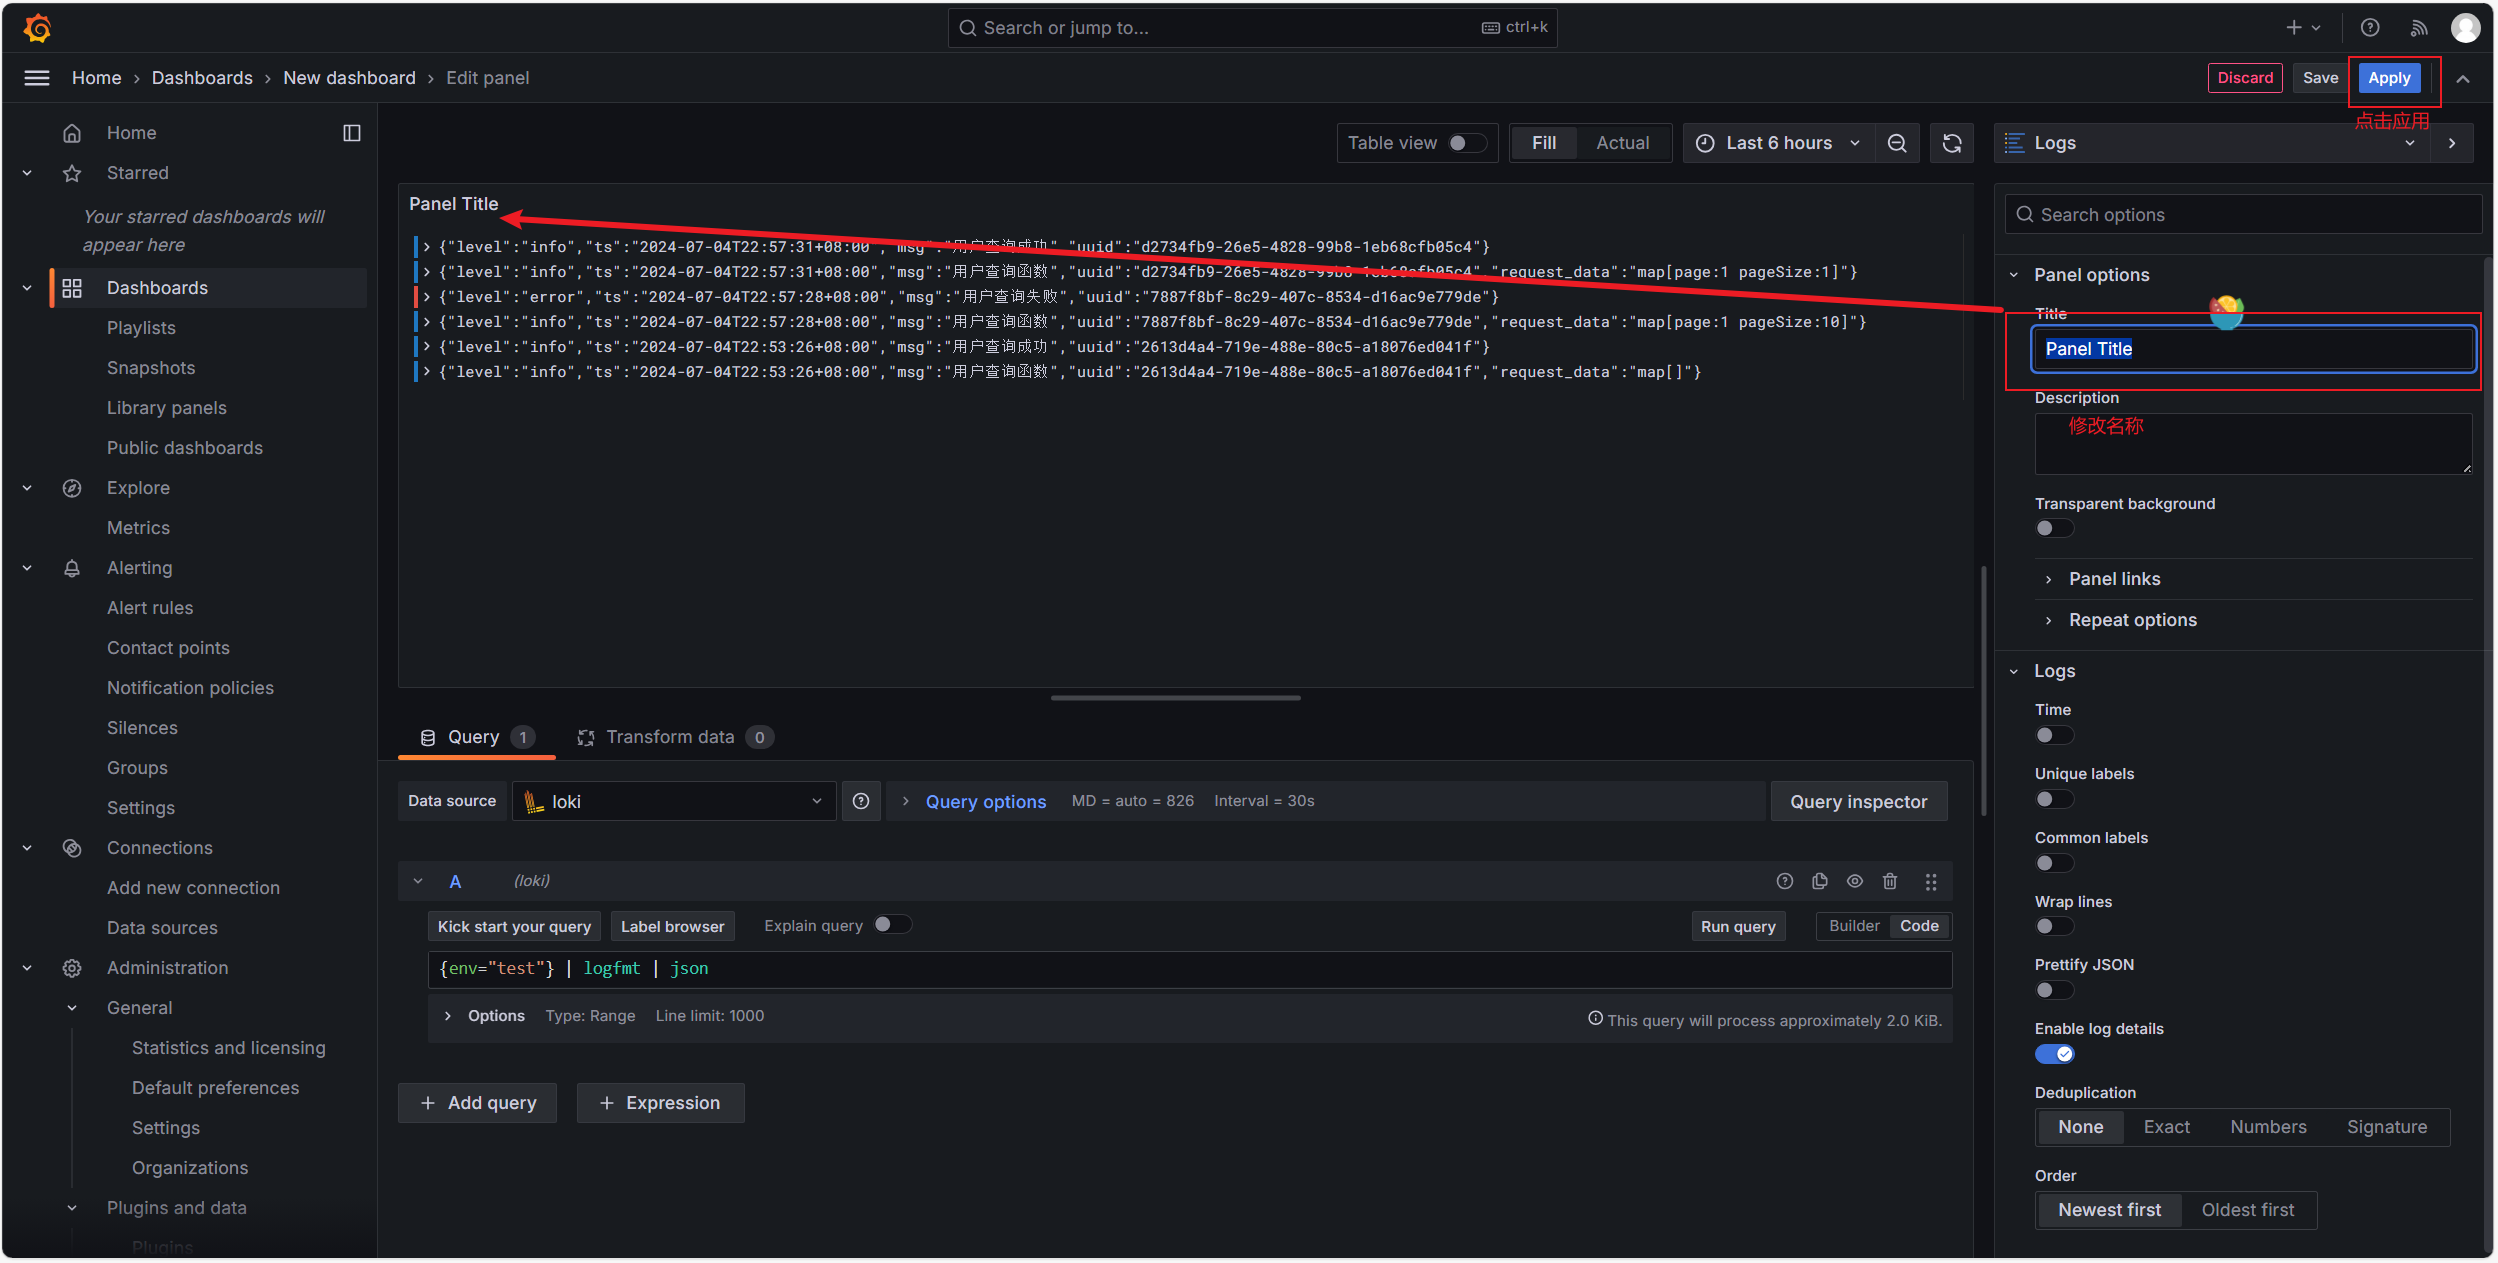
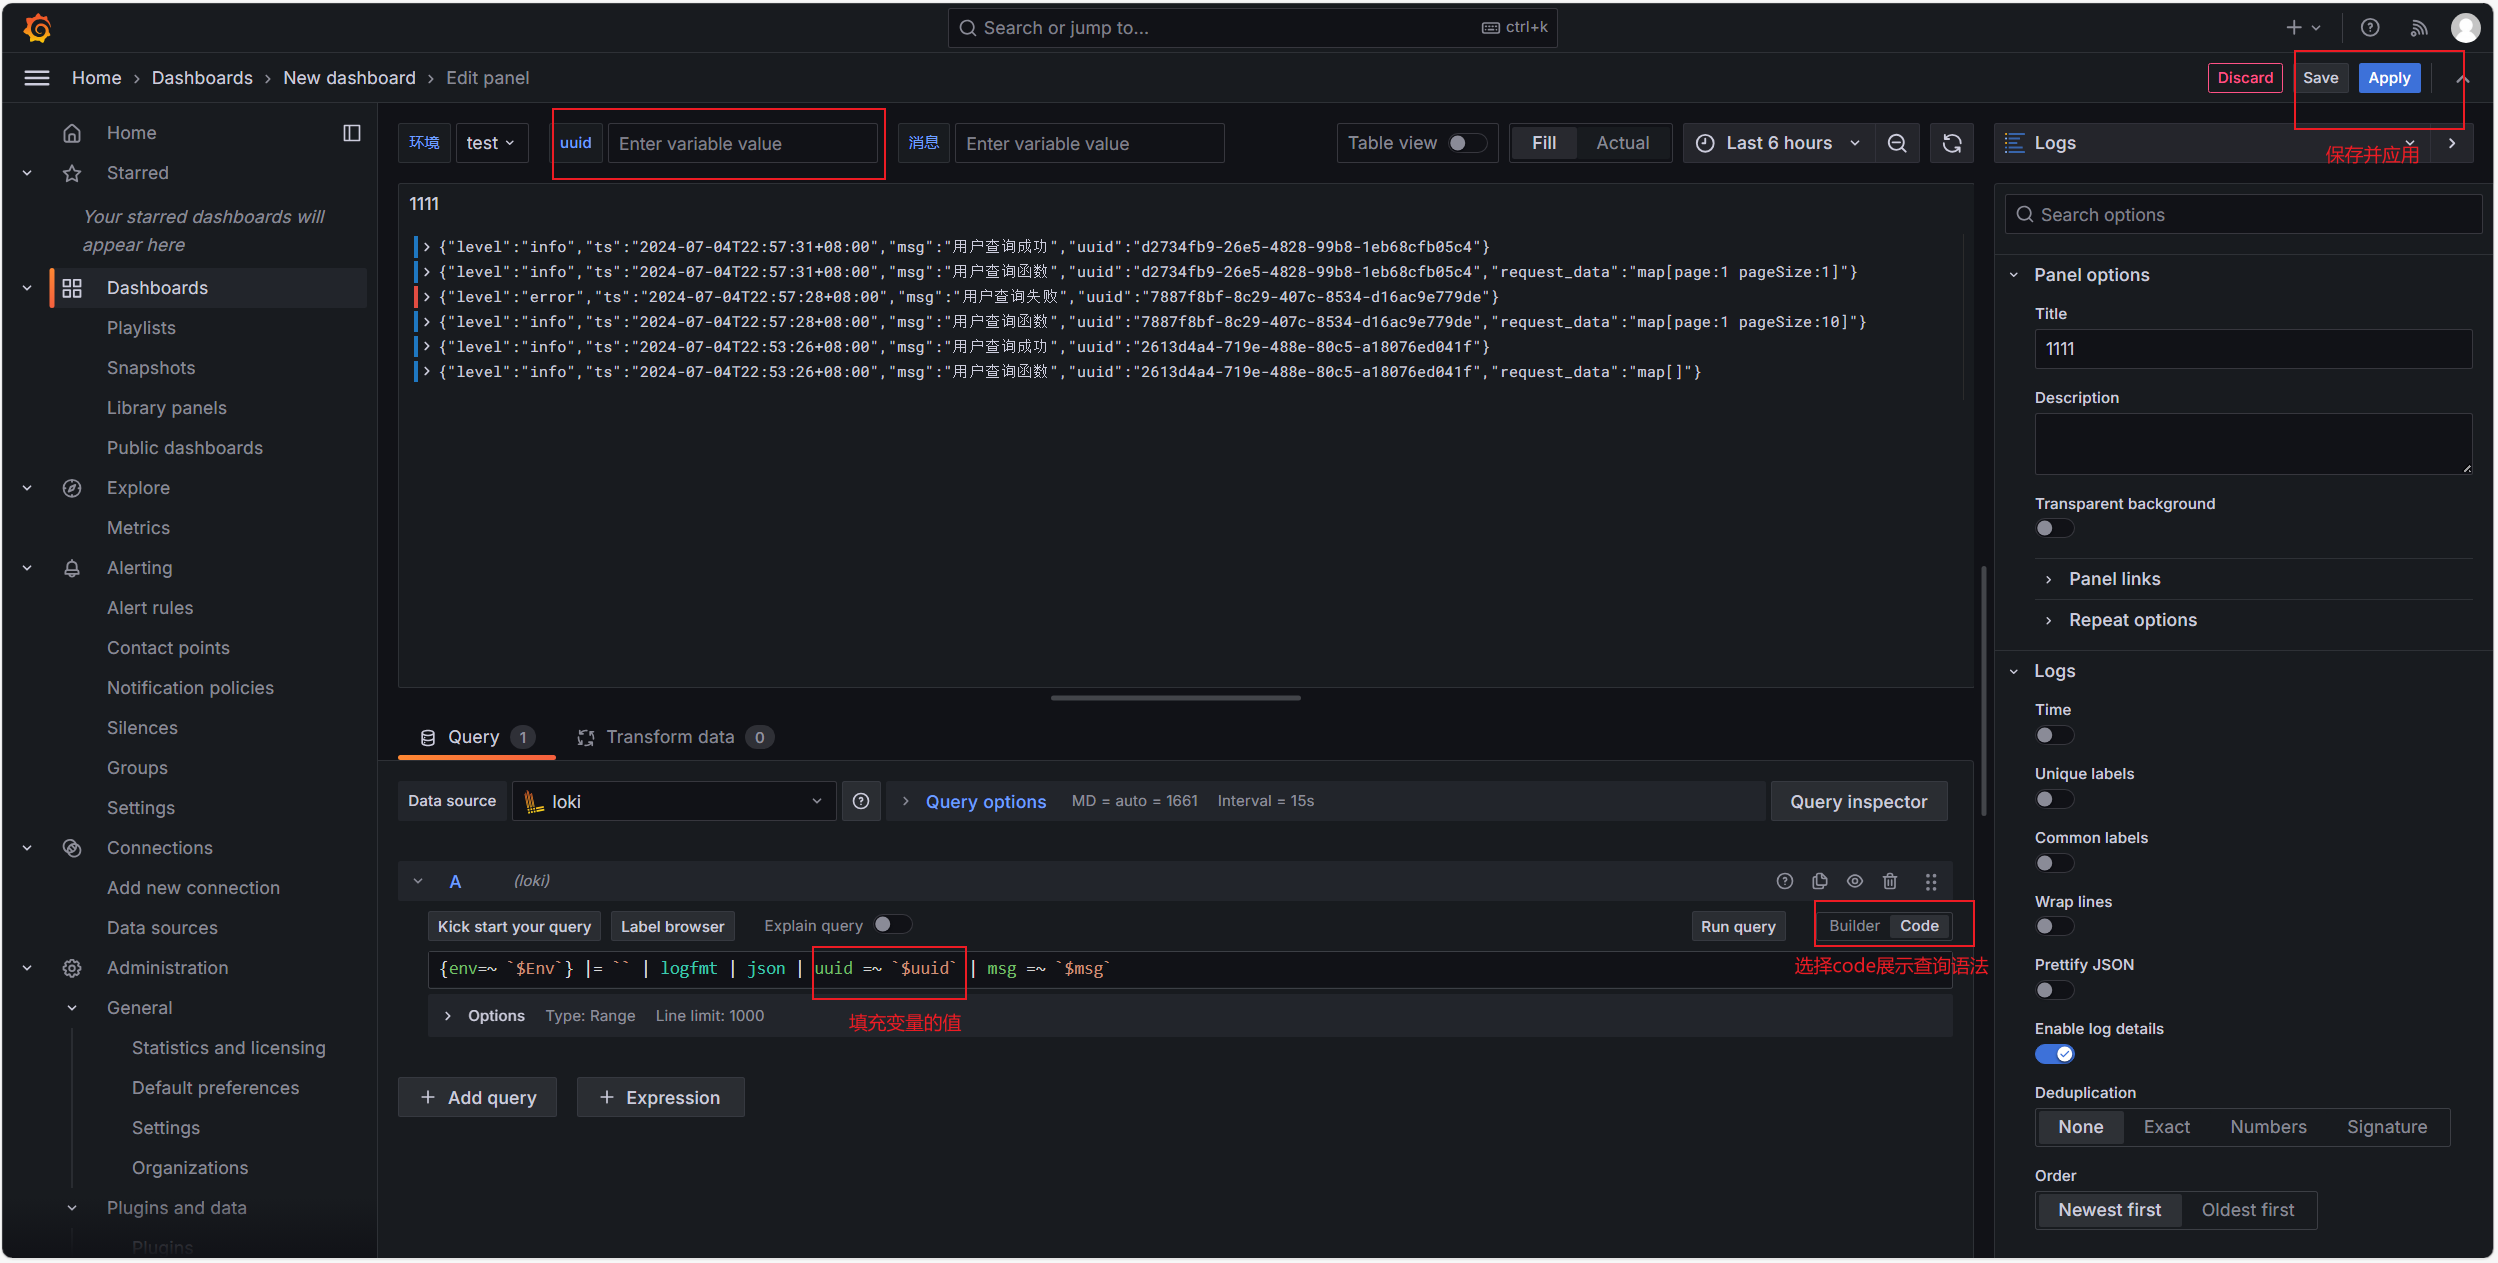
添加查询项