7.1 在区间[0,10]上等间距取1000个点Xi(i为下标,i=1,2,3,...,1000),并计算在这些点Xi处函数g(x)=((3x2+4x+6)sinx)/(x2+8x+6)的函数值yi(i为下标),利用观测点(Xi,Yi)(i=1,2,3,...,1000),求三次样条插值函数h(x),并求积分g(x)从0到10和h(x)从0到10。
点击查看代码
import scipy.interpolate as spi
import scipy.integrate as spi_integratedef g(x):return ((3 * x**2 + 4 * x + 6) * np.sin(x)) / (x**2 + 8 * x + 6)x_values = np.linspace(0, 10, 1000)y_values = g(x_values)spline = spi.CubicSpline(x_values, y_values)def h(x):return spline(x)integral_g, _ = spi_integrate.quad(g, 0, 10)x_fine = np.linspace(0, 10, 10000)
y_fine = h(x_fine)integral_h = np.trapz(y_fine, x_fine)print(f"积分 g(x) 从 0 到 10 的结果: {integral_g}")
print(f"积分 h(x) 从 0 到 10 的结果: {integral_h}")print("学号后四位:3028")print("学号:2023310143028")

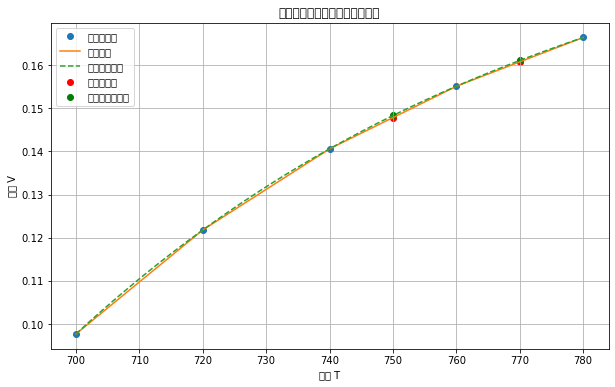
7.3 已知当温度T=[700,720,740,760,780]时,过热蒸汽体积的变化为V=[0.0977,0.1218,0.1406,0.1551,0.1664],分别采用线性插值和三次样条插值求解T=750,770时的体积变化,并在一个图形界面中画出线性插值函数和三次样条插值函数.
点击查看代码
import matplotlib.pyplot as plt
from scipy.interpolate import interp1d, CubicSplineT = np.array([700, 720, 740, 760, 780])
V = np.array([0.0977, 0.1218, 0.1406, 0.1551, 0.1664])T_interp = np.array([750, 770])f_linear = interp1d(T, V, kind='linear')
V_linear_interp = f_linear(T_interp)cs = CubicSpline(T, V)
V_cubic_interp = cs(T_interp)print(f"线性插值结果: T={T_interp} 对应的 V={V_linear_interp}")
print(f"三次样条插值结果: T={T_interp} 对应的 V={V_cubic_interp}")
print("学号后四位:3004")x = np.linspace(700, 780, 400)plt.figure(figsize=(10, 6))
plt.plot(T, V, 'o', label='原始数据点')
plt.plot(x, f_linear(x), '-', label='线性插值')
plt.plot(x, cs(x), '--', label='三次样条插值')
plt.scatter(T_interp, V_linear_interp, color='red', label='线性插值点')
plt.scatter(T_interp, V_cubic_interp, color='green', label='三次样条插值点')
plt.xlabel('温度 T')
plt.ylabel('体积 V')
plt.title('过热蒸汽体积随温度变化的插值')
plt.legend()
plt.grid(True)
plt.show()print("学号:2023310143028")
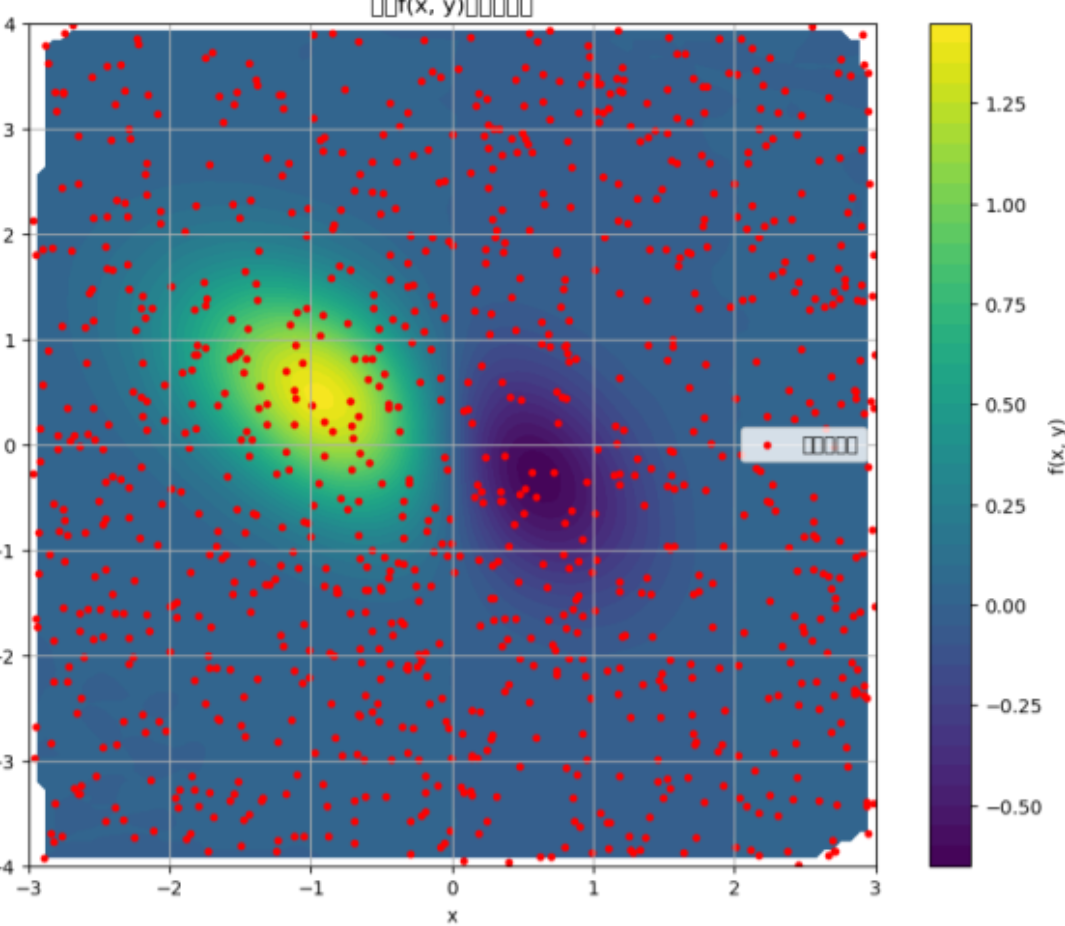
7.4 考虑矩形区域x∈[-3,3],y∈[-4,4]上的函数f(x,y)=(x2-2x)e(-x2-y2-xy),利用随机生成函数uniform随机生成该矩形内的散乱点,然后利用griddata函数进行插值处理,并作出插值结果图形.
点击查看代码
import matplotlib.pyplot as plt
from scipy.interpolate import griddatadef f(x, y):
return (x2 - 2*x) * np.exp(-x2 - y**2 - x*y)x_min, x_max = -3, 3
y_min, y_max = -4, 4num_points = 1000
x_random = np.random.uniform(x_min, x_max, num_points)
y_random = np.random.uniform(y_min, y_max, num_points)z_random = f(x_random, y_random)grid_x, grid_y = np.mgrid[x_min:x_max:100j, y_min:y_max:100j]grid_z = griddata((x_random, y_random), z_random, (grid_x, grid_y), method='cubic')plt.figure(figsize=(10, 8))
plt.contourf(grid_x, grid_y, grid_z, levels=50, cmap='viridis') # 使用等高线图填充
plt.colorbar(label='f(x, y)')
plt.scatter(x_random, y_random, c='red', s=10, label='随机散乱点') # 绘制随机散乱点
plt.title('函数f(x, y)的插值结果')
plt.xlabel('x')
plt.ylabel('y')
plt.legend()
plt.grid(True)
plt.show()print("学号:2023310143028")
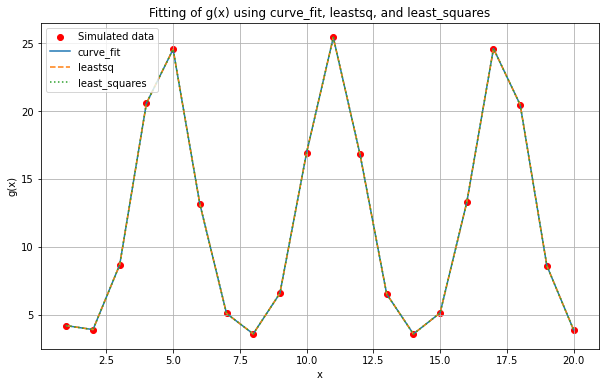
7.7 g(x)=(10a)/(10b+(a-10b)e^(asinx)),取a=1.1,b=0.01,计算x=1,2,...,20时,g(x)对应的函数值,把这样得到的数据作为模拟观测值,记作(xi,yi)(其中i为x,y的下标),i=1,2,...,20。用curve_fit拟合函数g(x)。用leastsq拟合函数g(x)。用least_squares拟合函数g(x)
点击查看代码
import matplotlib.pyplot as plt
from scipy.optimize import curve_fit, leastsq, least_squares
from scipy.constants import e  # Note: 'e' is imported but not used in the codedef g(x, a, b):return (10 * a) / (10 * b + (a - 10 * b) * np.exp(a * np.sin(x)))a = 1.1
b = 0.01x_values = np.arange(1, 21)y_values = g(x_values, a, b)for i, (xi, yi) in enumerate(zip(x_values, y_values), start=1):print(f"({xi}, {yi:.6f})")popt_curve_fit, pcov_curve_fit = curve_fit(g, x_values, y_values, p0=[a, b])
y_fit_curve_fit = g(x_values, *popt_curve_fit)def func_leastsq(params, x, y):return y - g(x, *params)popt_leastsq = leastsq(func_leastsq, [a, b], args=(x_values, y_values))[0]
y_fit_leastsq = g(x_values, *popt_leastsq)popt_least_squares = least_squares(func_leastsq, [a, b], args=(x_values, y_values)).x
y_fit_least_squares = g(x_values, *popt_least_squares)print("\ncurve_fit parameters:", popt_curve_fit)
print("leastsq parameters:", popt_leastsq)
print("least_squares parameters:", popt_least_squares)plt.figure(figsize=(10, 6))
plt.scatter(x_values, y_values, label='Simulated data', color='red')
plt.plot(x_values, y_fit_curve_fit, label='curve_fit', linestyle='-')
plt.plot(x_values, y_fit_leastsq, label='leastsq', linestyle='--')
plt.plot(x_values, y_fit_least_squares, label='least_squares', linestyle=':')  # 修正线型
plt.xlabel('x')
plt.ylabel('g(x)')
plt.legend()
plt.title('Fitting of g(x) using curve_fit, leastsq, and least_squares')
plt.grid(True)
plt.show()print("学号:2023310143028")
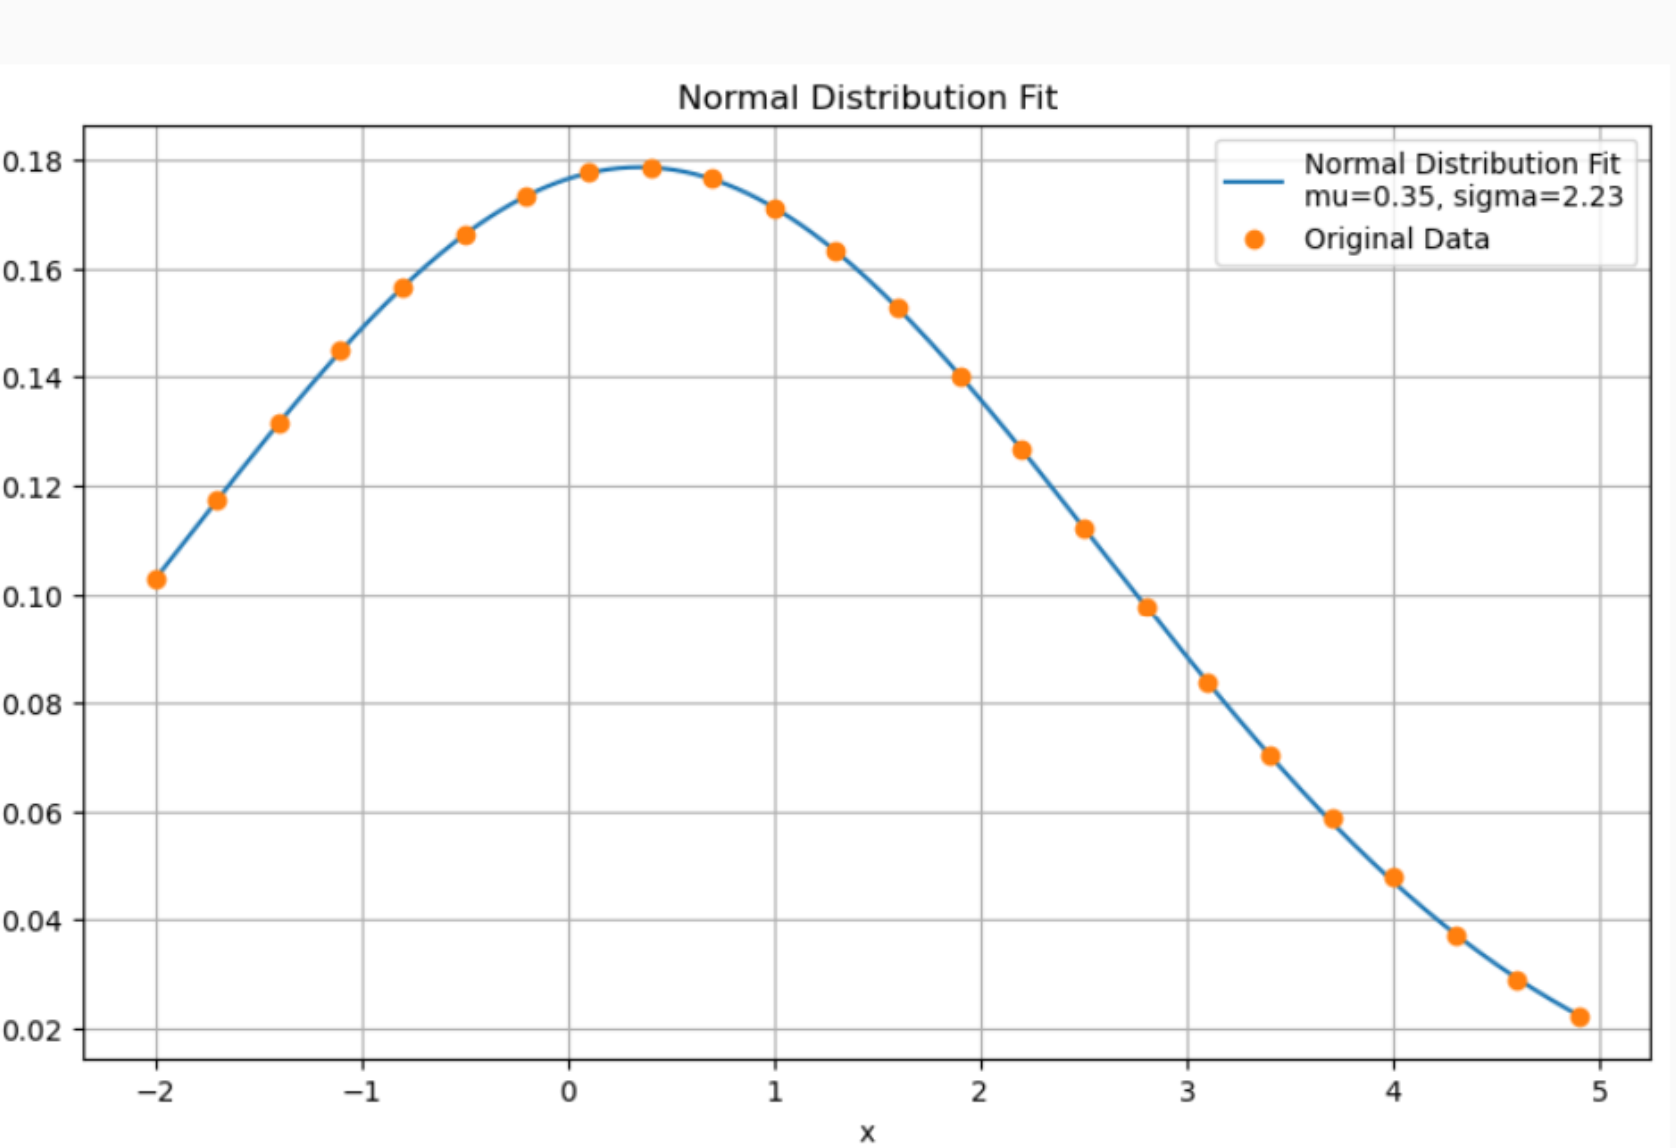
7.10 已知一组观测数据,如表中7.17.excel(表中第一列为x的值,第二列为y的值)。试用插值方法绘制出x属于-2到4.9区间内的曲线,并比较各种插值算法的优劣。试用多项式拟合表中数据,选择一个能较好拟合数据点的多项式的阶式,给出相应多项式的系数和剩余标准差。若表中数据满足正态分布函数,试用最小二乘法非线性拟合方法求出分布参数的值,并利用所求参数值绘制拟合曲线,观察拟合效果。
点击查看代码
import pandas as pd
import matplotlib.pyplot as plt
from scipy.interpolate import interp1d, PchipInterpolator, CubicSpline
from scipy.optimize import curve_fit
from scipy.stats import normfile_path = '7.17.xlsx'
data = pd.read_excel(file_path, header=None)
x_data = data.iloc[:, 0].values
y_data = data.iloc[:, 1].valuesx_interp = np.linspace(-2, 4.9, 400)interp_functions = {
'Linear': interp1d(x_data, y_data, kind='linear', bounds_error=False, fill_value='extrapolate'),
'Cubic': interp1d(x_data, y_data, kind='cubic', bounds_error=False, fill_value='extrapolate'),
'PCHIP': PchipInterpolator(x_data, y_data, extrapolate=True),
'CubicSpline': CubicSpline(x_data, y_data, bc_type='natural', extrapolate=True)
}y_interps = {name: func(x_interp) for name, func in interp_functions.items()}plt.figure(figsize=(10, 6))
for name, y_interp in y_interps.items():
plt.plot(x_interp, y_interp, label=name)
plt.plot(x_data, y_data, 'o', label='Original Data')
plt.xlabel('x')
plt.ylabel('y')
plt.legend()
plt.title('Interpolation Methods Comparison')
plt.grid(True)
plt.show()degrees = range(1, 6)
coeffs = {}
residuals = {}
for degree in degrees:
coefficients, residual = np.polyfit(x_data, y_data, degree, cov=True)
residual_std = np.sqrt(residual[0, 0])
coeffs[degree] = coefficients
residuals[degree] = residual_stdfor degree, coeffs_val in coeffs.items():
print(f"Degree {degree} Polynomial Coefficients: {coeffs_val}")
print(f"Residual Standard Deviation: {residuals[degree]:.4f}")best_degree = min(residuals, key=residuals.get)
print(f"Best fitting polynomial degree: {best_degree}")best_poly = np.poly1d(coeffs[best_degree])
y_poly_fit = best_poly(x_interp)plt.figure(figsize=(10, 6))
plt.plot(x_interp, y_poly_fit, label=f'{best_degree}-degree Polynomial Fit')
plt.plot(x_data, y_data, 'o', label='Original Data')
plt.xlabel('x')
plt.ylabel('y')
plt.legend()
plt.title('Polynomial Fit')
plt.grid(True)
plt.show()def normal_dist(x, mu, sigma):
return norm.pdf(x, mu, sigma)params, params_covariance = curve_fit(normal_dist, x_data, y_data, p0=[np.mean(x_data), np.std(x_data)])
mu, sigma = paramsx_normal_fit = np.linspace(min(x_data), max(x_data), 400)
y_normal_fit = normal_dist(x_normal_fit, mu, sigma)plt.figure(figsize=(10, 6))
plt.plot(x_normal_fit, y_normal_fit, label=f'Normal Distribution Fit\nmu={mu:.2f}, sigma={sigma:.2f}')
plt.plot(x_data, y_data, 'o', label='Original Data')
plt.xlabel('x')
plt.ylabel('y')
plt.legend()
plt.title('Normal Distribution Fit')
plt.grid(True)
plt.show()print("学号:2023310143028")
