import numpy as np
import matplotlib.pyplot as plt
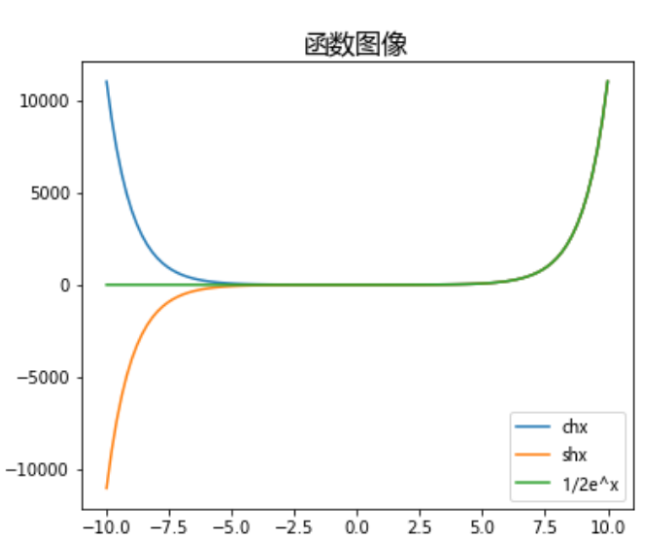
定义 x 的范围
x = np.linspace(-5, 5, 400)
计算三个函数的值
y_cosh = np.cosh(x)
y_sinh = np.sinh(x)
y_half_exp = 0.5 * np.exp(x)
创建图形和坐标轴
plt.figure(figsize=(10, 6))
ax = plt.gca()
绘制函数
ax.plot(x, y_cosh, label=r'$y = \cosh(x)$', color='blue')
ax.plot(x, y_sinh, label=r'$y = \sinh(x)$', color='green')
ax.plot(x, y_half_exp, label=r'$y = \frac{1}{2}e^x$', color='red')
添加图例
plt.legend(loc='upper left')
添加网格
plt.grid(True)
设置标题和坐标轴标签
plt.title('Plot of $\cosh(x)$, $\sinh(x)$, and $\frac{1}{2}e^x$')
plt.xlabel('x')
plt.ylabel('y')
显示图形
plt.show()
2023310143007
