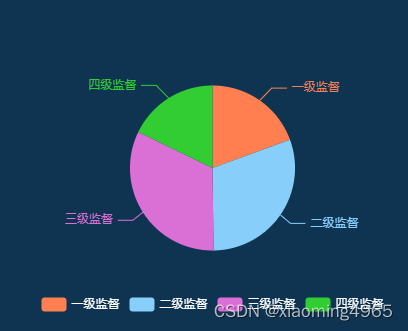
<div class="cake"><div id="cakeChart"></div></div>
import * as echarts from "echarts";mounted() {this.$nextTick(() => {this.getCakeEcharts()})},methods: {// 饼状图getCakeEcharts() {let cakeChart = echarts.init(document.getElementById("cakeChart"));cakeChart.setOption({title: {left: 'center'},tooltip: {trigger: 'item'},legend: {bottom: '5%',left: 'center',textStyle: {color: "#fff", // 更改文本颜色},},color: ['#ff7f50', '#87cefa', '#da70d6', '#32cd32'], // 设置整个图表的颜色数组series: [{name: 'Access From',type: 'pie',radius: '50%',data: [{ value: 48, name: '一级监督' },{ value: 75, name: '二级监督' },{ value: 80, name: '三级监督' },{ value: 44, name: '四级监督' },],}]})window.addEventListener("resize", function () {cakeChart.resize();})},}<style>
.cake {width: 55%;height: 100%;#cakeChart {width: 100%;height: 100%;}}
<style>


