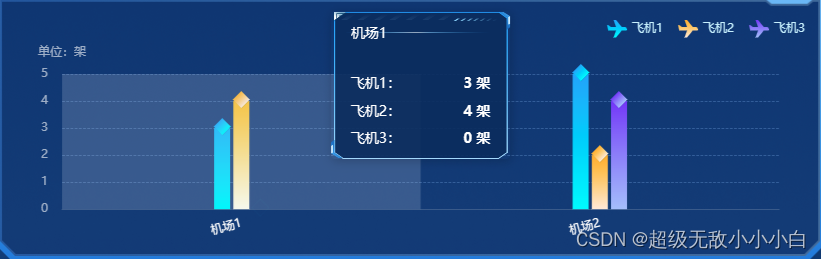
该示例有如下几个特点:
①实现tooltip自定义样式(echarts 实现tooltip提示框样式自定义-CSDN博客)
②数据为0时,顶部四边形不展示
③legend图标设置为自定义图片
【第②也是一个难点,我没有找到其他解决办法,暂时就把color写成函数进行判断,数据为0时设置颜色透明,若有其他更好的解决办法,相互交流呀~】
代码如下:
<template><div class="content"><Echartid="aircraftDistributionChart":options="options":height="height":width="width":clickFn="getDetailInfo"/></div>
</template><script>
import Echart from "@/components/Echart/index.vue";
import * as echarts from "echarts";
export default {name: "aircraftDistributionChart",props: ["width", "height"],components: {Echart},data() {return {type: 0,options: {},xAxisData: ["机场1", "机场2"],legendData: [],seriesData: {"飞机1": [3,5],"飞机2": [4,2],"飞机3": [0,4]},title: "飞机分布",loadingStyle: null,data: [],clientWidth: document.body.clientWidth,colorList: [{offset0: "#00FCFF",offset1: "#00A8FF",},{offset0: "#FFE8D6",offset1: "#FFA800",},{offset0: "#A1C1FF",offset1: "#654BFF",},{offset0: "#05FF00",offset1: "#EAFFD6",},{offset0: "#FFC7DB",offset1: "#FF1485",},{offset0: "#FFB8B2",offset1: "#FF7165",},{offset0: "#E8CCFF",offset1: "#AF82FB",},{offset0: "#CAF6FB",offset1: "#2DDBF0",},{offset0: "#FFF8CB",offset1: "#FFEA53",},{offset0: "#FCC2EE",offset1: "#F970D7",},],};},mounted() {this.getData();},methods: {async getDetailInfo(e) {},async getData() {let that = this;let data = JSON.parse(JSON.stringify(this.seriesData));let tempData = Object.keys(data);this.legendData = [];this.seriesData = [];for (let i = 0; i < tempData.length; i++) {let temKey = tempData[i];let leg = {name: tempData[i],icon: "path://M 869.188 431.844 H 726.763 L 471.95 118.25 h -117.563 l 117.563 313.594 H 231.875 L 131.469 352.25 H 62 l 59.175 236.419 h 350.775 l -117.563 313.594 h 117.563 l 254.813 -313.594 h 196.031 c 16.875 0 39.2062 0 39.2062 -39.2062 c 0 -52.0875 -40.6125 -117.563 -92.8125 -117.563 Z",};let arr = [{name: temKey,type: "bar",barWidth: 16,itemStyle: {normal: {color: new echarts.graphic.LinearGradient(0, 1, 0, 0, [{//只要修改前四个参数就okoffset: 0,color: that.colorList[i].offset0,}, //柱图渐变色{offset: 1,color: that.colorList[i].offset1,},]),barBorderRadius: [0, 0, 0, 0],opacity: "1",},},data: data[temKey],barGap: "20%",},{name: temKey,tooltip: {show: false,},type: "pictorialBar",itemStyle: {normal: {color: function (params) {if (params.value == 0) {return "rgba(255,255,255,0)";} else {return new echarts.graphic.LinearGradient(0,1,0,0,[{//只要修改前四个参数就okoffset: 0,color: that.colorList[i].offset0,}, //柱图渐变色{offset: 1,color: that.colorList[i].offset1,},]);}},borderWidth: 1,borderColor: "rgba(0,252,255,0.6)",opacity: "1",shadowColor: "rgb(0,0,0,0.1)",shadowOffsetX: "0.5",shadowOffsetY: "0.5",},},symbol: "rect",symbolRotate: 45,symbolSize: ["12", "12"],symbolOffset: [(tempData.length - 1) * -9.5 + i * 19, "-8"],symbolPosition: "end",data: data[temKey],z: 3,},];this.legendData.push(leg);this.seriesData = this.seriesData.concat(arr);}this.creatChart();},// 根据屏幕宽度处理数据handleWidth(data) {return ((this.clientWidth / 1920) * data).toFixed(0);},creatChart() {this.options = {tooltip: {trigger: "axis",axisPointer: {type: "shadow"},textStyle: {align: "left"},className: "custom-tooltip-box",formatter: function (params) {let tip = "";for (let i = 0; i < params.length; i++) {let a = "";a = `<div class="span"><span>${params[i].seriesName}:</span><span>${params[i].value} 架</span></div>`;tip = tip + a;}let height = params.length * 3.3 + 5;return `<div class='custom-tooltip-style' style="height: ${height}rem"><span>${params[0].name}</span></br>${tip}`;}},legend: {type: "scroll",data: this.legendData,align: "left",right: 10,textStyle: {color: "#ffffff"},pageTextStyle: {color: "#35ffff",fontSize: this.handleWidth(12)},pageIconColor: "#aaa",pageIconInactiveColor: "#555657",textStyle: {color: "#C7F1FF",fontSize: this.handleWidth(12)},itemWidth: 20,itemHeight: 20,itemGap: 15,// 暂时设置不能点击selectedMode: false},grid: {top: "25%",left: "5%",right: "5%",bottom: "6%",containLabel: true},xAxis: [{type: "category",nameTextStyle: {color: "#5C6C75"},offset: 6,axisLine: {show: true,lineStyle: {color: "#355d8d" // 坐标轴线线的颜色}},splitLine: {show: false},axisTick: {show: false},axisLabel: {show: true,textStyle: {color: "#fff" //X轴文字颜色},fontSize: "12", //x轴字体大小rotate: 15},data: this.xAxisData}],yAxis: [{type: "value",name: "单位:架",nameTextStyle: {fontSize: this.handleWidth(12),color: "#FFFFFF99"},axisLabel: {show: true,margin: 14,fontSize: 12,textStyle: {color: "#FFFFFF99"}},axisTick: {show: false},axisLine: {show: false},splitLine: {show: true,lineStyle: {color: "#87C2FF66",width: 0.7,type: "dashed"}}}],series: this.seriesData}}}
};
</script><style lang="scss" scoped>
.content {width: 100%;height: 100%;margin-top: 1.5rem;
}
::v-deep .custom-tooltip-box {padding: 0 !important;border: none !important;background-color: transparent !important;// 给子盒子自定义样式.custom-tooltip-style {width: 18rem;min-height: 8rem;background: url("../../../../assets/images/tooltip-bg-big1.png") no-repeatcenter center;background-size: 100% 100%;color: #fff;display: flex;flex-direction: column;justify-content: space-around;padding: 1rem 2rem;font-size: 1.4rem;.span {display: flex;justify-content: space-between;margin-top: 0.5rem;:last-child {font-weight: 600;font-size: 1.4rem;}}}
}
</style>
效果图如下:
该示例中的属性可在官网中查阅,若有其他疑问可私信留言互相交流学习~