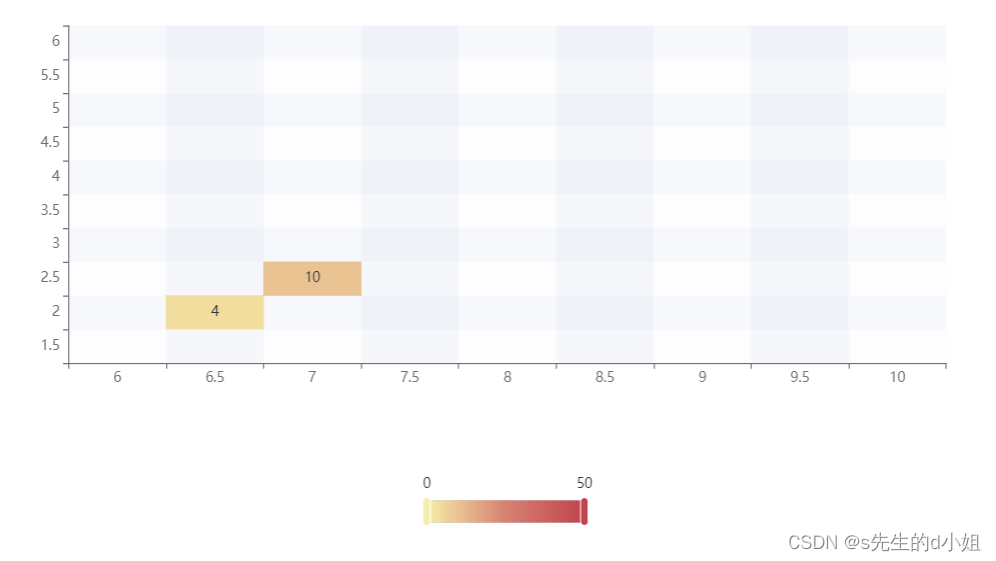
// X坐标轴
const xValue = ['6','6.5','7','7.5','8','8.5','9','9.5','10'];
//Y坐标轴
const yValue = ['1.5','2','2.5','3','3.5','4','4.5','5','5.5','6'];
// 需要展示的值【X坐标,Y坐标,展示的数值】
const data = [[6.5,2,4], [7, 2.5, 10]] ;
// 坐标轴及数值存在小数时,需要进行转化,否则当数据过多时会出现覆盖问题
const  z = data.map(function (item) {const xAx = ['6','6.5','7','7.5','8','8.5','9','9.5','10'];const yAx = ['1.5','2','2.5','3','3.5','4','4.5','5','5.5','6'];const xValue = item[0].toString();const yValue = item[1].toString();const xIndex = xAx.indexOf(xValue);const yIndex = yAx.indexOf(yValue);return [xIndex, yIndex, item[2] || '-'];});
option = {tooltip: {position: 'top'//tip展示的位置},grid: {height: '50%',//echarts高度top: '10%',//距离顶部的距离},xAxis: {type: 'category',data: xValue,splitArea: {show: true//斑马纹展示}},yAxis: {type: 'category',data: yValue,splitArea: {show: true//斑马纹展示}},visualMap: {min: 0,//最小值max: 50,//最大值calculable: true,//是否显示数值范围orient: 'horizontal',left: 'center',bottom: '15%'},series: [{name: 'Punch Card',type: 'heatmap',data: z,label: {show: true//是否在图上显示数值},emphasis: {itemStyle: {shadowBlur: 10,shadowColor: 'rgba(0, 0, 0, 0.5)'}}}]
};

