一、说明
本文是一个系列文章的第二部分,本文将用股票数据进行时间序列分析为例,对时间分析的方法、过程,进行详细阐述。
二、前文章节
在文章第一部分种:【数据挖掘】时间序列模型处理(一)_无水先生的博客-CSDN博客
七、时序模型示例:预测股票价格
我们将使用新德国基金(GF)的历史股价来尝试预测未来五个交易日的收盘价。(您可以与 数据集和笔记本。
7.1 导入数据
import numpy as np
import pandas as pd
import matplotlib.pyplot as plt
import seaborn as sns
sns.set()from sklearn.metrics import r2_score, median_absolute_error, mean_absolute_error
from sklearn.metrics import median_absolute_error, mean_squared_error, mean_squared_log_errorfrom scipy.optimize import minimize
import statsmodels.tsa.api as smt
import statsmodels.api as smfrom tqdm import tqdm_notebookfrom itertools import productdef mean_absolute_percentage_error(y_true, y_pred):return np.mean(np.abs((y_true - y_pred) / y_true)) * 100import warnings
warnings.filterwarnings('ignore')%matplotlib inlineDATAPATH = 'data/stock_prices_sample.csv'data = pd.read_csv(DATAPATH, index_col=['DATE'], parse_dates=['DATE'])
data.head(10)
首先,我们将导入一些在整个分析过程中有帮助的库。此外,我们需要定义平均百分比误差 (MAPE),因为这将是我们的误差指标。
然后,我们将导入数据集和前十个条目。您应该获得:

如您所见,我们有一些条目涉及与新德国基金(GF)不同的股票。此外,我们有一个关于日内信息的条目,但我们只想要日终 (EOD) 信息。
7.2 清理数据
data = data[data.TICKER != 'GEF']
data = data[data.TYPE != 'Intraday']drop_cols = ['SPLIT_RATIO', 'EX_DIVIDEND', 'ADJ_FACTOR', 'ADJ_VOLUME', 'ADJ_CLOSE', 'ADJ_LOW', 'ADJ_HIGH', 'ADJ_OPEN', 'VOLUME', 'FREQUENCY', 'TYPE', 'FIGI']data.drop(drop_cols, axis=1, inplace=True)data.head()
首先,我们将删除不需要的条目。然后,我们将删除不需要的列,因为我们只想关注股票的收盘价。
准备进行数据分析:for exploratory data analysis.
7.3. 指数移动平均(EDA)
# Plot closing priceplt.figure(figsize=(17, 8))
plt.plot(data.CLOSE)
plt.title('Closing price of New Germany Fund Inc (GF)')
plt.ylabel('Closing price ($)')
plt.xlabel('Trading day')
plt.grid(False)
plt.show()
我们将绘制数据集整个时间段的收盘价。
您应该获得:

显然,这不是一个静止的过程,很难判断是否存在某种季节性。
7.4. 移动平均线
让我们使用移动平均模型来平滑我们的时间序列。为此,我们将依靠一个辅助函数,该函数将在指定的时间窗口内运行移动平均模型,并将绘制结果平滑曲线:
def plot_moving_average(series, window, plot_intervals=False, scale=1.96):rolling_mean = series.rolling(window=window).mean()plt.figure(figsize=(17,8))plt.title('Moving average\n window size = {}'.format(window))plt.plot(rolling_mean, 'g', label='Rolling mean trend')#Plot confidence intervals for smoothed valuesif plot_intervals:mae = mean_absolute_error(series[window:], rolling_mean[window:])deviation = np.std(series[window:] - rolling_mean[window:])lower_bound = rolling_mean - (mae + scale * deviation)upper_bound = rolling_mean + (mae + scale * deviation)plt.plot(upper_bound, 'r--', label='Upper bound / Lower bound')plt.plot(lower_bound, 'r--')plt.plot(series[window:], label='Actual values')plt.legend(loc='best')plt.grid(True)#Smooth by the previous 5 days (by week)
plot_moving_average(data.CLOSE, 5)#Smooth by the previous month (30 days)
plot_moving_average(data.CLOSE, 30)#Smooth by previous quarter (90 days)
plot_moving_average(data.CLOSE, 90, plot_intervals=True)
使用五天的时间窗口,我们得到:

我们几乎看不到趋势,因为它太接近实际曲线了。让我们平滑上个月和上一季度来比较结果。


现在趋势更容易发现。请注意 30 天和 90 天趋势在结束时如何显示下降曲线。这可能意味着该股票可能会在接下来的几天内下跌。
7.5. 指数平滑
现在,让我们使用指数平滑来查看它是否可以获得更好的趋势。
def exponential_smoothing(series, alpha):result = [series[0]] # first value is same as seriesfor n in range(1, len(series)):result.append(alpha * series[n] + (1 - alpha) * result[n-1])return resultdef plot_exponential_smoothing(series, alphas):plt.figure(figsize=(17, 8))for alpha in alphas:plt.plot(exponential_smoothing(series, alpha), label="Alpha {}".format(alpha))plt.plot(series.values, "c", label = "Actual")plt.legend(loc="best")plt.axis('tight')plt.title("Exponential Smoothing")plt.grid(True);plot_exponential_smoothing(data.CLOSE, [0.05, 0.3])在这里,我们使用 0.05 和 0.3 作为平滑因子的值。随意尝试其他值,看看结果如何。
应用于模型的指数平滑。|图片:马可·佩谢罗
如您所见,alpha 值 0.05 平滑了曲线,同时拾取了大部分上升和下降趋势。
现在,让我们使用双指数平滑。
7.6. 双指数平滑
def double_exponential_smoothing(series, alpha, beta):result = [series[0]]for n in range(1, len(series)+1):if n == 1:level, trend = series[0], series[1] - series[0]if n >= len(series): # forecastingvalue = result[-1]else:value = series[n]last_level, level = level, alpha * value + (1 - alpha) * (level + trend)trend = beta * (level - last_level) + (1 - beta) * trendresult.append(level + trend)return resultdef plot_double_exponential_smoothing(series, alphas, betas):plt.figure(figsize=(17, 8))for alpha in alphas:for beta in betas:plt.plot(double_exponential_smoothing(series, alpha, beta), label="Alpha {}, beta {}".format(alpha, beta))plt.plot(series.values, label = "Actual")plt.legend(loc="best")plt.axis('tight')plt.title("Double Exponential Smoothing")plt.grid(True)plot_double_exponential_smoothing(data.CLOSE, alphas=[0.9, 0.02], betas=[0.9, 0.02])你会得到:

应用于模型的双指数平滑。|图片:马可·佩谢罗
再次,尝试不同的 alpha 和 beta 组合以获得更好看的曲线。
7.7. 建模
如前所述,我们必须将我们的系列变成一个静止的过程才能对其进行建模。因此,让我们应用 Dickey-Fuller 测试来查看它是否是一个平稳过程:
def tsplot(y, lags=None, figsize=(12, 7), syle='bmh'):if not isinstance(y, pd.Series):y = pd.Series(y)with plt.style.context(style='bmh'):fig = plt.figure(figsize=figsize)layout = (2,2)ts_ax = plt.subplot2grid(layout, (0,0), colspan=2)acf_ax = plt.subplot2grid(layout, (1,0))pacf_ax = plt.subplot2grid(layout, (1,1))y.plot(ax=ts_ax)p_value = sm.tsa.stattools.adfuller(y)[1]ts_ax.set_title('Time Series Analysis Plots\n Dickey-Fuller: p={0:.5f}'.format(p_value))smt.graphics.plot_acf(y, lags=lags, ax=acf_ax)smt.graphics.plot_pacf(y, lags=lags, ax=pacf_ax)plt.tight_layout()tsplot(data.CLOSE, lags=30)# Take the first difference to remove to make the process stationary
data_diff = data.CLOSE - data.CLOSE.shift(1)tsplot(data_diff[1:], lags=30)
您应该看到:
Dicke-Fuller检验应用于揭示非平稳模型的模型。
通过 Dickey-Fuller 检验,时间序列毫不奇怪地是非平稳的。此外,查看自相关图,我们看到它非常高,似乎没有明显的季节性。
为了摆脱高自相关并使过程平稳,让我们采用第一个差异(代码块中的第 23 行)。我们简单地从自身中减去滞后一天的时间序列,得到:

我们的系列现在是固定的,我们可以开始建模了。
7.8. 萨里马
#Set initial values and some bounds
ps = range(0, 5)
d = 1
qs = range(0, 5)
Ps = range(0, 5)
D = 1
Qs = range(0, 5)
s = 5#Create a list with all possible combinations of parameters
parameters = product(ps, qs, Ps, Qs)
parameters_list = list(parameters)
len(parameters_list)# Train many SARIMA models to find the best set of parameters
def optimize_SARIMA(parameters_list, d, D, s):"""Return dataframe with parameters and corresponding AICparameters_list - list with (p, q, P, Q) tuplesd - integration orderD - seasonal integration orders - length of season"""results = []best_aic = float('inf')for param in tqdm_notebook(parameters_list):try: model = sm.tsa.statespace.SARIMAX(data.CLOSE, order=(param[0], d, param[1]),seasonal_order=(param[2], D, param[3], s)).fit(disp=-1)except:continueaic = model.aic#Save best model, AIC and parametersif aic < best_aic:best_model = modelbest_aic = aicbest_param = paramresults.append([param, model.aic])result_table = pd.DataFrame(results)result_table.columns = ['parameters', 'aic']#Sort in ascending order, lower AIC is betterresult_table = result_table.sort_values(by='aic', ascending=True).reset_index(drop=True)return result_tableresult_table = optimize_SARIMA(parameters_list, d, D, s)#Set parameters that give the lowest AIC (Akaike Information Criteria)
p, q, P, Q = result_table.parameters[0]best_model = sm.tsa.statespace.SARIMAX(data.CLOSE, order=(p, d, q),seasonal_order=(P, D, Q, s)).fit(disp=-1)print(best_model.summary())
现在,对于 SARIMA,我们首先需要定义一些参数和其他参数的值范围,以生成 p、q、d、P、Q、D、S 的所有可能组合的列表。
现在,在上面的代码单元格中,我们有 625 种不同的组合。我们将尝试每种组合,并用每种组合训练 SARIMA,以找到性能最佳的模型。这可能需要一段时间,具体取决于计算机的处理能力。
完成此操作后,我们将打印出最佳模型的摘要,您应该看到:

我们最终可以预测未来五个交易日的收盘价,并评估模型的平均绝对百分比误差(MAPE)。
在这种情况下,我们的MAPE为0.79%,这是非常好的。
有关数据科学的更多信息C 均值聚类说明
7.9. 将预测价格与实际数据进行比较
# Make a dataframe containing actual and predicted prices
comparison = pd.DataFrame({'actual': [18.93, 19.23, 19.08, 19.17, 19.11, 19.12],'predicted': [18.96, 18.97, 18.96, 18.92, 18.94, 18.92]}, index = pd.date_range(start='2018-06-05', periods=6,))#Plot predicted vs actual priceplt.figure(figsize=(17, 8))
plt.plot(comparison.actual)
plt.plot(comparison.predicted)
plt.title('Predicted closing price of New Germany Fund Inc (GF)')
plt.ylabel('Closing price ($)')
plt.xlabel('Trading day')
plt.legend(loc='best')
plt.grid(False)
plt.show()
现在,为了将我们的预测与实际数据进行比较,我们可以从雅虎财经获取财务数据并创建一个数据帧。
然后,我们制作一个图来查看我们离实际收盘价有多远:
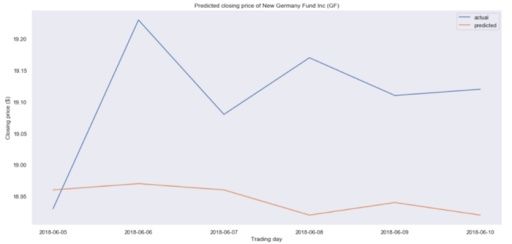
看来我们的预测有点偏差。事实上,预测的价格基本上是持平的,这意味着我们的模型可能表现不佳。
同样,这不是由于我们的程序,而是由于预测股票价格基本上是不可能的。
从第一个项目中,我们学习了在使用SARIMA建模之前使时间序列静止的整个过程。这是一个漫长而乏味的过程,需要大量的手动调整。
现在,让我们介绍Facebook的先知。它是Python和R中可用的预测工具。该工具允许专家和非专家以最小的努力生成高质量的预测。
