一. 前言
Bootstrap是一个流行的前端框架,而ECharts是一个流行的可视化库。
Bootstrap可以用来设计网站和应用程序的用户界面,而ECharts可以用来创建交互式和可视化的图表。
chart.js中文文档:http://www.bootcss.com/p/chart.js/docs/
二. 进阶使用
基本使用已经在前文有过相关介绍,链接:https://blog.csdn.net/qq_43030934/article/details/131540606
本文是基于Django+bootstrap+echart插件的一个进阶使用,基本的用法就不做过多介绍了
二. 效果图
1.日活日增统计
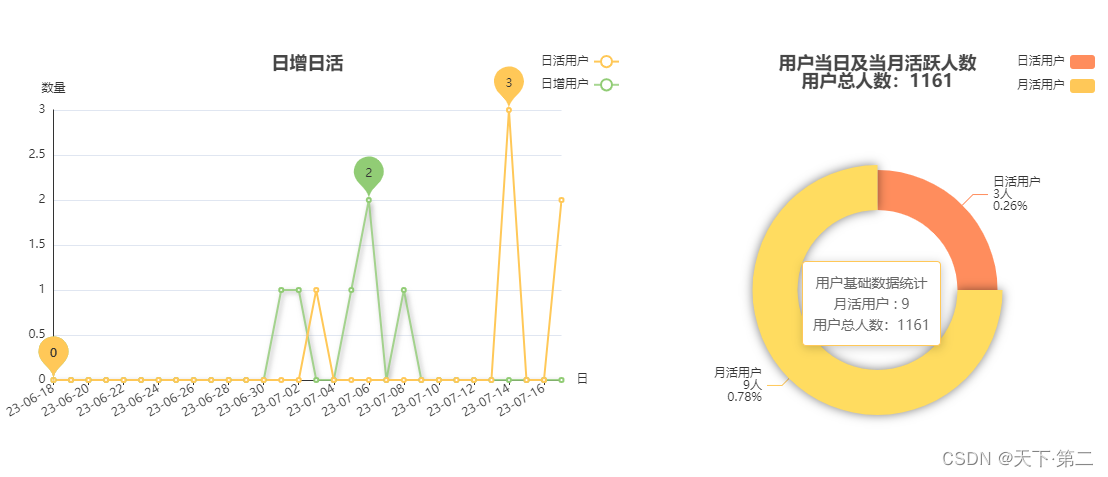
2. 年月数据统计
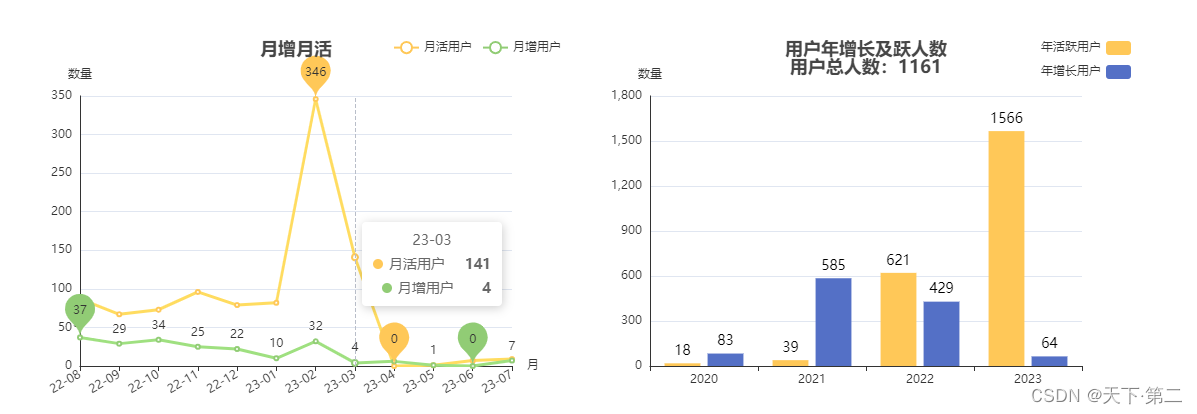
三. 示例代码
废话不多说了,直接上代码,
1. 前端
代码是根据相关项目编写的,大家可根据自己的项目进行参考使用
{% extends "base.html" %} {% load static %}{% block main %}{#    <script src="../../../../static/js/echarts-v5.1.2.min.js"></script>#}{% if 'is_superuser' in permissions.keys %}<!-- daily active users statistics start --><section class="section" style="padding: 100px 0 30px 0"><div class="container"><div class="row justify-content-center"><div class="col-12 text-center"><div class="section-title mb-2"><h4 class="title mb-4">用户数据统计</h4></div></div><!--end col--></div><!--end row--><div class="row mt-4 pt-2 position-relative" id="userDailyData" style="z-index: 1;"><div class="col-lg-7 col-6 mt-4 pt-2"><div class="counter-box text-center"><div id="userDailyIncrease" style="width:auto;height:400px;"></div></div><!--end counter box--></div><div class="col-lg-5 col-6 mt-4 pt-2"><div class="counter-box text-center"><div id="userBaseData" style="width:auto;height:400px;"></div></div><!--end counter box--></div></div><!--end row--><div class="feature-posts-placeholder"></div></div><!--end container--></section><!--end section--><!-- daily active users statistics End --><!-- monthly/year increase users statistics start --><section class="section" style="padding: 30px 0 100px 0"><div class="container"><div class="row mt-4 pt-2 position-relative" style="z-index: 1;"><div class="col-lg-6 col-6 mt-4 pt-2"><div class="counter-box text-center"><div id="userMonthlyIncrease" style="width:auto;height:400px;"></div></div><!--end counter box--></div><div class="col-lg-6 col-6 mt-4 pt-2"><div class="counter-box text-center"><div id="userYearIncrease" style="width:auto;height:400px;"></div></div><!--end counter box--></div></div><!--end row--><div class="feature-posts-placeholder"></div></div><!--end container--></section><!--end section--><!-- monthly/year increase users statistics  End -->{% endif %}<!-- Document change achievement Start --><section class="section  bg-light"><div class="container"><div class="row mt-4 pt-2 position-relative" id="counter" style="z-index: 1;"><div class="col-md col-6 mt-4 pt-2"><div class="counter-box text-center"><img src="{% static 'images/homepage/Asset260.svg' %}" class="avatar avatar-small" alt=""><h2 class="mb-0 mt-4"><span class="counter-value"data-count="97">{{ quarterData.requestTotal }}</span></h2><h6 class="counter-head text-muted">{{ quarterData.currentQuarter }} Change requests</h6></div><!--end counter box--></div><div class="col-md col-6 mt-4 pt-2"><div class="counter-box text-center"><img src="{% static 'images/homepage/Asset189.svg' %}" class="avatar avatar-small" alt=""><h2 class="mb-0 mt-4"><span class="counter-value"data-count="15">{{ quarterData.completed }}</span></h2><h6 class="counter-head text-muted">Completed</h6></div><!--end counter box--></div><div class="col-md col-6 mt-4 pt-2"><div class="counter-box text-center"><img src="{% static 'images/homepage/Asset192.svg' %}" class="avatar avatar-small" alt=""><h2 class="mb-0 mt-4"><span class="counter-value"data-count="98">{{ quarterData.percentageComplete }}</span>%</h2><h6 class="counter-head text-muted">Request Complete</h6></div><!--end counter box--></div></div><!--end row--><div class="feature-posts-placeholder"></div></div><!--end container--></section><!--end section--><!-- Document change achievement End -->
{% endblock %}{% block script %}<script>var MyViewVar = {userCurActiveData: {{ userCurActiveData|safe }},usersDataByDaily: {{ usersDataByDaily|safe }},usersDataByMonthly: {{ usersDataByMonthly|safe }},usersDataByYears: {{ usersDataByYears|safe }},}console.log(MyViewVar)var userDailyIncreaseChart = echarts.init(document.getElementById('userDailyIncrease'));userDailyIncreaseChart.setOption({title: {text: '日增日活',x: 'center'},// 图表图例legend: {orient: 'vertical',data: ['日活用户', '日增用户',],left: 'right',},xAxis: {name: '日',type: 'category',data: MyViewVar.usersDataByDaily.date_list,boundaryGap: false,axisLabel: {inside: false, //刻度标签是否朝内,false朝外interval: 1, // 设置标签全部显示rotate: 30, // 设置标签旋转角度maxInterval: 1000, // 设置刻度间隔},axisLine: {lineStyle: {color: '#333',type: 'solid',},}},yAxis: {name: '数量',type: 'value',axisLine: {show: true,    // 是否显示坐标轴轴线lineStyle: {color: '#333',    // 坐标轴线线的颜色type: 'solid',    // 坐标轴线线的类型(solid实线类型;dashed虚线类型;dotted点状类型)},},},tooltip: {trigger: 'axis',axisPointer: {type: 'cross'}},series: [{name: '日增用户',data: MyViewVar.usersDataByDaily.user_increase_count_list,type: 'line',itemStyle: {color: '#91CC75',},markPoint: {data: [{type: 'max', name: '最大值'},{type: 'min', name: '最小值'}]},lineStyle: {color: '#91CC75', //线颜色type: 'solid', //线的类型opacity: 0.8, //线透明度shadowBlur: 5, //阴影模糊度shadowColor: '#999', //阴影颜色shadowOffsetX: 2, //阴影X轴偏移量shadowOffsetY: 2, //阴影Y轴偏移量radius: 100 //曲线圆角半径},},{name: '日活用户',type: 'line',data: MyViewVar.usersDataByDaily.user_active_count_list,itemStyle: {color: '#FFC858',},markPoint: {data: [{type: 'max', name: '最大值'},{type: 'min', name: '最小值'}]},lineStyle: {color: '#FFC858', //线颜色},},]});var userBaseDataChart = echarts.init(document.getElementById('userBaseData'));//定义饼图数据var data = [{value: MyViewVar.userCurActiveData.dailyActiveCount, name: '日活用户'},{value: MyViewVar.userCurActiveData.monthlyActiveCount, name: '月活用户'},];//定义饼图配置项var option = {title: {text: '用户当日及当月活跃人数\n' + '用户总人数:' + MyViewVar.userCurActiveData.totalCount,x: 'center'},tooltip: {trigger: 'item',formatter: "{a} <br/>{b} : {c}<br/>" + "用户总人数:" + MyViewVar.userCurActiveData.totalCount},legend: {orient: 'vertical',left: 'right',data: ['日活用户', '月活用户']},series: [{name: '用户基础数据统计',type: 'pie',radius: ['40%', '60%'],center: ['50%', '60%'],data: data,label: {show: true,formatter: function (params) {// 计算总数var total = MyViewVar.userCurActiveData.totalCount;// 显示数据项名称和百分比return params.name + '\n' + params.value + '人' + '\n' + (params.value / total * 100).toFixed(2) + '%';}},itemStyle: {emphasis: {shadowBlur: 10,shadowOffsetX: 0,shadowColor: 'rgba(0, 0, 0, 0.5)'}},color: ['#FF8D5D', '#FFC858']}]};//渲染饼图userBaseDataChart.setOption(option);var userMonthlyIncreaseChart = echarts.init(document.getElementById('userMonthlyIncrease'));userMonthlyIncreaseChart.setOption({title: {text: '月增月活',x: 'center'},// 图表图例legend: {data: ['月活用户', '月增用户'],left: 'right',},xAxis: {name: '月',type: 'category',data: MyViewVar.usersDataByMonthly.month_list,boundaryGap: false,axisLabel: {inside: false, //刻度标签是否朝内,false朝外interval: 0, // 设置标签全部显示rotate: 30, // 设置标签旋转角度maxInterval: 1000, // 设置刻度间隔},axisLine: {lineStyle: {color: '#333',type: 'solid',},},},yAxis: {name: '数量',type: 'value',axisLine: {show: true,    // 是否显示坐标轴轴线lineStyle: {color: '#333',    // 坐标轴线线的颜色type: 'solid',    // 坐标轴线线的类型(solid实线类型;dashed虚线类型;dotted点状类型)},},},tooltip: {trigger: 'axis',},series: [{name: '月活用户',type: 'line',data: MyViewVar.usersDataByMonthly.user_active_count_list,itemStyle: {color: '#FFC858',},markPoint: {data: [{type: 'max', name: '最大值'},{type: 'min', name: '最小值'}]},lineStyle: {color: '#FFC858', //线颜色},},{name: '月增用户',data: MyViewVar.usersDataByMonthly.user_increase_count_list,type: 'line',itemStyle: {color: '#91CC75',},label: {show: true,formatter: function (params) {return params.value;}},markPoint: {data: [{type: 'max', name: '最大值'},{type: 'min', name: '最小值'}]},lineStyle: {color: '#91CC75', //线颜色},},]});var userYearIncreaseChart = echarts.init(document.getElementById('userYearIncrease'));userYearIncreaseChart.setOption({title: {text: '用户年增长及跃人数\n' + '用户总人数:' + MyViewVar.userCurActiveData.totalCount,x: 'center'},tooltip: {},legend: {orient: 'vertical',data: ['年活跃用户', '年增长用户'],left: 'right',},xAxis: {axisLine: {show: true,    // 是否显示坐标轴轴线lineStyle: {color: '#333',    // 坐标轴线线的颜色type: 'solid',    // 坐标轴线线的类型(solid实线类型;dashed虚线类型;dotted点状类型)},},data: MyViewVar.usersDataByYears.year_list,},yAxis: {name: '数量',type: 'value',axisLine: {show: true,    // 是否显示坐标轴轴线lineStyle: {color: '#333',    // 坐标轴线线的颜色type: 'solid',    // 坐标轴线线的类型(solid实线类型;dashed虚线类型;dotted点状类型)},},},series: [{name: '年活跃用户',type: 'bar',data: MyViewVar.usersDataByYears.user_active_count_list,itemStyle: {color: '#FFC858',},},{name: '年增长用户',type: 'bar',data: MyViewVar.usersDataByYears.user_increase_count_list,},],label: {show: true,position: 'top',  // 在柱形顶部显示标签formatter: '{c}',  // 数值显示格式color: '#000',  // 标签颜色fontSize: 14,  // 标签字体大小},})</script>
{% endblock %}
2. 后端代码
后端代码接口使用的技术栈是Django+ORM
代码仅供参考,大家可自行根据自己项目的业务进行参考使用
class DataStatisticsView(LoginRequiredJSONMixin, APIView):def get(self, request):permissions = get_user_permissions(request.user.id)quarterData = get_quarter_data_statistics(CP_Register)# 获取当前日期now_date = datetime.date.today()userCurActiveData = self.get_cur_user_active_data(now_date)usersDataByDaily = self.get_increase_and_active_users_by_daily(now_date)usersDataByMonthly = self.get_increase_and_active_users_by_monthly(now_date)usersDataByYears = self.get_increase_and_active_users_by_years(now_date)context = {'permissions': permissions,'quarterData': quarterData,'userCurActiveData': userCurActiveData,'usersDataByDaily': usersDataByDaily,'usersDataByMonthly': usersDataByMonthly,'usersDataByYears': usersDataByYears,}return render(request, 'teams/my_dashboard/statistics/data_statistics.html', context)def get_increase_and_active_users_by_years(self, now_date):"""数据库中按年增长及年活跃人数"""# 按年增长统计用户users_per_year = User.objects.annotate(year=ExtractYear('date_joined')).values('year').annotate(total=Count('id'))user_increase_count_list = []year_list = []for user in users_per_year:user_increase_count_list.append(user['total'])year_list.append(user['year'])# 按年统计活跃人数users_per_year = User.objects.annotate(year=ExtractYear('last_login')).values('year').annotate(total=Count('id'))user_active_count_list = []for user in users_per_year:user_active_count_list.append(int(user['total']) * ActiveCoefficient.year_active)usersDataByYears = {'user_increase_count_list': user_increase_count_list,'user_active_count_list': user_active_count_list,'year_list': year_list,}return usersDataByYearsdef get_increase_and_active_users_by_monthly(self, now_date):"""近一年用户月增及月活跃数据sqlite按当月统计一年用户的数量sql:SELECT DATE('now', 'start of month') AS end_date,DATE('now', '-12 months', 'start of month') AS start_date;SELECT strftime('%Y-%m', date_joined) AS month,COUNT(id) AS countFROM auth_userWHERE date_joined >= DATE('now', '-12 months', 'start of month')GROUP BY monthORDER BY month;"""user_increase_count_list = []user_active_count_list = []month_list = []# FIXME--bug:某月用户数量为0时无数据"""end_date = now_date.replace(day=30)start_date = (end_date - datetime.timedelta(days=365)).replace(day=1){'user_count_list': [33, 37, 30, 35, 25, 22, 11, 35, 4, 6, 1, 7], 'month_list': ['22-07', '22-08', '22-09', '22-10', '22-11', '22-12', '23-01', '23-02', '23-03', '23-04', '23-05', '23-07']}users_last_year = User.objects.filter(date_joined__range=(start_date, end_date)).annotate(month=TruncMonth('date_joined')).values('month').annotate(count=Count('id'))for user in users_last_year:user_count_list.append(user['count'])month_list.append(user['month'].strftime('%y-%m'))"""# 计算往前12个月的日期时间,计算月增月活数据for i in range(12):# 当月起始时间和月末时间month_first_day = (now_date - datetime.timedelta(days=365 * i / 12)).replace(day=1)month_last_day = (month_first_day + datetime.timedelta(days=32)).replace(day=1) - datetime.timedelta(days=1)month_increase_count = User.objects.filter(date_joined__range=(month_first_day, month_last_day)).count()month_list.append(month_first_day.strftime('%y-%m'))user_increase_count_list.append(month_increase_count)moth_active_count = int(User.objects.filter(last_login__range=(month_first_day, month_last_day)).count() * ActiveCoefficient.monthly_active)user_active_count_list.append(moth_active_count)usersDataByMonthly = {'user_increase_count_list': user_increase_count_list[::-1],'user_active_count_list': user_active_count_list[::-1],'month_list': month_list[::-1],}return usersDataByMonthlydef get_increase_and_active_users_by_daily(self, now_date):"""近一月用户日增日活数据"""# 获取一个月前日期start_date = now_date - datetime.timedelta(days=30)date_list = []user_increase_count_list = []user_active_count_list = []for i in range(1, 31):# 循环遍历获取当天日期cur_date = start_date + datetime.timedelta(days=i)next_date = start_date + datetime.timedelta(days=i + 1)day_increase_count = User.objects.filter(last_login__range=(cur_date, next_date)).count()date_list.append(cur_date.strftime('%y-%m-%d'))user_increase_count_list.append(day_increase_count)day_active_count = int(User.objects.filter(last_login__range=(cur_date, next_date)).count() * ActiveCoefficient.daily_active)user_active_count_list.append(day_active_count)dailyIncreaseUsers = {'date_list': date_list,'user_increase_count_list': user_increase_count_list,'user_active_count_list': user_active_count_list,}return dailyIncreaseUsersdef get_cur_user_active_data(self, now_date):"""当日及当月活跃数据"""# 日活用户dailyActiveCount = User.objects.filter(last_login__gte=now_date).count()# 月活用户first_day_of_month = datetime.date(now_date.year, now_date.month, 1)last_day_of_month = datetime.date(now_date.year, now_date.month + 1, 1) - datetime.timedelta(days=1)monthlyActiveCount = User.objects.filter(last_login__range=(first_day_of_month, last_day_of_month)).count()# 用户总数totalCount = User.objects.all().count()userCurActiveData = {'dailyActiveCount': int(dailyActiveCount * ActiveCoefficient.daily_active),'monthlyActiveCount': int(monthlyActiveCount * ActiveCoefficient.monthly_active),'totalCount': totalCount,'date': now_date.strftime('%Y-%m-%d'),}return userCurActiveData
utils.py
class ActiveCoefficient:daily_active = 1.5monthly_active = 1.5year_active = 3def get_user_permissions(user_id):from registration.models import UserProfileu_pro = UserProfile.objects.filter(user_id=user_id).first()permissions = OrderedDict()if u_pro.is_superuser:permissions['is_superuser'] = '超级管理员'if u_pro.is_team_leader:permissions['is_team_leader'] = '团队负责人'if u_pro.is_ele_feature_extension_admin:permissions['ele_feature_extension_admin'] = '普通管理员'if u_pro.is_es_feature_extension_admin:permissions['es_feature_extension_admin'] = '普通管理员'if u_pro.role:permissions = get_role_permission(u_pro.role.id, permissions)return permissionsdef get_quarter_data_statistics(obj):"""季度发布数据统计"""today = datetime.date.today()current_quarter = (today.month - 1) // 3 + 1# 当前年份季度current_year_quarter = str(today.year) + 'Q{}'.format(str(current_quarter))total = obj.objects.filter(schedule__startswith=current_year_quarter).count()completed_cnt = obj.objects.filter(schedule__startswith=current_year_quarter).filter(Q(decision__in=['', 'Released']) | Q(decision__isnull=True)).count()try:percentageComplete = int(completed_cnt / total * 100)except Exception as e:percentageComplete = 0logger.info('homePage error :{}'.format(e))QuarterData = {'requestTotal': total,'percentageComplete': percentageComplete,'completed': completed_cnt,'currentQuarter': 'Q{}'.format(current_quarter),}return QuarterData
以上就是Django + Bootstrap - 【echart】 统计图表进阶使用-统计用户日活日增、月活月增等数据的基本使用,希望对你有所帮助!

