一、Prometheus简介
Prometheus 是一个开源的系统监控和警报工具,用于收集、存储和查询时间序列数据。它专注于监控应用程序和基础设施的性能和状态,并提供丰富的查询语言和灵活的告警机制
1、Prometheus基本介绍
- 数据模型:Prometheus 使用时间序列数据模型来存储监控数据。时间序列由一个唯一的指标名称和一组键值对标签组成,代表了某个指标在特定时间点的数值。这种数据模型非常适合度量指标的变化和趋势。
- 数据采集:Prometheus 支持多种数据采集方式。它可以直接采集应用程序的指标数据,也可以通过各种监控插件和集成来获取系统和网络层面的指标数据。采集的数据通过 HTTP 或其他协议发送给 Prometheus 服务器进行存储和处理。
- 存储和查询:Prometheus 使用本地存储方式,将采集的时间序列数据保存在本地磁盘上。它提供了灵活而高效的查询语言(PromQL),可以对存储的数据进行实时查询和聚合操作,以便生成有关监控指标的图表、报表和警报。
- 告警和警报规则:Prometheus 具有强大的告警功能,可以根据指标的阈值、表达式和持续时间等条件设置警报规则。当条件满足时,它可以触发警报并发送通知,如发送电子邮件、短信或通过集成的通知服务进行报警。
- 可视化和集成:虽然 Prometheus 本身提供了基本的查询和图表功能,但它也可以与其他工具和服务集成,如 Grafana,用于更丰富的数据可视化和仪表板展示。
2.Prometheus特点
- 多维度数据模型:Prometheus 采用了多维度的时间序列数据模型,每个时间序列都由指标名称和一组标签键值对组成。这种数据模型使得用户可以灵活地对监控数据进行多维度的查询和聚合,以获取更准确和细粒度的监控指标。
- 高效的数据采集:Prometheus 支持多种灵活的数据采集方式。它可以通过客户端库(例如Prometheus 客户端库)直接采集应用程序的指标数据,也可以通过各种监控插件和集成方式获取系统、网络和第三方服务的指标数据。数据采集的过程高效而可靠,可以适应各种规模和复杂度的监控场景。
- 强大的查询语言:Prometheus 提供了强大而灵活的查询语言(PromQL),用于对存储的监控数据进行实时查询和聚合操作。PromQL 支持范围查询、聚合函数、算术运算和向量操作等,使得用户能够方便地分析和提取所需的监控指标。
- 动态监控和自动发现:Prometheus 支持动态监控和自动发现机制。它可以自动探测和监控新加入集群的目标,例如新部署的应用实例或新增的节点。通过定义合适的自动发现规则,Prometheus 能够及时识别和监控新的目标,实现动态的监控配置和管理。
- 灵活的告警机制:Prometheus 具备强大的告警功能,用户可以定义灵活的警报规则,并根据阈值、表达式和持续时间等条件触发警报。它能够及时发送通知,如电子邮件、短信或调用API,以便运维人员能够快速响应和解决潜在的问题。
- 生态系统和集成:Prometheus 拥有丰富的生态系统和广泛的集成能力。它可以与其他工具和服务集成,如 Grafana 用于可视化、Alertmanager 用于告警通知、Exporter 用于采集非Prometheus 格式的指标数据等。这种集成能力使得用户能够构建全面和强大的监控解决方案。
3.Prometheus生态包含组件
- Prometheus Server:Prometheus 服务器是核心组件,用于收集、存储和处理时间序列数据。它负责从各个目标主机上抓取监控指标数据,并将其存储在本地磁盘中供后续查询和分析使用。
- Exporters:Exporter 是用于从各种系统、服务和应用程序中抓取指标数据的组件。Prometheus 提供了一些官方的 Exporter,同时也支持社区开发的 Exporter。Exporter 将特定系统的指标数据暴露出来,使其可以被 Prometheus Server 收集。
- Alertmanager:Alertmanager 是负责处理和发送警报通知的组件。当 Prometheus Server检测到警报条件时,它将警报发送给 Alertmanager,然后 Alertmanager 负责对警报进行处理、去重、分组和路由,并将警报通知发送给配置的接收方(如电子邮件、Slack、PagerDuty等)。
- Grafana:Grafana 是一个流行的可视化仪表板工具,用于创建漂亮的监控仪表板。通过与Prometheus 集成,Grafana 可以从 Prometheus Server 中查询和展示监控指标数据,并以图表和图形的形式展示给用户。
- Pushgateway:Pushgateway 是一个中间组件,允许短期作业(如批处理任务)将其指标数据推送到 Prometheus Server。短期作业通常无法被长期监控,因此 Pushgateway 提供了一个临时存储的机制,以便 Prometheus Server 可以主动从 Pushgateway 拉取指标数据。
二、安装Prometheus
1.安装采集节点资源指标组件 node-exporter
apiVersion: apps/v1
kind: DaemonSet
metadata:name: node-exporternamespace: monitor-salabels:name: node-exporter
spec:selector:matchLabels:name: node-exportertemplate: metadata:labels:name: node-exporterspec:hostIPC: truehostNetwork: truehostPID: truecontainers:- name: node-exporterimage: docker.io/prom/node-exporter:v0.16.0imagePullPolicy: IfNotPresentports:- containerPort: 9100resources:requests:cpu: 0.15securityContext:privileged: trueargs:- --path.procfs- /host/proc  #指定 proc 文件系统的路径为/host/proc。Node Exporter 使用proc 文件系统来获取有关进程和系统信息的指标数据。- --path.sysfs- /host/sys    #指定 sys 文件系统的路径为/host/sys。Node Exporter 使用 sys 文件系统来获取有关系统硬件资源和内核信息的指标数据。- --collector.filesystem.ignored-mount-points- '"^/(sys|proc|dev|host|etc)($|/)"'  #配置要忽略的文件系统挂载点的正则表达式。这个正则表达式指定了一些常见的文件系统挂载点,如/sys、/proc、/dev、/host 和/etc。Node Exporter 将忽略这些挂载点上的文件系统,不采集与其相关的指标数据volumeMounts:- name: devmountPath: /host/dev- name: procmountPath: /host/proc- name: sysmountPath: /host/sys- name: rootfsmountPath: /rootfstolerations:- key: "node-role.kubernetes.io/control-plane"operator: "Exists"effect: "NoSchedule"volumes:- name: prochostPath:path: /proc- name: devhostPath:path: /dev- name: syshostPath:path: /sys- name: rootfshostPath:path: /
2.配置Prometheus server服务的configmap
#创建一个namespace
kubectl create ns monitor-sa
#创建一个sa账号
kubectl create serviceaccount monitor -n monitor-sa
#把sa账号monitor通过clusterrolebing绑定到clusterrole
kubectl create clusterrolebinding monitor-clusterrolebinding --clusterrole=cluster-admin --serviceaccount=monitor-sa:monitor
创建数据目录
mkdir /data
chmod 777 /data
#配置prometheus的configmap
参考地址:
github:https://github.com/prometheus/prometheus/blob/release-2.31/documentation/examples/prometheus-kubernetes.yml
官网:https://prometheus.io/docs/prometheus/latest/configuration/configuration/#kubernetes_sd_config
vim prometheus-cfg.yaml
---
kind: ConfigMap
apiVersion: v1
metadata:labels:app: test-prometheusname: prometheus-confignamespace: monitor-sa
data:prometheus.yml: |global:scrape_interval: 15sscrape_timeout: 10sevaluation_interval: 1mscrape_configs:- job_name: 'kubernetes-node'kubernetes_sd_configs:- role: noderelabel_configs:- source_labels: [__address__]regex: '(.*):10250'replacement: '${1}:9100'target_label: __address__action: replace- action: labelmapregex: __meta_kubernetes_node_label_(.+)- job_name: 'kubernetes-node-cadvisor'kubernetes_sd_configs:- role:  nodescheme: httpstls_config:ca_file: /var/run/secrets/kubernetes.io/serviceaccount/ca.crtbearer_token_file: /var/run/secrets/kubernetes.io/serviceaccount/tokenrelabel_configs:- action: labelmapregex: __meta_kubernetes_node_label_(.+)- target_label: __address__replacement: kubernetes.default.svc:443- source_labels: [__meta_kubernetes_node_name]regex: (.+)target_label: __metrics_path__replacement: /api/v1/nodes/${1}/proxy/metrics/cadvisor- job_name: 'kubernetes-apiserver'kubernetes_sd_configs:- role: endpointsscheme: httpstls_config:ca_file: /var/run/secrets/kubernetes.io/serviceaccount/ca.crtbearer_token_file: /var/run/secrets/kubernetes.io/serviceaccount/tokenrelabel_configs:- source_labels: [__meta_kubernetes_namespace, __meta_kubernetes_service_name, __meta_kubernetes_endpoint_port_name]action: keepregex: default;kubernetes;https- job_name: 'kubernetes-service-endpoints'kubernetes_sd_configs:- role: endpointsrelabel_configs:- source_labels: [__meta_kubernetes_service_annotation_prometheus_io_scrape]action: keepregex: true- source_labels: [__meta_kubernetes_service_annotation_prometheus_io_scheme]action: replacetarget_label: __scheme__regex: (https?)- source_labels: [__meta_kubernetes_service_annotation_prometheus_io_path]action: replacetarget_label: __metrics_path__regex: (.+)- source_labels: [__address__, __meta_kubernetes_service_annotation_prometheus_io_port]action: replacetarget_label: __address__regex: ([^:]+)(?::\d+)?;(\d+)replacement: $1:$2- action: labelmapregex: __meta_kubernetes_service_label_(.+)- source_labels: [__meta_kubernetes_namespace]action: replacetarget_label: kubernetes_namespace- source_labels: [__meta_kubernetes_service_name]action: replacetarget_label: kubernetes_name
3.通过deployment部署Prometheus
---
apiVersion: apps/v1
kind: Deployment
metadata:name: test-prometheuslabels:app: test-prometheus
spec:replicas: 1selector:matchLabels:app: test-prometheustemplate:metadata:labels:app: test-prometheusannotations:prometheus.io/scrape: 'true'spec:securityContext:runAsUser: 0containers:- name: test-prometheusimage: docker.io/prom/prometheus:v2.33.5imagePullPolicy: Alwayscommand:- prometheus- --config.file=/etc/prometheus/prometheus.yml- --storage.tsdb.path=/prometheus        #数据存储目录- --storage.tsdb.retention=168h          #数据保存时长- --web.enable-lifecycle                 #开启热加载ports:- containerPort: 9090protocol: TCPvolumeMounts:- mountPath: /etc/prometheus/prometheus.ymlname: prometheus-configsubPath: prometheus.yml- mountPath: /prometheus/name: prometheus-storage-volumeresources:requests:memory: 1Gicpu: "1"limits:memory: 2Gicpu: "1"volumes:- name: prometheus-configconfigMap:name: prometheus-configitems:- key: prometheus.ymlpath: prometheus.ymlmode: 0644- name: prometheus-storage-volumehostPath:path: /var/lib/docker/data/{{ $.Chart.Name }}/datatype: DirectoryOrCreate
4.给Prometheus pod创建一个service
---
apiVersion: v1
kind: Service
metadata:name: prometheussvclabels:app: test-prometheusnamespace: monitor-sa
spec:type: NodePortports:- port: 9090targetPort: 9090protocol: TCPselector:app: test-prometheus#查看映射端口
[root@master1 prometheus]# kubectl describe svc test-prometheus -n monitor-sa
Name:                     test-prometheus
Namespace:                monitor-sa
Labels:                   app=test-prometheusapp.kubernetes.io/managed-by=Helm
Annotations:              meta.helm.sh/release-name: prometheusmeta.helm.sh/release-namespace: monitor-saname: test-prometheusprometheus.io/scrape: true
Selector:                 app=test-prometheus
Type:                     NodePort
IP Family Policy:         SingleStack
IP Families:              IPv4
IP:                       10.96.128.98
IPs:                      10.96.128.98
Port:                     http  9090/TCP
TargetPort:               9090/TCP
NodePort:                 http  31439/TCP
Endpoints:                10.244.247.6:9090
Session Affinity:         None
External Traffic Policy:  Cluster
Events:                   <none>
#页面访问测试
http://192.168.100.17:31439/graph
5.安装配置可视化UI界面graphna
---
apiVersion: apps/v1
kind: Deployment
metadata:name: test-grafana
spec:replicas: 1selector:matchLabels:app: test-grafanatemplate:metadata:labels:app: test-grafanaspec:containers:- name: test-grafanaimage: docker.io/grafana/grafana:8.4.5imagePullPolicy: Alwaysports:- containerPort: 3000protocol: TCPvolumeMounts:- mountPath: /etc/ssl/certsname: ca-certificatesreadOnly: true- mountPath: /var/lib/grafananame: grafana-storageresources:requests:memory: 1Gicpu: "1"limits:memory: 1Gicpu: "1"env:- name: INFLUXDB_HOSTvalue: monitoring-influxdb- name: GF_SERVER_HTTP_PORTvalue: "3000"- name: GF_AUTH_BASIC_ENABLEDvalue: "false"- name: GF_AUTH_ANONYMOUS_ENABLEDvalue: "true"- name: GF_AUTH_ANONYMOUS_ORG_ROLEvalue: Admin- name: GF_SERVER_ROOT_URLvalue: /volumes:- name: ca-certificateshostPath:path: /etc/ssl/certs- name: grafana-storageemptyDir:medium: Memory
---
apiVersion: v1
kind: Service
metadata:labels:app: test-grafananame: test-grafana
spec:ports:- name: httpport: 3000targetPort: 3000protocol: TCPselector:app: test-grafanatype: NodePort
#查看转发端口kubectl get svc -n monitor-sa
NAME              TYPE       CLUSTER-IP      EXTERNAL-IP   PORT(S)          AGE
test-grafana      NodePort   10.100.121.25   <none>        3000:31562/TCP   4m4s
三、页面展示
#访问:
http://192.168.100.16:31562/
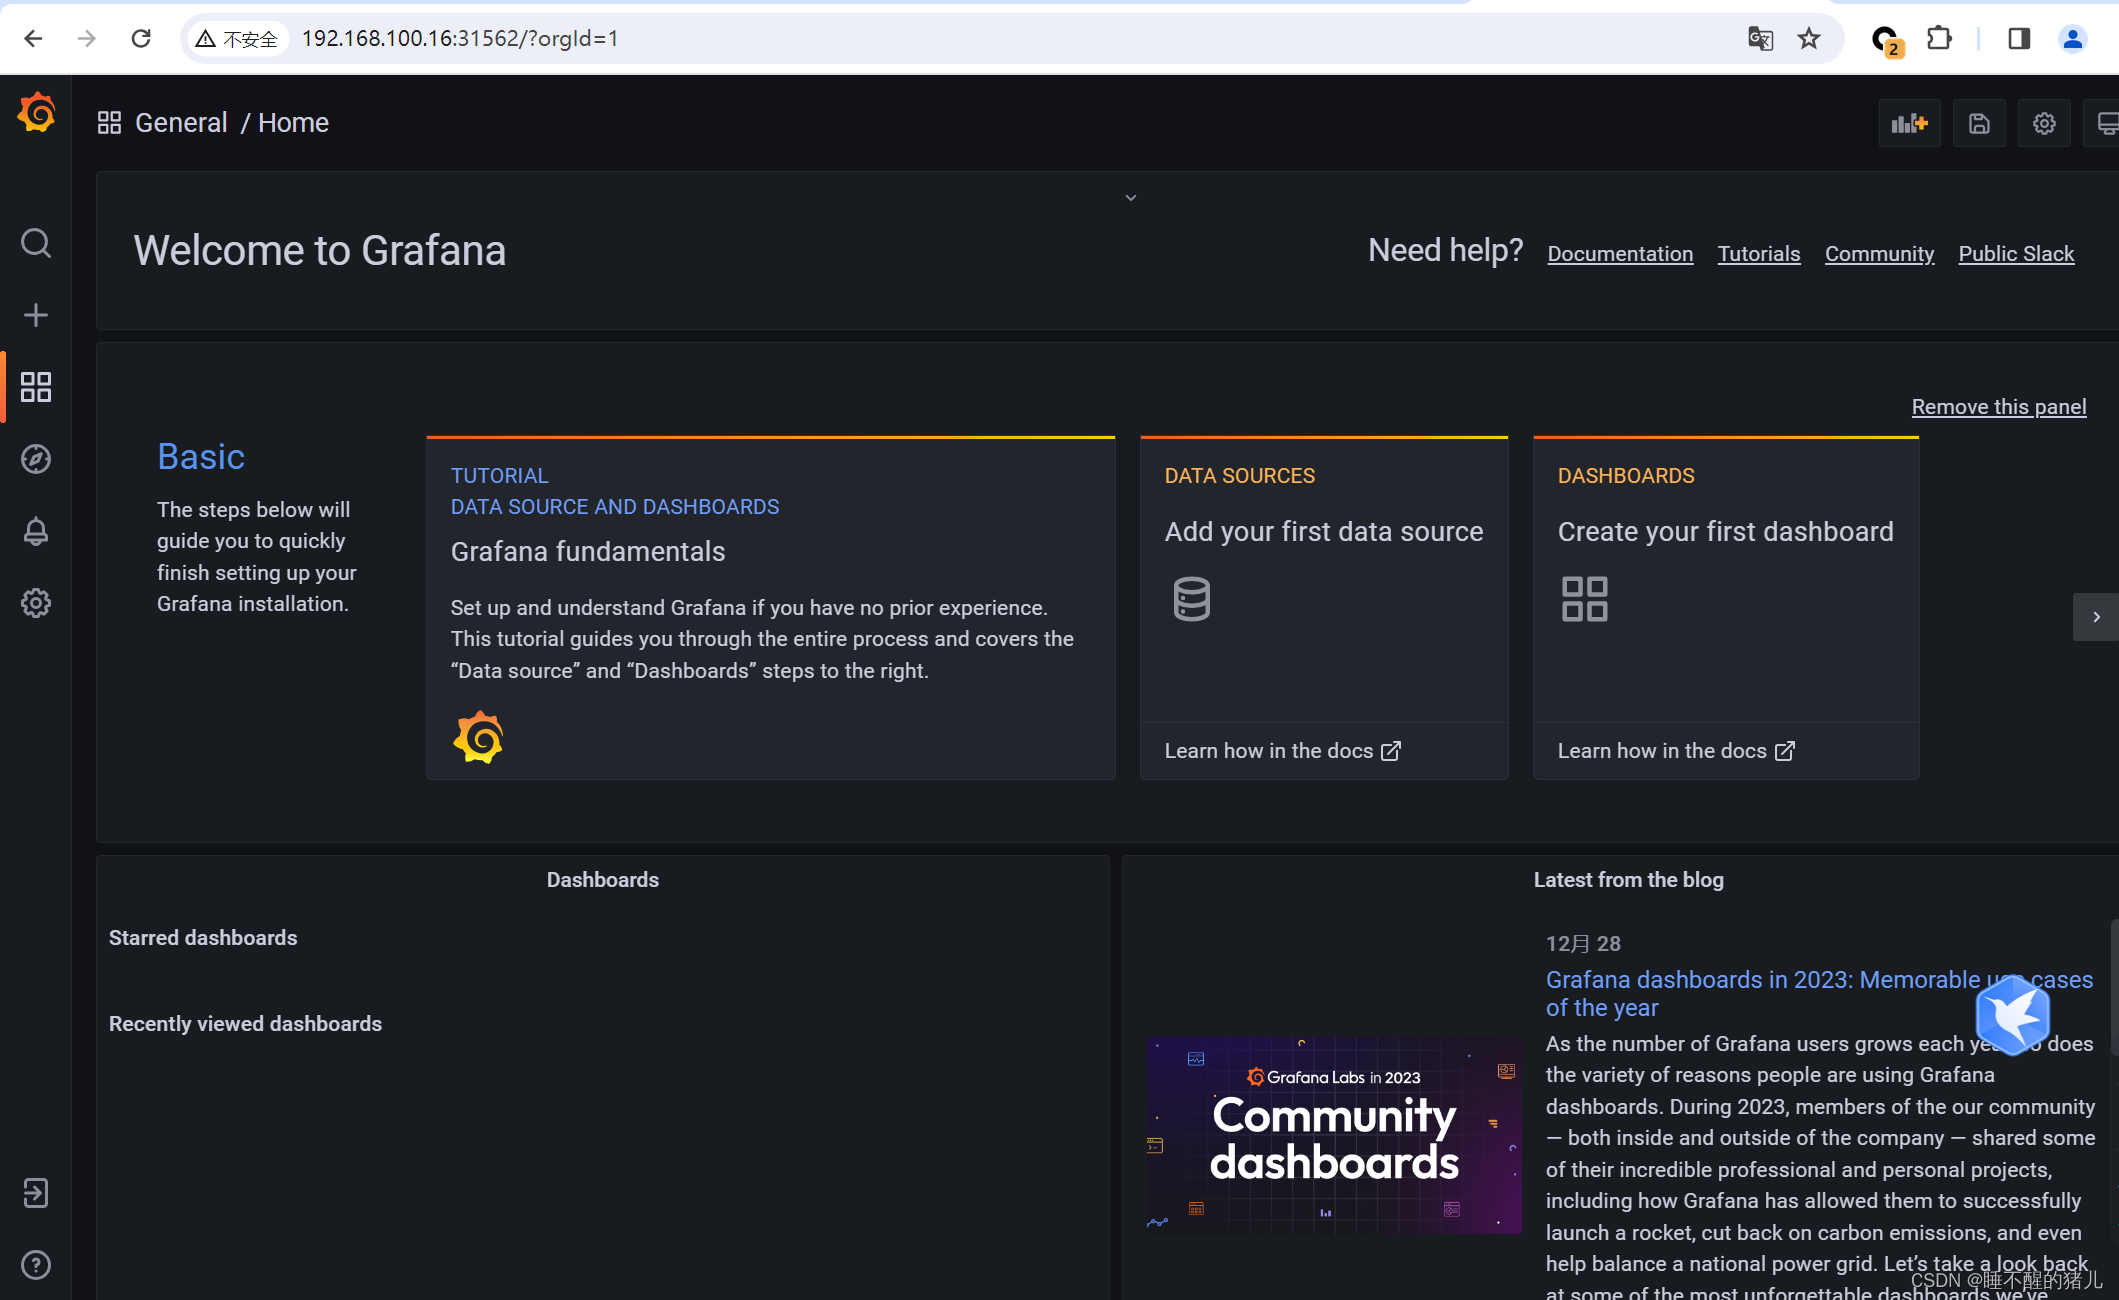
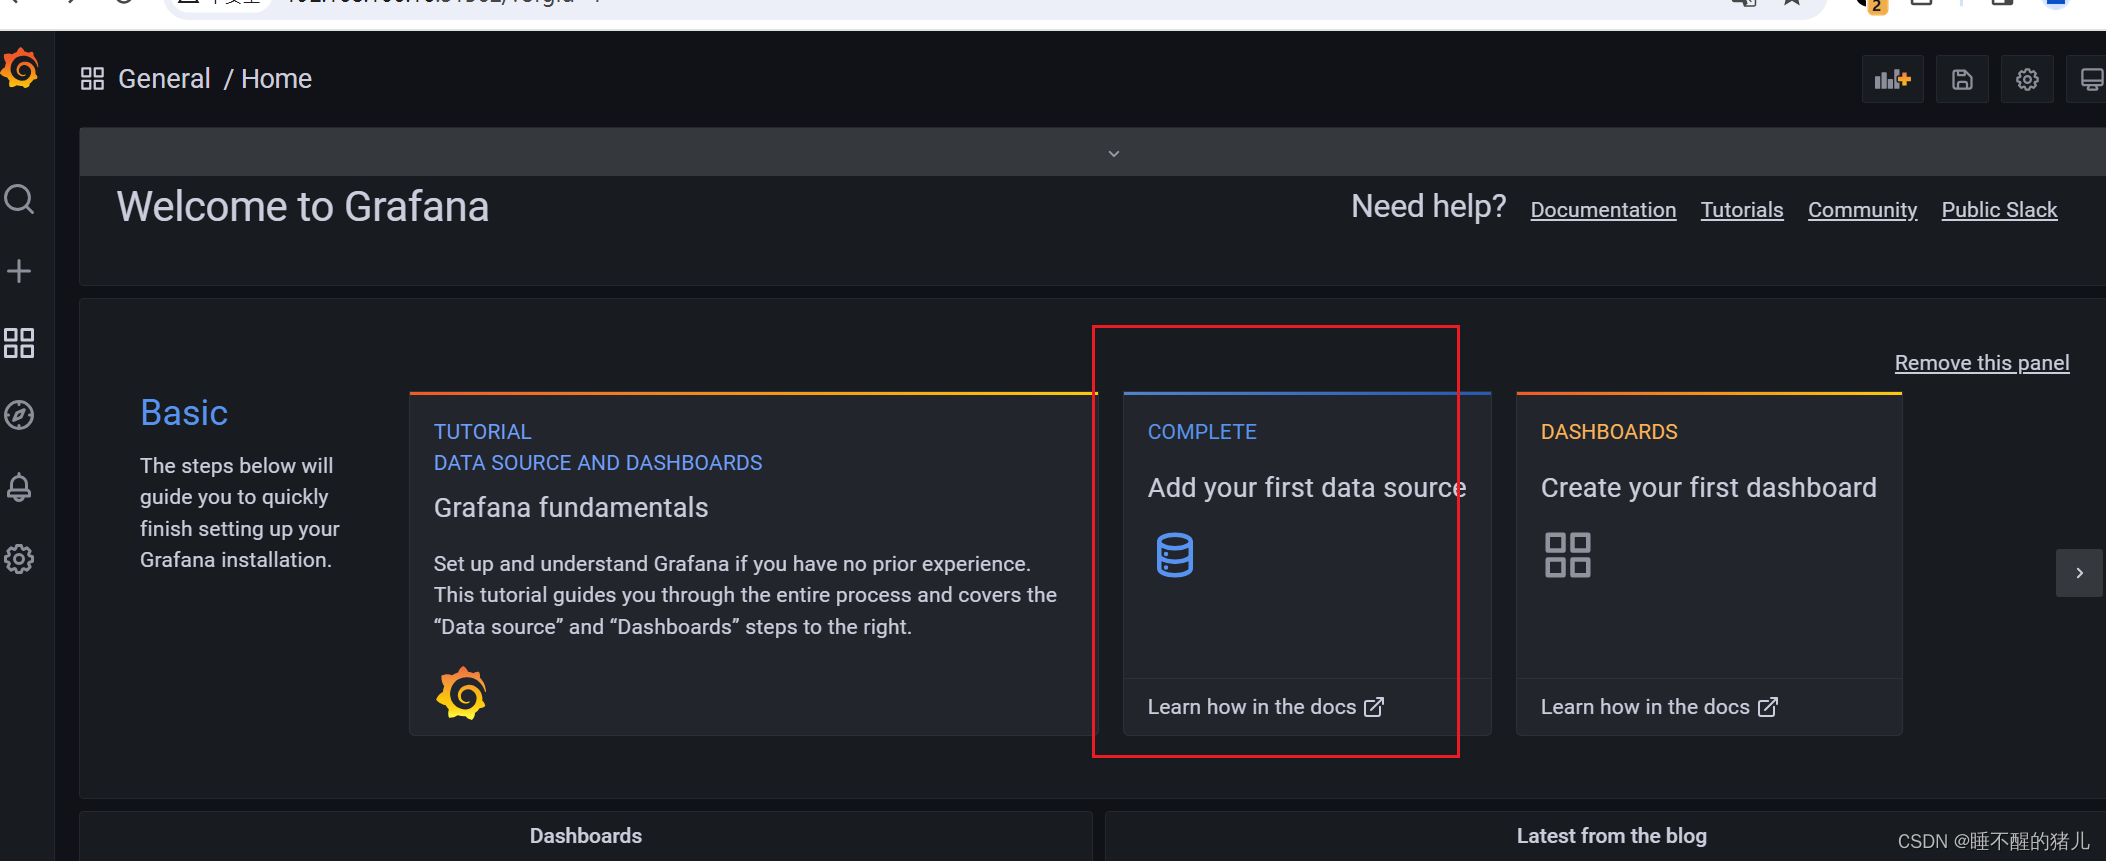
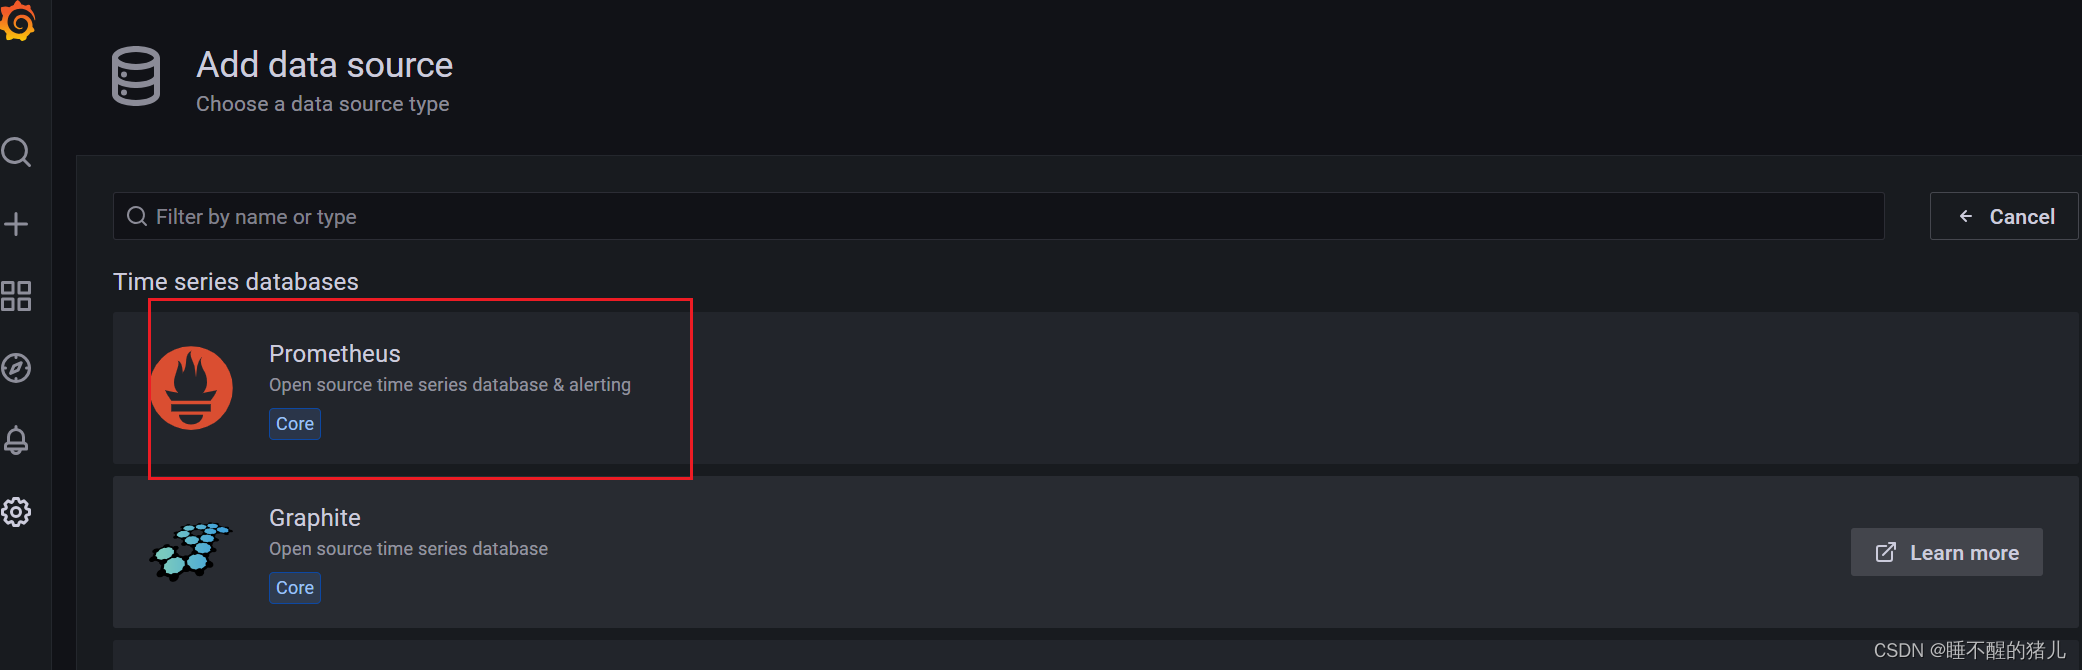
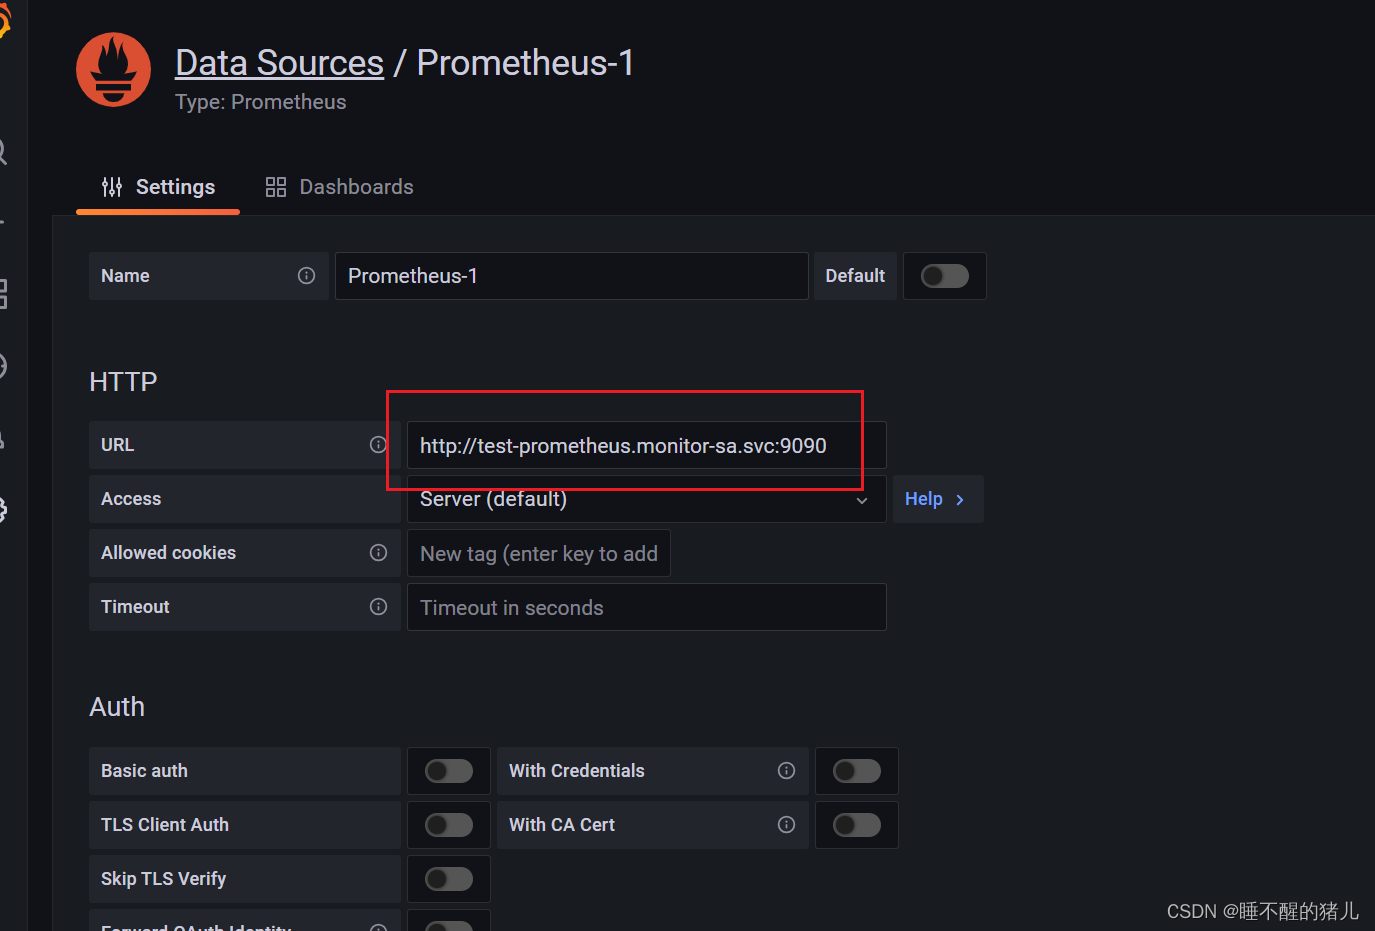
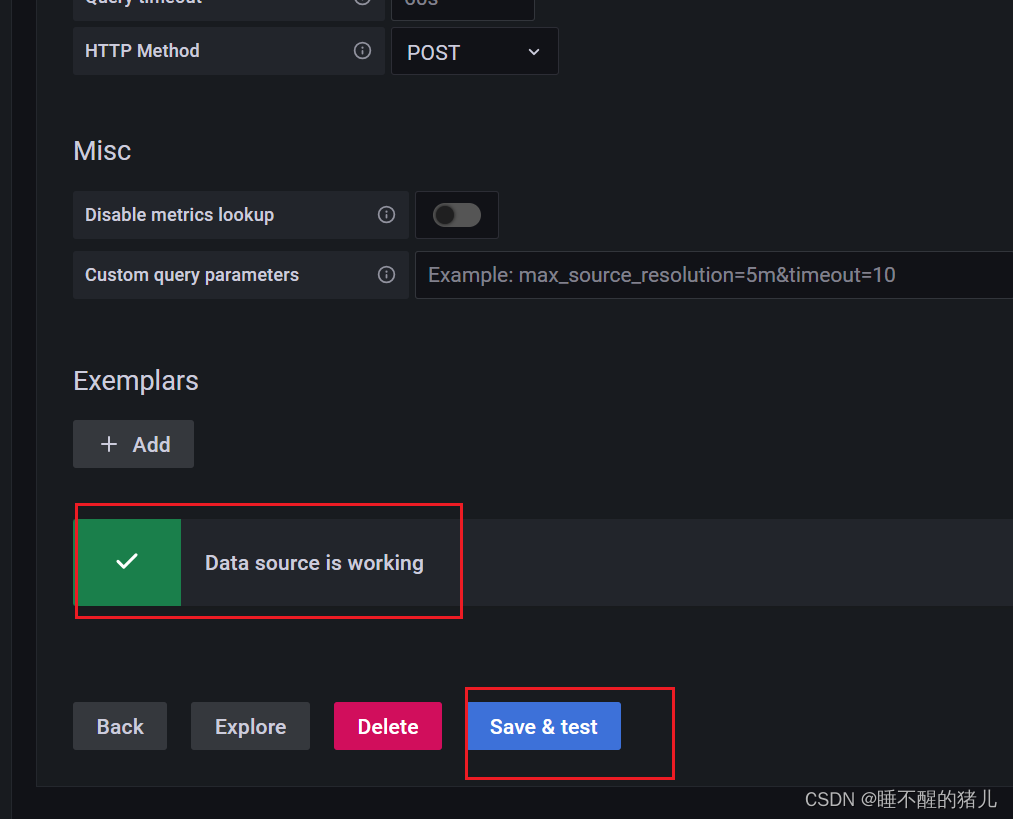
6.配置grafana界面
选择 Add your first data source
附:面板导入下载:https://grafana.com/grafana/dashboards/
五、安装kube-state-metrics 组件
kube-state-metrics 是一个开源的 Kubernetes 监控工具,它通过将 Kubernetes 集群中的资源状态转换为可观察的指标(metrics),提供了对 Kubernetes 对象的详细监控和可视化。以下是 kube-state-metrics 的基本介绍:
- 功能:kube-state-metrics 从 Kubernetes API 服务器中获取资源对象的当前状态,并将其转换为 Prometheus 指标。它监视集群中的各种资源,包括节点、命名空间、部署、服务、副本集、状态集、持久卷等。通过 kube-state-metrics,您可以获取有关这些资源的重要指标,例如资源的数量、创建时间、标签、状态等。
- 架构:kube-state-metrics 作为一个独立的容器化应用程序运行在 Kubernetes 集群中,它定期轮询 Kubernetes API 服务器以获取资源对象的信息。然后,它将这些信息转换为可观察的指标,并将其公开为 Prometheus 兼容的 HTTP 端点。
- Prometheus 兼容性:kube-state-metrics 以 Prometheus 的数据模型为基础,生成符合Prometheus 指标格式的指标数据。这使得 Prometheus 能够通过 HTTP 抓取 kube-statemetrics 的指标数据,并将其用于监控和警报。
- 指标示例:kube-state-metrics 生成的指标包括对象的数量、重启次数、资源限制、标签信息、容器状态等。例如,您可以获取每个命名空间的 Pod 数量、每个节点的 CPU 和内存使用情况、每个服务的副本数量等信息。
- 可视化和监控:通过将 kube-state-metrics 与 Prometheus 和 Grafana 等工具结合使用,您可以创建仪表板和报警规则,对 Kubernetes 集群中的资源进行实时监控和可视化。这使您能够了解集群中资源的状态、趋势和性能,以便进行故障排查、容量规划和性能优化。
安装与配置kube-state-metrics
创建SA并对SA授权
---
apiVersion: v1
kind: ServiceAccount
metadata:name: kube-state-metricsnamespace: monitor-sa
---
apiVersion: rbac.authorization.k8s.io/v1
kind: ClusterRole
metadata:name: kube-state-metrics
rules:
- apiGroups: [""]resources: ["nodes", "pods", "services", "resourcequotas", "replicationcontrollers", "limitranges", "persistentvolumeclaims", "persistentvolumes", "namespaces", "endpoints"]verbs: ["list", "watch"]
- apiGroups: ["extensions"]resources: ["daemonsets", "deployments", "replicasets"]verbs: ["list", "watch"]
- apiGroups: ["apps"]resources: ["statefulsets"]verbs: ["list", "watch"]
- apiGroups: ["batch"]resources: ["cronjobs", "jobs"]verbs: ["list", "watch"]
- apiGroups: ["autoscaling"]resources: ["horizontalpodautoscalers"]verbs: ["list", "watch"]
---
apiVersion: rbac.authorization.k8s.io/v1
kind: ClusterRoleBinding
metadata:name: kube-state-metrics
roleRef:apiGroup: rbac.authorization.k8s.iokind: ClusterRolename: kube-state-metrics
subjects:
- kind: ServiceAccountname: kube-state-metricsnamespace: monitor-sa
创建deployment/service
apiVersion: apps/v1
kind: Deployment
metadata:name: kube-state-metricsnamespace: monitor-sa
spec:replicas: 1selector:matchLabels:app: kube-state-metricstemplate:metadata:labels:app: kube-state-metricsspec:serviceAccountName: kube-state-metricscontainers:- name: kube-state-metricsimage: quay.io/coreos/kube-state-metrics:v1.9.0imagePullPolicy: IfNotPresentports:- containerPort: 8080
---
apiVersion: v1
kind: Service
metadata:annotations:prometheus.io/scrape: 'true'name: kube-state-metricsnamespace: monitor-salabels:app: kube-state-metrics
spec:ports:- name: kube-state-metricsport: 8080protocol: TCPselector:app: kube-state-metrics
在granfana的web界面中导入Kubernetes cluster monitoring (via Prometheus) (k8s 1.16)-1577691996738.json即可