简介
本文介绍在springboot3.x里配置启用系统指标监控功能,来监视系统各项Metrics指标,从而实时了解应用的运行健康状态,通过promtheus服务提供数据收集与指标可视化方案;
Metrics指标
metrics指标表示应用程序代码运行中提供的多维度指标数据,每一条指标数据通常由时间序列及一组标签键值对结构数据组成,常见的运行维度指标有:服务响应时间,HTTP请求量,CPU利用率,内存使用大小,磁盘读写大小,JVM内存使用率等等;
Spring Boot Actuator为Micrometer提供依赖管理和自动配置,Micrometer 是一个支持众多监控系统,并提供应用程序的可观察性度量指标数据组件;
Micrometer官方描述为计时器、计量器、计数器、分布摘要和长任务计时器提供供应商中立的接口,并具有维度数据模型,当与维度监控系统配合使用时,可以有效访问特定的命名指标,并具有向下钻取的能力跨越它的维度。
SpringBoot启用metrics
在springboot生态体系spring-boot-starter-actuator组件中已集成相关Metrics指标配置与服务,可以方便支持从 Spring Boot 应用程序中获取应用程序可观察性指标。
相关的配置与使用方式,在springboot官方文档中都有进行描述;详情参见:Production-ready Features
以一个springboot3.x项目做为示例,演示如何使用metrics指标服务,并对接到prometheus中做可观察性指标展示;
项目信息:springboot.3.1.0 + jdk17
pom.xml
创建任意一个springboot项目,引入以下pom配置项
<properties><maven.compiler.source>17</maven.compiler.source><maven.compiler.target>17</maven.compiler.target><java.version>17</java.version>
</properties><parent><groupId>org.springframework.boot</groupId><artifactId>spring-boot-starter-parent</artifactId><version>3.1.0</version><relativePath/> <!-- lookup parent from repository -->
</parent><dependencies><dependency><groupId>org.springframework.boot</groupId><artifactId>spring-boot-starter-webflux</artifactId></dependency><dependency><groupId>org.springframework.boot</groupId><artifactId>spring-boot-starter-actuator</artifactId></dependency><dependency><groupId>org.springframework.boot</groupId><artifactId>spring-boot-configuration-processor</artifactId><optional>true</optional></dependency><dependency><groupId>org.springframework.boot</groupId><artifactId>spring-boot-starter-test</artifactId><scope>test</scope></dependency><dependency><groupId>io.projectreactor</groupId><artifactId>reactor-test</artifactId><scope>test</scope></dependency><!-- prometheus依赖 --><dependency><groupId>io.micrometer</groupId><artifactId>micrometer-registry-prometheus</artifactId><version>1.11.0</version></dependency>
</dependencies>
application.yml
# 本地服务访问
server:# 服务端口port: 8080# 服务IPaddress: 0.0.0.0spring:application:# 应用服务名name: testDemo# 是否启用springboot的debug调试模式,会打印详细日志信息
debug: false# 开启健康检查
management:# 自定义管理服务地址和端口,默认和应用程序地址端口一致
#  server:
#    port: 8081
#    address: 0.0.0.0endpoint:shutdown:enabled: truehealth:show-details: alwaysendpoints:web:exposure:# 开启端点,*表示开启所有include:- '*'# 某些端点除外,不做开启exclude:- env- beans# 跨域配置cors:# 开放所有域访问allowed-origins:- '*'metrics:# 指标采集标签名tags:application: ${spring.application.name}# 启用对接prometheus服务采集指标数据prometheus:metrics:export:enabled: true
ApplicationStart.java
@SpringBootApplication
public class ApplicationStart {public static void main(String[] args) {SpringApplication.run(ApplicationStart.class, args);}
}
浏览器访问
启动springboot程序后,通过以下URL在浏览器中打开
http://127.0.0.1:8080/actuator
查看已开启的端点与端点数据展示链接
{"_links": {"self": {"href": "http://127.0.0.1:8080/actuator","templated": false},"caches-cache": {"href": "http://127.0.0.1:8080/actuator/caches/{cache}","templated": true},"caches": {"href": "http://127.0.0.1:8080/actuator/caches","templated": false},"health": {"href": "http://127.0.0.1:8080/actuator/health","templated": false},"health-path": {"href": "http://127.0.0.1:8080/actuator/health/{*path}","templated": true},"info": {"href": "http://127.0.0.1:8080/actuator/info","templated": false},"conditions": {"href": "http://127.0.0.1:8080/actuator/conditions","templated": false},"shutdown": {"href": "http://127.0.0.1:8080/actuator/shutdown","templated": false},"configprops": {"href": "http://127.0.0.1:8080/actuator/configprops","templated": false},"configprops-prefix": {"href": "http://127.0.0.1:8080/actuator/configprops/{prefix}","templated": true},"loggers": {"href": "http://127.0.0.1:8080/actuator/loggers","templated": false},"loggers-name": {"href": "http://127.0.0.1:8080/actuator/loggers/{name}","templated": true},"heapdump": {"href": "http://127.0.0.1:8080/actuator/heapdump","templated": false},"threaddump": {"href": "http://127.0.0.1:8080/actuator/threaddump","templated": false},"prometheus": {"href": "http://127.0.0.1:8080/actuator/prometheus","templated": false},"metrics-requiredMetricName": {"href": "http://127.0.0.1:8080/actuator/metrics/{requiredMetricName}","templated": true},"metrics": {"href": "http://127.0.0.1:8080/actuator/metrics","templated": false},"scheduledtasks": {"href": "http://127.0.0.1:8080/actuator/scheduledtasks","templated": false},"mappings": {"href": "http://127.0.0.1:8080/actuator/mappings","templated": false}}
}安装prometheus
prometheus是一个开源监控系统,用于收集和聚合指标作为时间序列数据,它前身是SoundCloud的警告工具包。
prometheus通过抓取或轮询获取各个应用程序实例的指标。Spring Boot 提供了一个执行器端点/actuator/prometheus输出数据格式,以提供prometheus服务抓取。
下载
Download | Prometheus
prometheus支持windows环境安装与使用,本文采用prometheus-2.37.0(windows-amd64)版本做为演示使用;
prometheus.yml
解压下载包后,进入prometheus解压根目录,编辑prometheus.yml配置,添加拉取的springboot应用服务配置;
# my global config
global:scrape_interval: 15s # Set the scrape interval to every 15 seconds. Default is every 1 minute.evaluation_interval: 15s # Evaluate rules every 15 seconds. The default is every 1 minute.# scrape_timeout is set to the global default (10s).# Alertmanager configuration
alerting:alertmanagers:- static_configs:- targets:# - alertmanager:9093# Load rules once and periodically evaluate them according to the global 'evaluation_interval'.
rule_files:# - "first_rules.yml"# - "second_rules.yml"# A scrape configuration containing exactly one endpoint to scrape:
# Here it's Prometheus itself.
scrape_configs:# The job name is added as a label `job=<job_name>` to any timeseries scraped from this config.- job_name: "prometheus"# metrics_path defaults to '/metrics'# scheme defaults to 'http'.static_configs:- targets: ["localhost:9090"]# 增加spring任务节点,从/actuator/prometheus拉取目标指标数据- job_name: "spring"metrics_path: "/actuator/prometheus"static_configs:- targets: ["localhost:8080"]
浏览器访问
完成prometheus.yml配置后,直接双击prometheus.exe程序运行服务;服务启动完毕后,通过以下URL在浏览器中访问:
http://127.0.0.1:9090/
点击 “菜单栏》Status》Targets” 查看已配置并启用的采集端点应用

Metrics指标跟踪
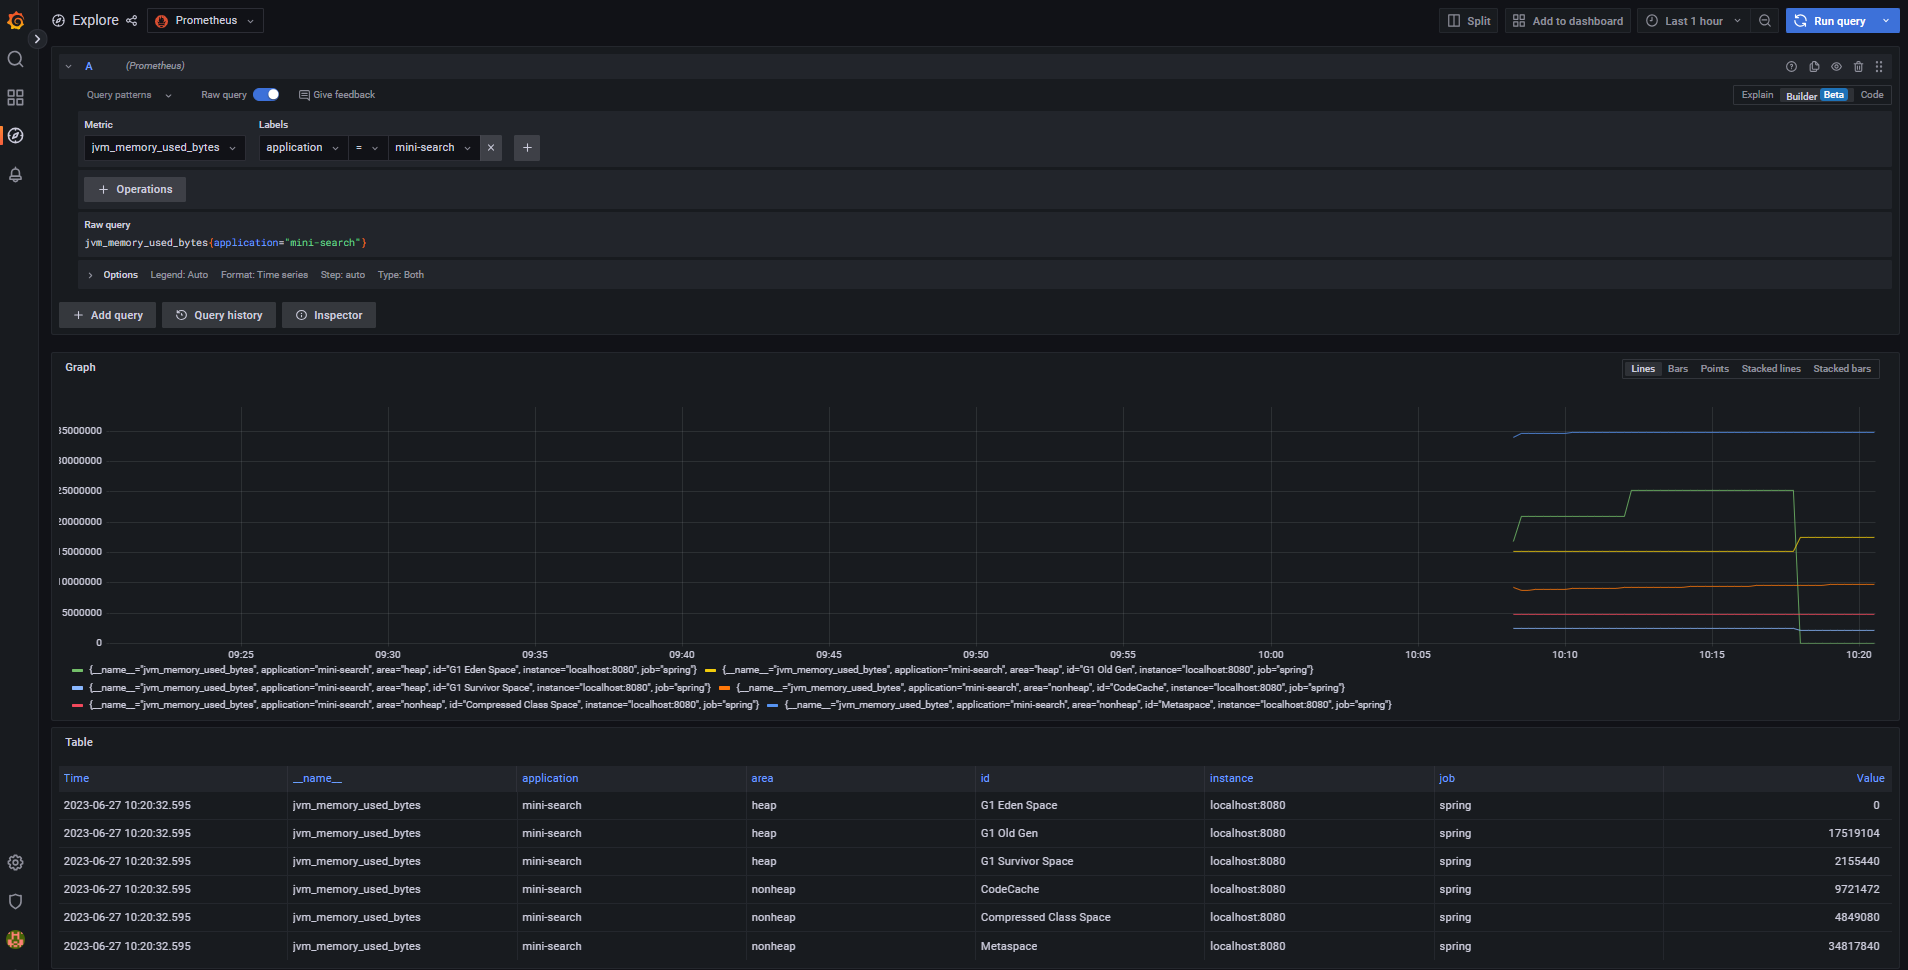
点击菜单栏的“Graph”项,在搜索框中输入jvm,则会自动联想多个带有jvm内容的可观察性指标;

我们以常见的java应用程序内存使用为例,选择jvm_memory_used_bytes,观察应用服务运行过程中的jvm内存使用情况,进行实时监控以便及时了解应用服务运行状况,为应用服务提供有效的健康跟踪方案;

Grafana大盘展示
由于metrics维度指标众多,通过prometheus服务采集后,通过数据指标转化成可观察性图形,为应用程序运维提供了合适的监控技术与管理平台,同时也可以将prometheus采集的指标输出到第三方各类平台上进行展示,比如运维中常见的Grafana,提供了许多丰富的图标插件,高大上的的漂亮UI,以及Grafana官网第三方上传的展示模板,可以非常便捷的套用开放模板后立即呈现出可视化监控图形界面;
- 注:此处以一个已有的Grafana服务为例,不额外描述Grafana安装过程,安装请自行百度;
默认在explore界面查找指标展示;
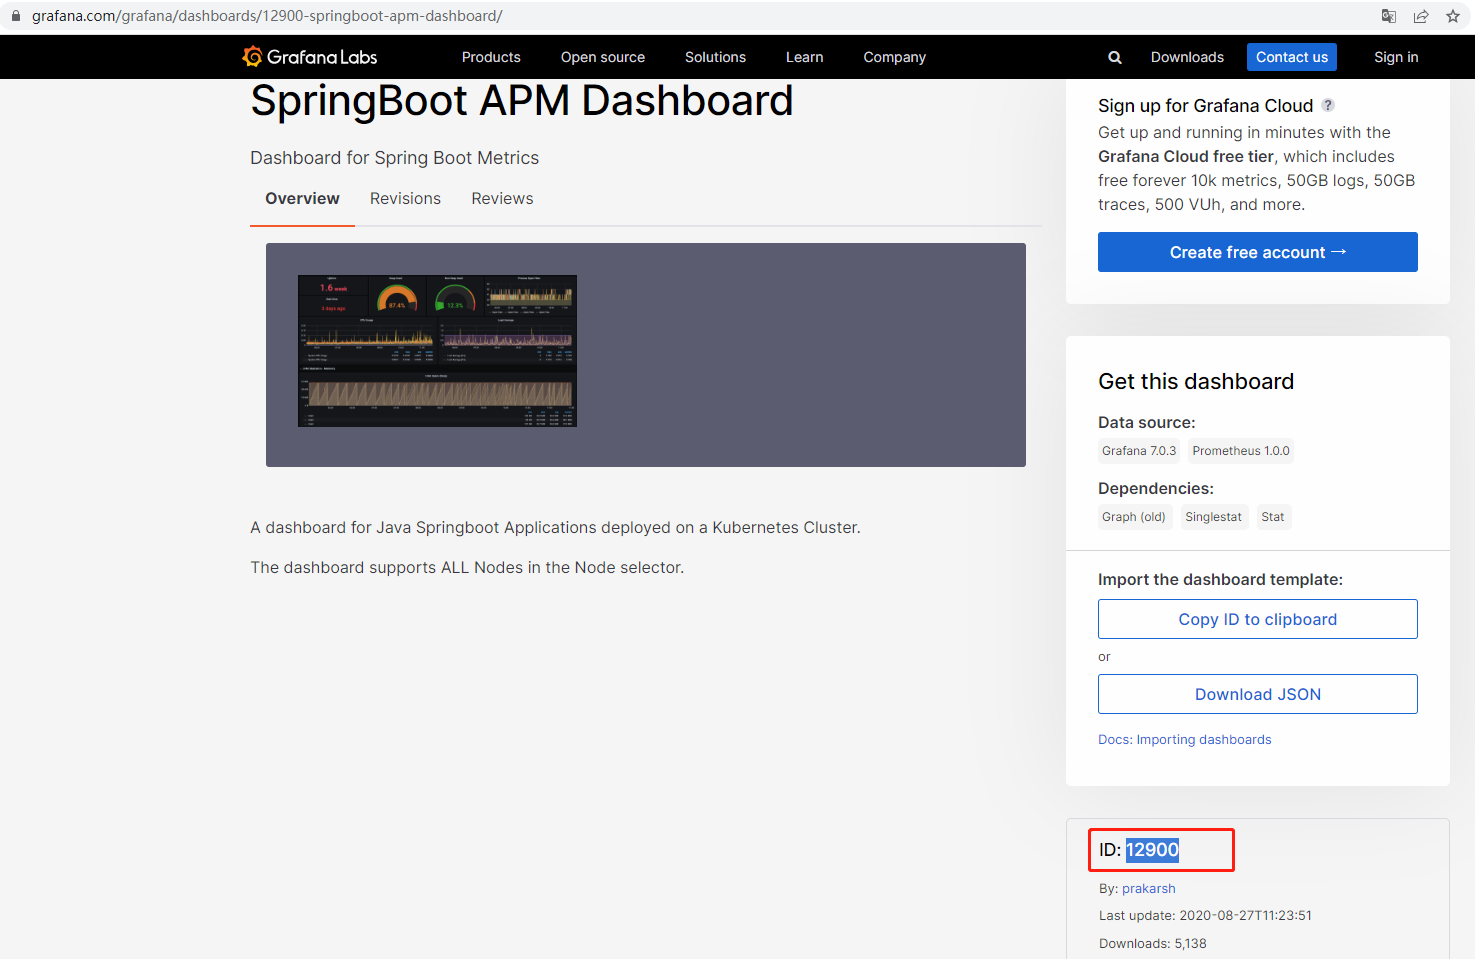
添加SpringBoot监控大盘,官方有很多共享的仪表盘资源可下载,从而减少自已不熟悉仪表盘的配置与脚本,避免无法操作出想要的效果,通过获得第三方共享资源可以快速进行展示。
Dashboards | Grafana Labs
以下为共享ID:12900 (SpringBoot APM Dashboard)
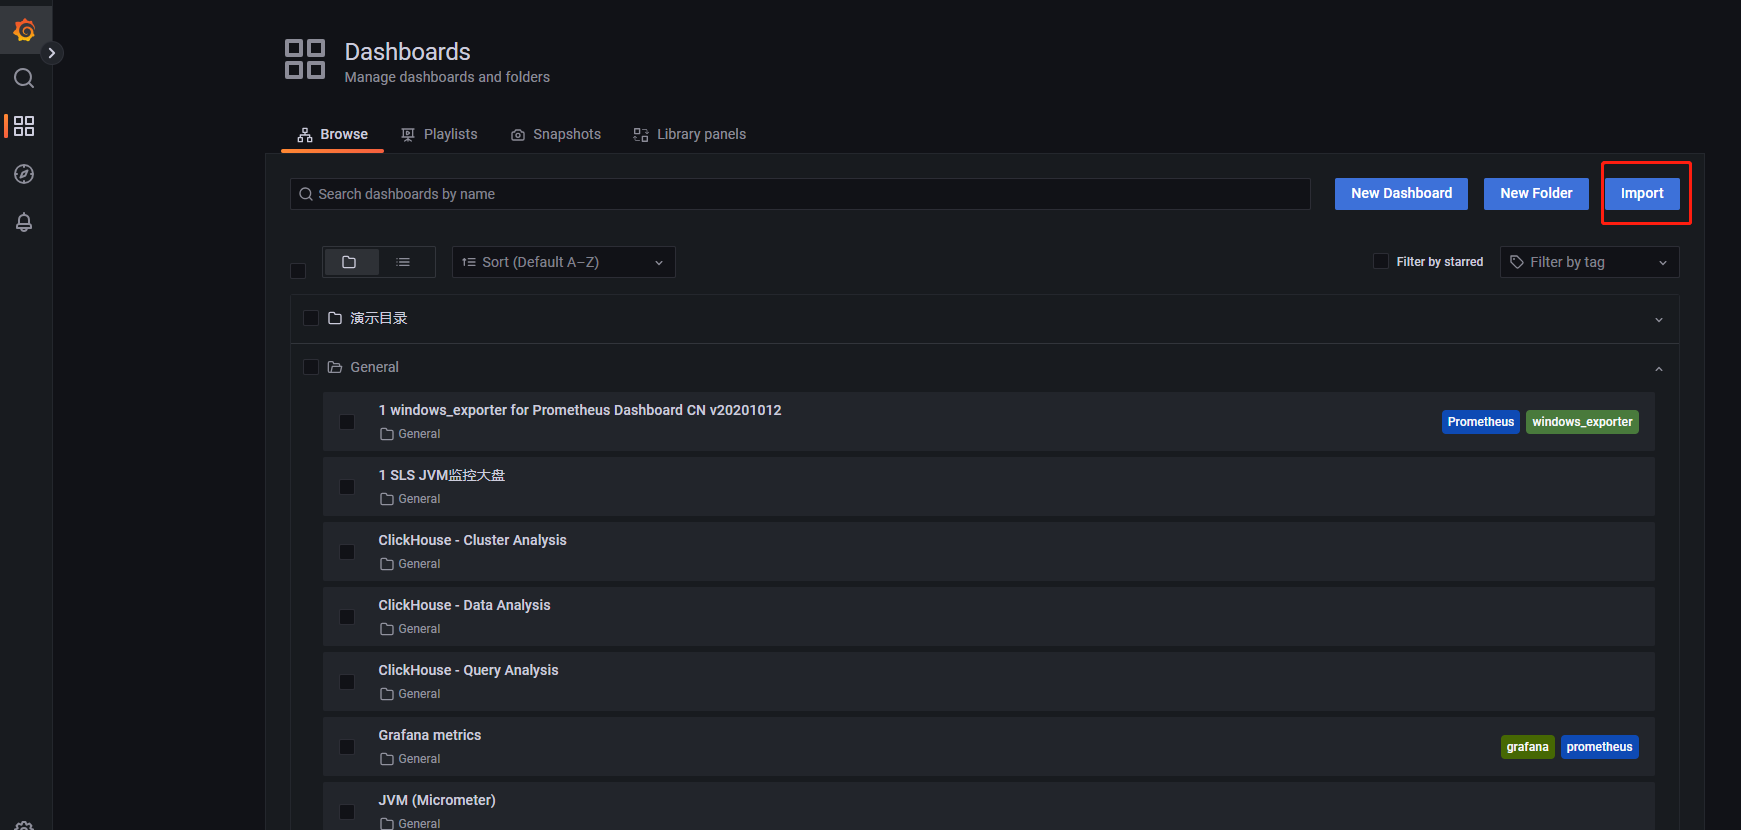
在共享大盘页面复制共享ID后,在Grafana》Dashboards浏览界面,点击import按钮进入导入共享资源界面;
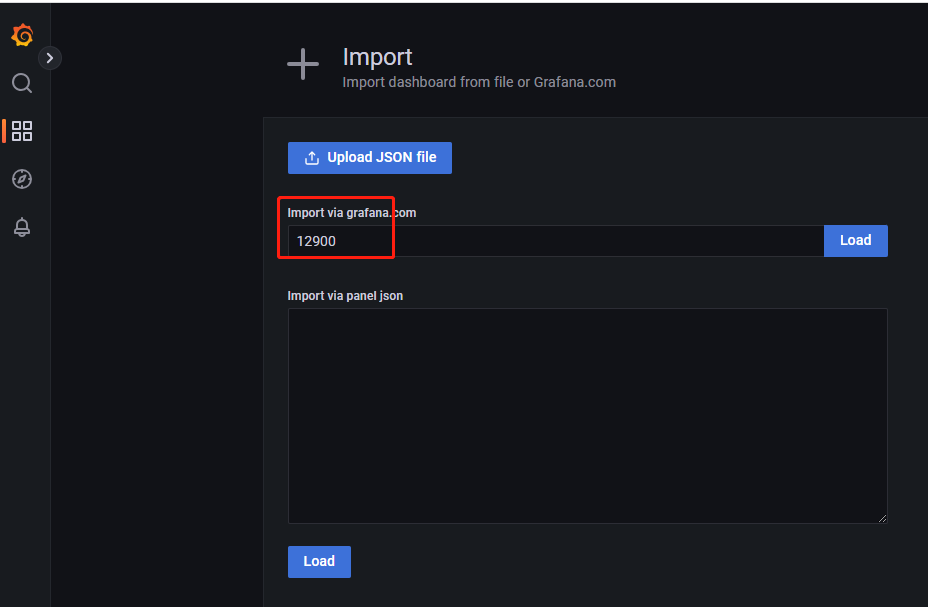
输入共享大盘ID:12900,点击load后,进入大盘配置盘面,底部的Prometheus选择已安装的Prometheus数据源选择(如没有,需要先在插件库中提前安装);
导入共享大盘后,进入到大盘展示界面,开始加载Prometheus监控的维度指标数据,通过各种仪表盘进行详细展示;
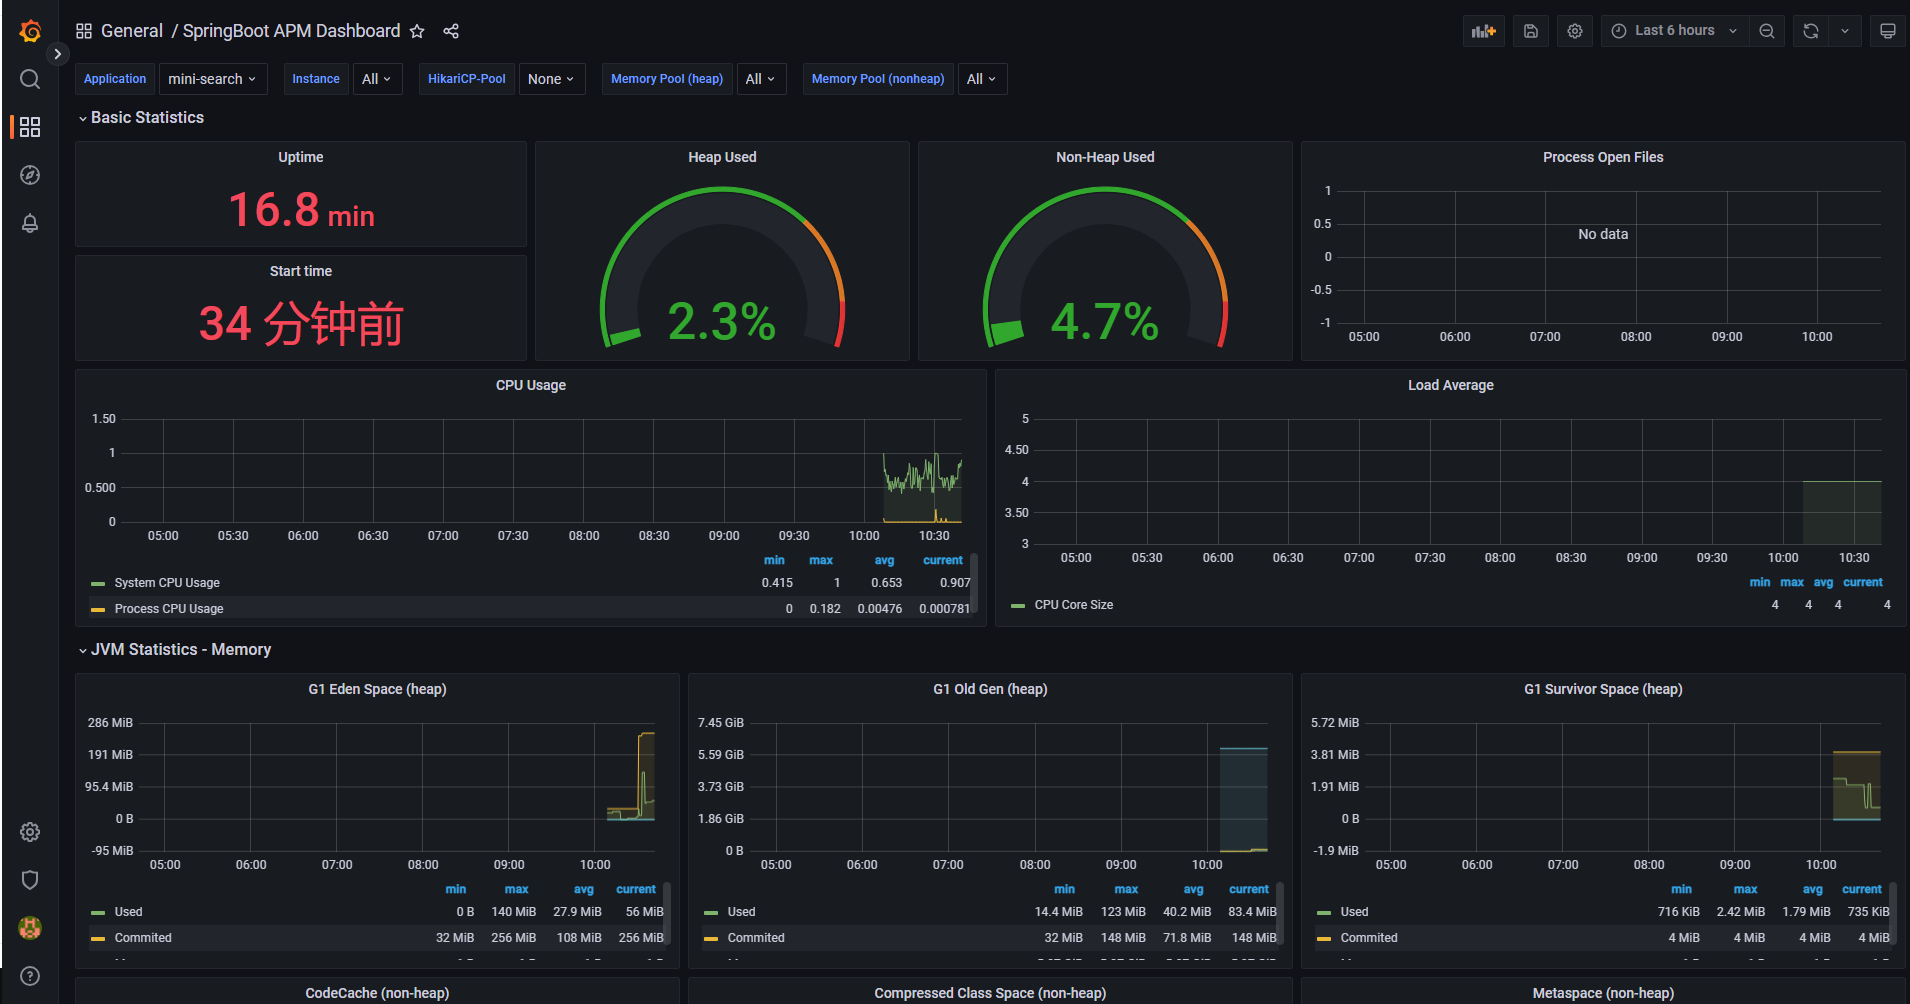
到此,一个完整的springboot项目从集成metrics指标组件,到Prometheus监控服务搭建,到最后Grafana大盘仪表展示流程结束;