文章目录
- 一、实验环境
- 二、Vtune安装
- 2.1 下载
- 2.2 安装
- 2.3 测试
- 2.4 检查
- 2.5 部分功能开启
- 2.5.1 ptrace
- 2.5.2 Sampling Drivers
- 2.6 Memory Access功能
- 三、安装Sampling Drivers
- 3.1 Sampling Drivers下载
- 3.2 Sampling Drivers编译
- 3.3 Sampling Drivers安装
- 3.4 Sampling Drivers开机启动
- 3.5 测试
- 3.5.1 [可选] 图形化界面(查看Memory Access功能)
- 3.5.2 重新检查功能
- 四、远程 VTune Profiler
- 4.1 准备工作
- 4.1.1 安装VTune(本地和远程)
- 4.1.2 配置SSH免密登陆
- 4.1.2 尝试连接
一、实验环境
ubuntu 20.04
二、Vtune安装
2.1 下载
下载地址: https://www.intel.com/content/www/us/en/developer/tools/oneapi/vtune-profiler-download.html
2.2 安装
安装方式有多种,我选择了离线安装,具体安装为
wget https://registrationcenter-download.intel.com/akdlm/IRC_NAS/4466ed1b-5d4a-4b30-9146-1eabc336c647/l_oneapi_vtune_p_2023.1.0.44286_offline.sh
sudo sh ./l_oneapi_vtune_p_2023.1.0.44286_offline.sh
如果有图形界面就会自动启动图形界面,否则就是在终端中安装。为了方便,我在安装中使用了默认的安装路经,安装比较简单,其它的安装方法见:https://www.intel.com/content/www/us/en/docs/vtune-profiler/installation-guide/2023-0/linux.html
2.3 测试
打开一个终端,(如果是默认安装路径)`
source /opt/intel/oneapi/setvars.sh # 后续可以把这个命令加到~/.bashrc中
# 查看是否可以正常打开vtune-gui或vtune
vtune-gui
# 或者运行无图形界面的vtune
2.4 检查
VTune有一些功能需要一些软硬件支持,可以提前检查一下
cd /opt/intel/oneapi/vtune/latest
python3 ./bin64/self_check.py
运行记录
Intel(R) VTune(TM) Profiler Self Check Utility
Copyright (C) 2009 Intel Corporation. All rights reserved.
Build Number: 625246HW event-based analysis (counting mode)
Example of analysis types: Performance SnapshotCollection: OkFinalization: Ok...Report: OkInstrumentation based analysis check
Example of analysis types: Hotspots and Threading with user-mode samplingCollection: Fail
vtune: Error: Cannot start data collection because the scope of ptrace system call is limited. To enable profiling, please set /proc/sys/kernel/yama/ptrace_scope to 0. To make this change permanent, set kernel.yama.ptrace_scope to 0 in /etc/sysctl.d/10-ptrace.conf and reboot the machine.
vtune: Warning: Microarchitecture performance insights will not be available. Make sure the sampling driver is installed and enabled on your system.HW event-based analysis check
Example of analysis types: Hotspots with HW event-based sampling, HPC Performance Characterization, etc.Collection: Fail
vtune: Error: This analysis requires one of these actions: a) Install Intel Sampling Drivers. b) Configure driverless collection with Perf system-wide profiling. To enable Perf system-wide profiling, set /proc/sys/kernel/perf_event_paranoid to 1 or set up Perf tool capabilities.
vtune: Warning: Access to /proc/kallsyms file is limited. Consider changing /proc/sys/kernel/kptr_restrict to 0 to enable resolution of OS kernel and kernel module symbols.HW event-based analysis check
Example of analysis types: Microarchitecture ExplorationCollection: Fail
vtune: Error: This analysis requires one of these actions: a) Install Intel Sampling Drivers. b) Configure driverless collection with Perf system-wide profiling. To enable Perf system-wide profiling, set /proc/sys/kernel/perf_event_paranoid to 0 or set up Perf tool capabilities.
vtune: Warning: Access to /proc/kallsyms file is limited. Consider changing /proc/sys/kernel/kptr_restrict to 0 to enable resolution of OS kernel and kernel module symbols.HW event-based analysis with uncore events
Example of analysis types: Memory AccessCollection: Fail
vtune: Error: Cannot collect memory bandwidth data. Make sure the sampling driver is installed and enabled on your system. See the Sampling Drivers help topic for more details. Note that memory bandwidth collection is not possible if you are profiling inside a virtualized environment.HW event-based analysis with stacks
Example of analysis types: Hotspots with HW event-based sampling and call stacksCollection: Fail
vtune: Error: To run this analysis, do one of the following:* Set the Stack size option to the unlimited value (0 in command line).* Provide access to the performance events system with the /proc/sys/kernel/perf_event_paranoid value set to 2 or lower.
You can also configure driverless collection using Perf tool capabilities.
vtune: Warning: Access to /proc/kallsyms file is limited. Consider changing /proc/sys/kernel/kptr_restrict to 0 to enable resolution of OS kernel and kernel module symbols.
vtune: Error: Unlimited stack size (0) not allowed in driverless mode.HW event-based analysis with context switches
Example of analysis types: Threading with HW event-based samplingCollection: Fail
vtune: Error: This analysis requires one of these actions: a) Install Intel Sampling Drivers. b) Configure driverless collection with Perf system-wide profiling. To enable Perf system-wide profiling, set /proc/sys/kernel/perf_event_paranoid to 1 or set up Perf tool capabilities.
vtune: Warning: Access to /proc/kallsyms file is limited. Consider changing /proc/sys/kernel/kptr_restrict to 0 to enable resolution of OS kernel and kernel module symbols.
vtune: Warning: Context switch data cannot be collected in the current driverless mode if the kernel version is less than 4.3 or /proc/sys/kernel/perf_event_paranoid value is greater than 1. Update your system configuration for  or consider switching to the Intel sampling driver by setting an unlimited (0) value for the Stack size option.vtune: Warning: VTune Profiler driver with insufficient permission is detected on the system.
vtune: Warning: Consider setting proper driver permissions (see the "Sampling Drivers" help topic).
vtune: Warning: Otherwise, the driverless collection with limited analysis support will be enabled by default.Checking DPC++ application as prerequisite for GPU analyses: Fail
Unable to run DPC++ application on GPU connected to this system. If you are using an Intel GPU and want to verify profiling support for DPC++ applications, check these requirements:
* Install Intel(R) GPU driver.
* Install Intel(R) Level Zero GPU runtime.
* Install Intel(R) oneAPI DPC++ Runtime and set the environment.The check observed a product failure on your system.
Review errors in the output above to fix a problem or contact Intel technical support.The system is ready for the following analyses:
* Performance SnapshotThe following analyses have failed on the system:
* Hotspots and Threading with user-mode sampling
* Hotspots with HW event-based sampling, HPC Performance Characterization, etc.
* Microarchitecture Exploration
* Memory Access
* Hotspots with HW event-based sampling and call stacks
* Threading with HW event-based sampling
* GPU Compute/Media Hotspots (characterization mode)
* GPU Compute/Media Hotspots (source analysis mode)Log location: /tmp/vtune-tmp-dell/self-checker-2023.07.18_02.16.19/log.txt
2.5 部分功能开启
2.5.1 ptrace
# ptrace
sudo vim /etc/sysctl.d/10-ptrace.conf # 修改值为0
sudo sysctl --system -a -p | grep yama # 应用配置,或者也可以选择重启电脑
2.5.2 Sampling Drivers
见第三章.
2.6 Memory Access功能
如果要使用Memory Access功能,需要安装Sampling Drivers,否则会报错(未存截图)。
三、安装Sampling Drivers
3.1 Sampling Drivers下载
有一个(文档),它里面说本地有驱动的源码。
$ ls /opt/intel/oneapi/vtune/latest/sepdk
include  src  vtune-layer
如果本地没有,网上有一个压缩包版本的,下载地址,下载之后解压到对应文件夹(
/opt/intel/oneapi/vtune/latest/sepdk)即可。sudo mkdir -p /opt/intel/oneapi/vtune/latest/sepdk tar zxvf sepdk.tar.gz -C /opt/intel/oneapi/vtune/latest/sepdk
3.2 Sampling Drivers编译
参考
$ cd /opt/intel/oneapi/vtune/latest/sepdk/src
$ sudo ./build-driver
....
************ Built drivers are copied to /opt/intel/oneapi/vtune/2023.1.0/sepdk/src/socwatch/drivers directory ************
Done
Done building the drivers
3.3 Sampling Drivers安装
cd /opt/intel/oneapi/vtune/latest/sepdk/src
sudo ./insmod-sep -r -g sudo
其中,-g参数是用于指定用户组,这里指定了sudo用户组。getent group sudo命令可以查看sudo用户组的各个用户。
3.4 Sampling Drivers开机启动
cd /opt/intel/oneapi/vtune/latest/sepdk/src
sudo ./boot-script --install -g sudo
3.5 测试
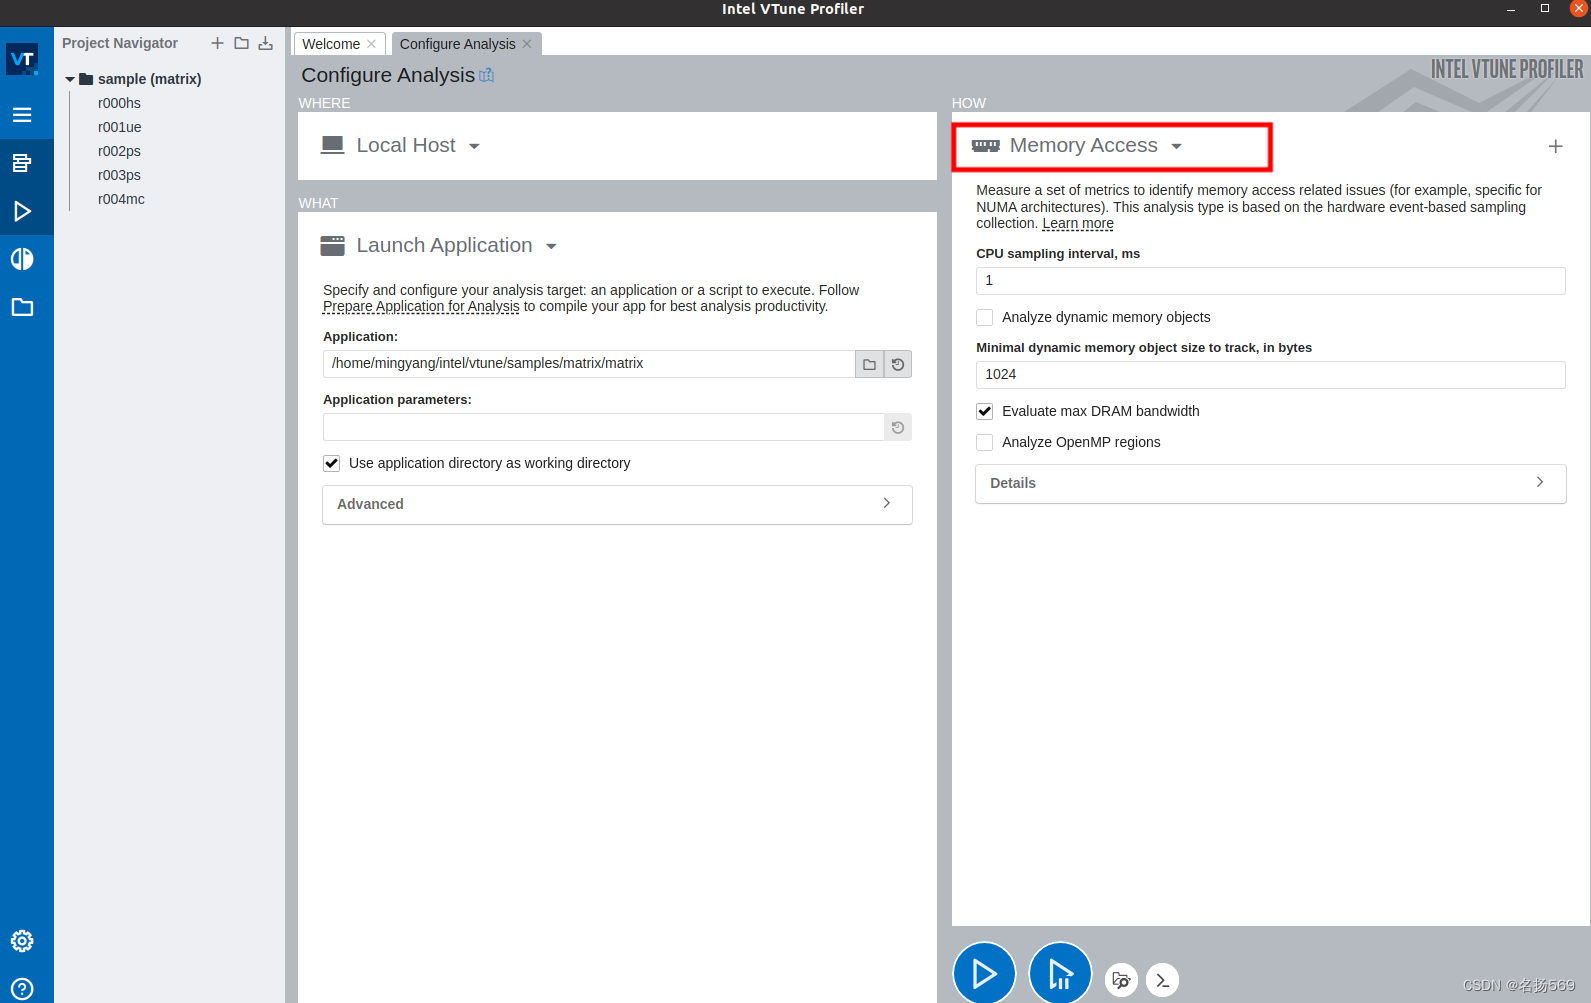
3.5.1 [可选] 图形化界面(查看Memory Access功能)
vtune-gui
新建项目,选择Memory Access,完成后的截图:
3.5.2 重新检查功能
cd /opt/intel/oneapi/vtune/latest
python3 ./bin64/self_check.py
运行记录如下,可以看到已经很多模块是可以使用了(除了GPU的)
The system is ready for the following analyses:
* Performance Snapshot
* Hotspots and Threading with user-mode sampling
* Hotspots with HW event-based sampling, HPC Performance Characterization, etc.
* Microarchitecture Exploration
* Memory Access
* Hotspots with HW event-based sampling and call stacks
* Threading with HW event-based samplingThe following analyses have failed on the system:
* GPU Compute/Media Hotspots (characterization mode)
* GPU Compute/Media Hotspots (source analysis mode)
四、远程 VTune Profiler
4.1 准备工作
4.1.1 安装VTune(本地和远程)
本地需要打开Intel VTune软件,因此需要安装VTune(但是应该不需要安装驱动这些吧,没试)
远程需要运行Intel VTune软件,因此也需要安装VTune
具体安装方法和前面的一样。
如果远端服务器未配置好(或者ip和端口没指定好),会报错
Please, check that the command '/opt/intel/oneapi/vtune/latest/bin64/amplxe-runss -V' is run successfully on the target.
4.1.2 配置SSH免密登陆
方法之一(其它方法略)
ssh-copy-id user@ip -p port
4.1.2 尝试连接
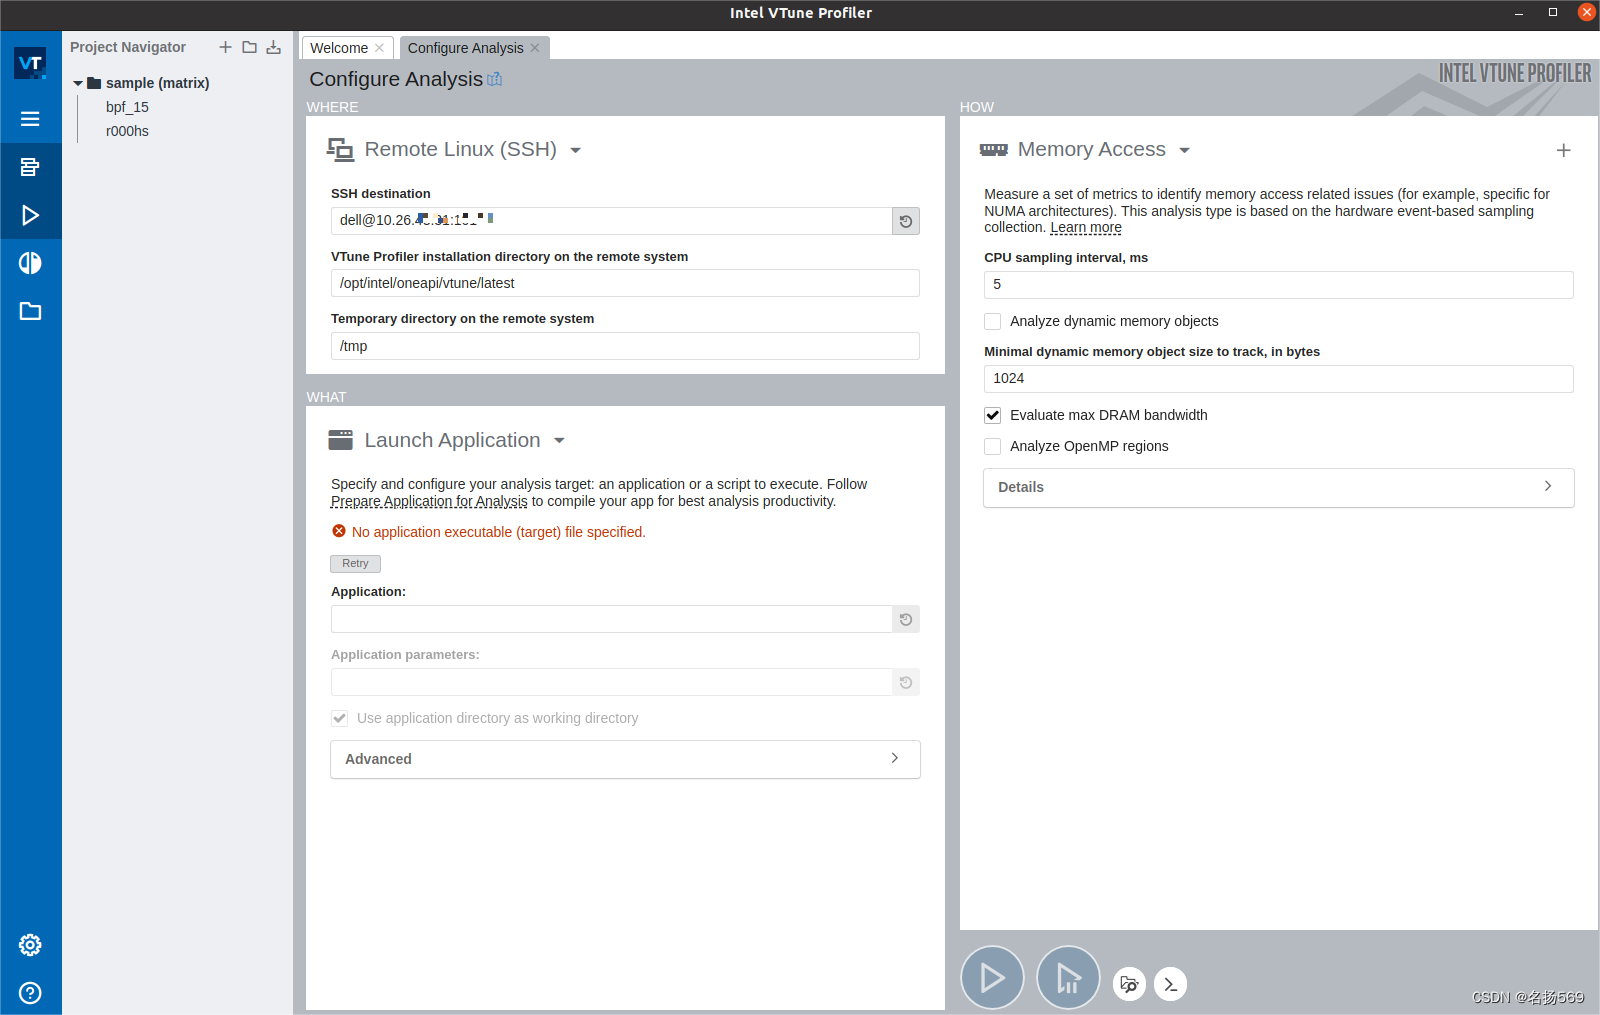
如下图,
1、设置ip,user,port,注意这里的格式是user@ip:port
2、指定目录
3、指定应用程序
截图:
