MySql之慢Sql定位分析
定位低效率执行SQL
可以通过以下两种方式定位执行效率较低的SQL语句。
慢查询日志:通过慢查询日志定位那些执行效率较低的SQL语句,用- log-slow-queries[= file name]选项启动时, mysqld是一个包含所有执行时间超过 long_query_time秒的sql请句的日志文件。
show processlist:慢查询日志在查询结束以后才纪录,所以在应用反映执行效率出现问题的时候查询慢查询日志并不能定位问题,可以使用show processlist命令查看当前 MySQL在进行的线程,包括线程的状态、是否锁表等,可以实时地查看SQL的执行情况,同时对一些锁表操作进行优化。(info列,显示的就是问题sql语句)
explain分析执行计划
通过以上步骤定位到效率低的SQL语句后,可以通过explain关键字获取SQL语句的执行计划,描述的是SQL将以何种方式去执行,用法非常简单,就是直接加在SQL之前。
查询sql语句的执行计划:
explain select * from emp
执行结果
mysql> explain select * from emp;
+----+-------------+-------+------+---------------+------+---------+------+------+-------+
| id | select_type | table | type | possible_keys | key  | key_len | ref  | rows | Extra |
+----+-------------+-------+------+---------------+------+---------+------+------+-------+
|  1 | SIMPLE      | emp   | ALL  | NULL          | NULL | NULL    | NULL |   14 | NULL  |
+----+-------------+-------+------+---------------+------+---------+------+------+-------+
1 row in set (0.01 sec)
explain字段
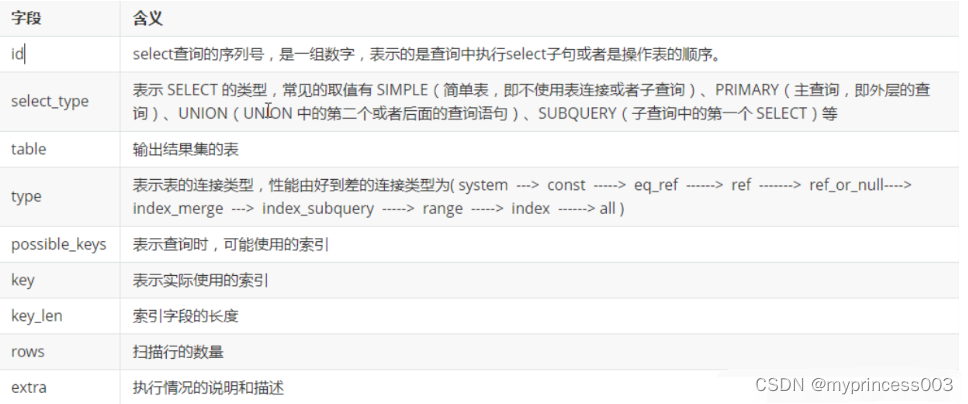
id
一系列数字,表示SQL语句执行的序列号,代表了操作的顺序。id情况有三种:
id相同,加载表的顺序是从上到下
id不同,id值越大,优先级越高,越先被执行
id有相同,也有不同,同时存在。id相同的可以认为是一组,从上往下顺序执行。在所有的组中,id的值越大,优先级越高,越先执行
select_type
主要是用来区分查询的类型,是普通查询、连接查询、还是子查询。值对应的解释如下
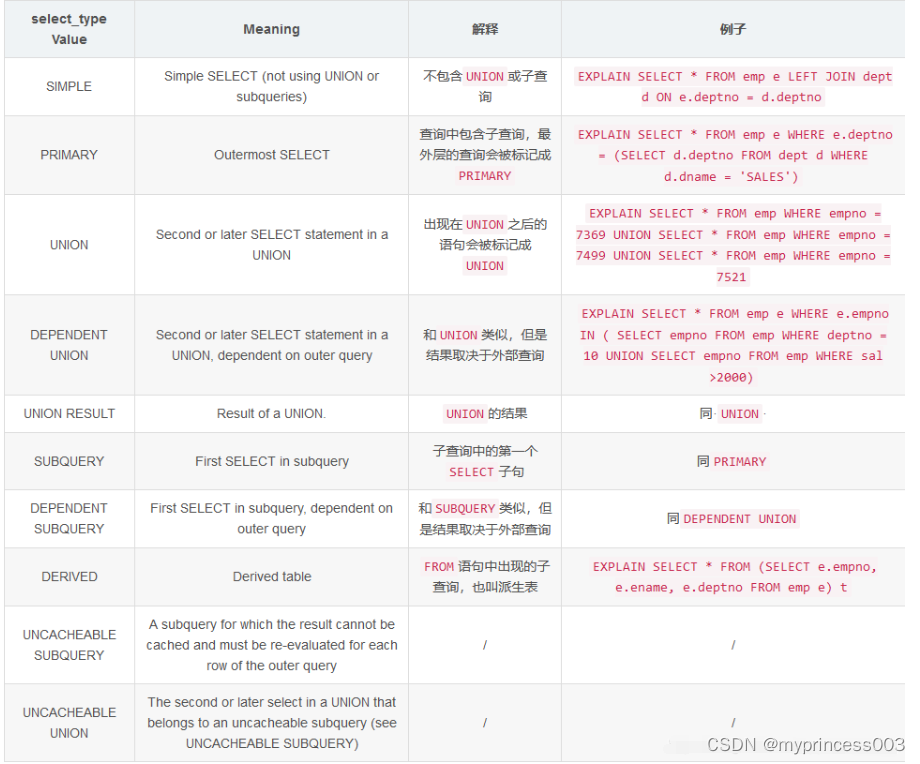
从上往下,效率越来越低。
table
表示正在访问哪一张表,是表名或者别名。也有可能是临时表或者union的结果集
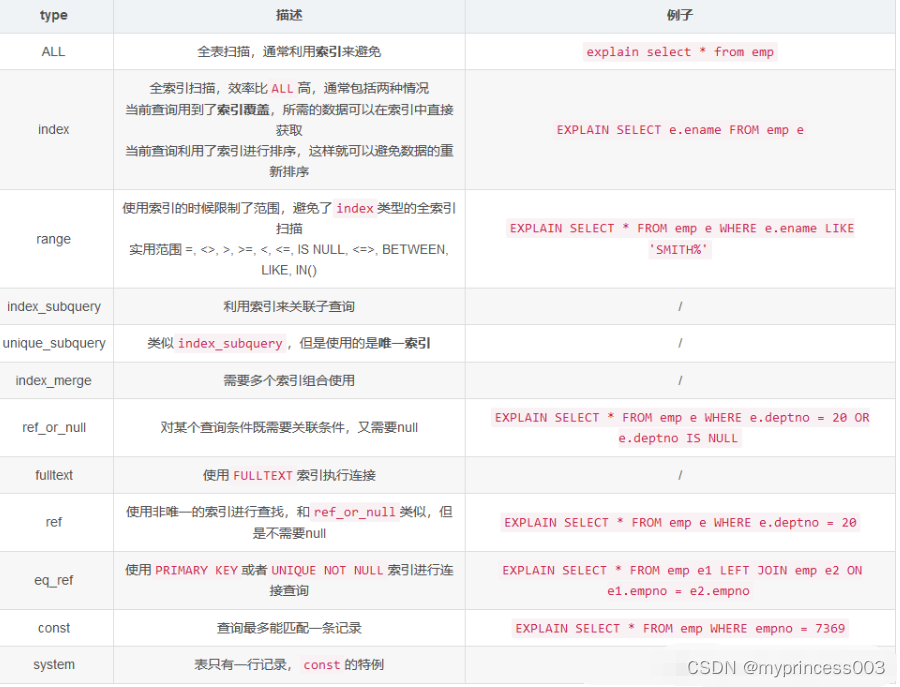
type
描述如何联接表,表示SQL语句以何种方式去访问表,找到对应的数据。访问类型有很多,效率从高到低,分别为
system > const > eq_ref > ref > fulltext > ref_or_null > index_merge > unique_subquery > index_subquery > range > index > ALL
一般情况下,得保证查询至少达到range级别,最好能达到ref
key
possible_keys:显示可能应用在这张表的索引,一个或者多个。
key:实际使用的索引,如果为null,则没有使用索引。
key_len:表示索引中使用的字节数,在满足需求的情况下,值越小越好。
rows
该SQL语句需要访问的大致行数,是一个估计值。但是这个值非常重要,在满足需求的情况下,越小越好。
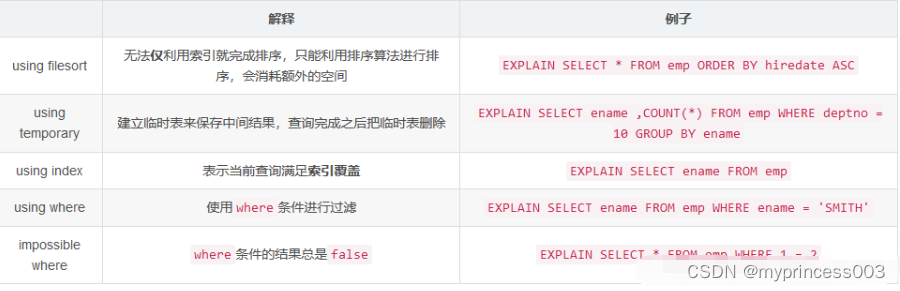
extra
其它的额外的执行计划信息,在该列展示
以上便是explain关键字的使用方式以及含义,这个关键字的作用主要用来分析索引使用情况。
需要了解的是:使用explain关键字进行分析时,SQL语句并不会执行。只是模拟MySQL优化器的执行过程,所以用explain查看的结果是叫执行计划。
show profile
explain关键字主要用来定性分析索引的使用情况,以及SQL语句的优劣,但是无法知道SQL语句的实际执行情况。而show profile命令可以做到定量分析SQL语句的执行情况。即使用者可以明确知道一条SQL到底执行了多久。
通过have_profiling参数,能够看到当前MySql是否支持profile:
SELECT @@have_profiling;
默认profiling是关闭的,可以通过set语句在session级别开启profiling:
set profiling=1;
接着执行多条SQL语句
select * from emp;
select * from dept;
执行结果不重要,主要关注各个SQL语句的执行时间
接下来再执行如下语句,显示统计成功的SQL语句
show profiles;
执行结果
mysql> show profiles;
+----------+------------+--------------------+
| Query_ID | Duration   | Query              |
+----------+------------+--------------------+
|        1 | 0.00065025 | select * from emp  |
|        2 | 0.00626150 | select * from dept |
+----------+------------+--------------------+
2 rows in set, 1 warning (0.00 sec)
可以看到MySQL已经统计了上面执行的两条SQL语句
如果想具体查看SQL语句各个步骤的详细耗时,接着执行如下SQL语句 查
看第二条SQL语句执行耗时的详细信息
show profile for query 2
执行结果
+----------------------+----------+
| Status               | Duration |
+----------------------+----------+
| starting             | 0.000164 |
| checking permissions | 0.000054 |
| Opening tables       | 0.004434 |
| init                 | 0.000037 |
| System lock          | 0.000013 |
| optimizing           | 0.000007 |
| statistics           | 0.000013 |
| preparing            | 0.000014 |
| executing            | 0.000004 |
| Sending data         | 0.001350 |
| end                  | 0.000013 |
| query end            | 0.000007 |
| closing tables       | 0.000012 |
| freeing items        | 0.000123 |
| cleaning up          | 0.000018 |
+----------------------+----------+
15 rows in set, 1 warning (0.03 sec)
执行结果展示个各个步骤以及持续的时间。
show profile语法
show profile完整的语法如下:
SHOW PROFILE [type [, type] ... ][FOR QUERY n][LIMIT row_count [OFFSET offset]]type: {ALL| BLOCK IO| CONTEXT SWITCHES| CPU| IPC| MEMORY| PAGE FAULTS| SOURCE| SWAPS
}
各个type对应的信息如下

也就是说除了各个步骤持续的时间,还可以看到BLOCK IO、CPU等信息,具体用法如下:
show profile block io, cpu for query 2
执行结果:
+----------------------+----------+----------+------------+--------------+---------------+
| Status               | Duration | CPU_user | CPU_system | Block_ops_in | Block_ops_out |
+----------------------+----------+----------+------------+--------------+---------------+
| starting             | 0.000164 | 0.000000 |   0.000000 |         NULL |          NULL |
| checking permissions | 0.000054 | 0.000000 |   0.000000 |         NULL |          NULL |
| Opening tables       | 0.004434 | 0.000000 |   0.000000 |         NULL |          NULL |
| init                 | 0.000037 | 0.000000 |   0.000000 |         NULL |          NULL |
| System lock          | 0.000013 | 0.000000 |   0.000000 |         NULL |          NULL |
| optimizing           | 0.000007 | 0.000000 |   0.000000 |         NULL |          NULL |
| statistics           | 0.000013 | 0.000000 |   0.000000 |         NULL |          NULL |
| preparing            | 0.000014 | 0.000000 |   0.000000 |         NULL |          NULL |
| executing            | 0.000004 | 0.000000 |   0.000000 |         NULL |          NULL |
| Sending data         | 0.001350 | 0.000000 |   0.000000 |         NULL |          NULL |
| end                  | 0.000013 | 0.000000 |   0.000000 |         NULL |          NULL |
| query end            | 0.000007 | 0.000000 |   0.000000 |         NULL |          NULL |
| closing tables       | 0.000012 | 0.000000 |   0.000000 |         NULL |          NULL |
| freeing items        | 0.000123 | 0.000000 |   0.000000 |         NULL |          NULL |
| cleaning up          | 0.000018 | 0.000000 |   0.000000 |         NULL |          NULL |
+----------------------+----------+----------+------------+--------------+---------------+
15 rows in set, 1 warning (0.00 sec)
补充
需要注意的是,show profile方式将从5.6.7开始不推荐使用,并且在以后的版本中会删除,改用Performance Schema
Trace分析优化器执行计划
MySQL5.6提供了对SQL的跟踪trace,通过trace文件能够进一步了解为什么优化器选择A执行计划而不是选择B执行计划,帮助我们更好地理解优化器行为。
使用方式:首先打开trace,设置格式为JSON,设置trace最大能够使用的内存大小,避免解析过程中因为默认内存过小而不能够完整显示。
mysql> SET OPTIMIZER_TRACE="enabled=on",END_MARKERS_IN_JSON=on;
Query OK, 0 rows affected (0.01 sec)
mysql> SET OPTIMIZER_TRACE_MAX_MEM_SIZE=1000000;
Query OK, 0 rows affected (0.02 sec)
执行sql语句:
SELECT * from attach_info where id <4
最后,检查INFORMATION_SCHEMA.OPTIMIZER_TRACE 就可以知道MYSQL是如何执行SQL的:
SELECT * FROM INFORMATION_SCHEMA.OPTIMIZER_TRACE;
最后会输出一个格式如下的跟踪文件:
-----------------------------+-----------------------------------+-------------------------+
| select rental_id from rental where 1=1 and rental_date >='2005-05-25 04:00:00'
and rental_date <='2005-05-25 05:00:00'and inventory_id=4466 | {"steps": [{"join_preparation": {"select#": 1,"steps": [{"expanded_query": "/* select#1 */ select `rental`.`rental_id` AS `rental_id` from `rental` where ((1 = 1) and (`rental`.`rental_date` >= '2005-05-25 04:00:00') and (`rental`.`rental_date` <= '2005-05-25 05:00:00') and (`rental`.`inventory_id` = 4466))"}] /* steps */} /* join_preparation */},{"join_optimization": {"select#": 1,"steps": [{"condition_processing": {"condition": "WHERE","original_condition": "((1 = 1) and (`rental`.`rental_date` >= '2005-05-25 04:00:00') and (`rental`.`rental_date` <= '2005-05-25 05:00:00') and (`rental`.`inventory_id` = 4466))","steps": [{"transformation": "equality_propagation","resulting_condition": "((1 = 1) and (`rental`.`rental_date` >= '2005-05-25 04:00:00') and (`rental`.`rental_date` <= '2005-05-25 05:00:00') and multiple equal(4466, `rental`.`inventory_id`))"},{"transformation": "constant_propagation","resulting_condition": "((1 = 1) and (`rental`.`rental_date` >= '2005-05-25 04:00:00') and (`rental`.`rental_date` <= '2005-05-25 05:00:00') and multiple equal(4466, `rental`.`inventory_id`))"},{"transformation": "trivial_condition_removal","resulting_condition": "((`rental`.`rental_date` >= '2005-05-25 04:00:00') and (`rental`.`rental_date` <= '2005-05-25 05:00:00') and multiple equal(4466, `rental`.`inventory_id`))"}] /* steps */} /* condition_processing */},{"substitute_generated_columns": {} /* substitute_generated_columns */},{"table_dependencies": [{"table": "`rental`","row_may_be_null": false,"map_bit": 0,"depends_on_map_bits": [] /* depends_on_map_bits */}] /* table_dependencies */},{"ref_optimizer_key_uses": [{"table": "`rental`","field": "inventory_id","equals": "4466","null_rejecting": false}] /* ref_optimizer_key_uses */},{"rows_estimation": [{"table": "`rental`","range_analysis": {"table_scan": {"rows": 16008,"cost": 1667.4} /* table_scan */,"potential_range_indexes": [{"index": "PRIMARY","usable": false,"cause": "not_applicable"},{"index": "rental_date","usable": true,"key_parts": ["rental_date","inventory_id","customer_id"] /* key_parts */},{"index": "idx_fk_inventory_id","usable": true,"key_parts": ["inventory_id","rental_id"] /* key_parts */},{"index": "idx_fk_customer_id","usable": false,"cause": "not_applicable"},{"index": "idx_fk_staff_id","usable": false,"cause": "not_applicable"}] /* potential_range_indexes */,"best_covering_index_scan": {"index": "rental_date","cost": 1607.9,"chosen": true} /* best_covering_index_scan */,"setup_range_conditions": [] /* setup_range_conditions */,"group_index_range": {"chosen": false,"cause": "not_group_by_or_distinct"} /* group_index_range */,"analyzing_range_alternatives": {"range_scan_alternatives": [{"index": "rental_date","ranges": ["0x9975b24000 <= rental_date <= 0x9975b25000"] /* ranges */,"index_dives_for_eq_ranges": true,"rowid_ordered": false,"using_mrr": false,"index_only": true,"rows": 10,"cost": 1.2638,"chosen": true},{"index": "idx_fk_inventory_id","ranges": ["4466 <= inventory_id <= 4466"] /* ranges */,"index_dives_for_eq_ranges": true,"rowid_ordered": true,"using_mrr": false,"index_only": false,"rows": 5,"cost": 4.4994,"chosen": false,"cause": "cost"}] /* range_scan_alternatives */,"analyzing_roworder_intersect": {"usable": false,"cause": "too_few_roworder_scans"} /* analyzing_roworder_intersect */} /* analyzing_range_alternatives */,"chosen_range_access_summary": {"range_access_plan": {"type": "range_scan","index": "rental_date","rows": 10,"ranges": ["0x9975b24000 <= rental_date <= 0x9975b25000"] /* ranges */} /* range_access_plan */,"rows_for_plan": 10,"cost_for_plan": 1.2638,"chosen": true} /* chosen_range_access_summary */} /* range_analysis */}] /* rows_estimation */},{"considered_execution_plans": [{"plan_prefix": [] /* plan_prefix */,"table": "`rental`","best_access_path": {"considered_access_paths": [{"access_type": "ref","index": "idx_fk_inventory_id","rows": 5,"cost": 3.8245,"chosen": true},{"rows_to_scan": 10,"access_type": "range","range_details": {"used_index": "rental_date"} /* range_details */,"resulting_rows": 10,"cost": 2.2638,"chosen": true}] /* considered_access_paths */} /* best_access_path */,"condition_filtering_pct": 100,"rows_for_plan": 10,"cost_for_plan": 2.2638,"chosen": true}] /* considered_execution_plans */},{"attaching_conditions_to_tables": {"original_condition": "((`rental`.`inventory_id` = 4466) and (`rental`.`rental_date` >= '2005-05-25 04:00:00') and (`rental`.`rental_date` <= '2005-05-25 05:00:00'))","attached_conditions_computation": [] /* attached_conditions_computation */,"attached_conditions_summary": [{"table": "`rental`","attached": "((`rental`.`inventory_id` = 4466) and (`rental`.`rental_date` >= '2005-05-25 04:00:00') and (`rental`.`rental_date` <= '2005-05-25 05:00:00'))"}] /* attached_conditions_summary */} /* attaching_conditions_to_tables */},{"refine_plan": [{"table": "`rental`"}] /* refine_plan */}] /* steps */} /* join_optimization */},{"join_execution": {"select#": 1,"steps": [] /* steps */} /* join_execution */}] /* steps */
} |                                 0 |                       0 |