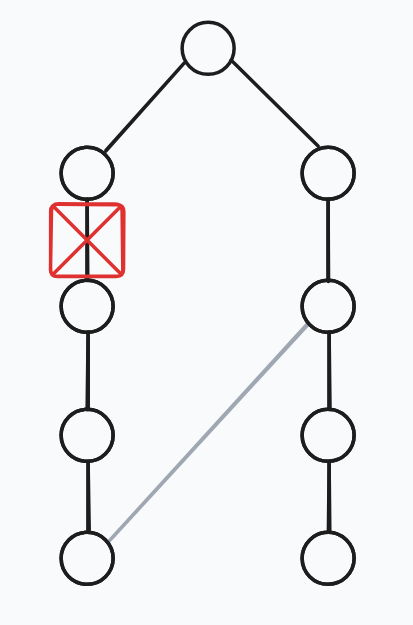
效果这样
直接上代码吧
<template><div ref="chartDom" style="width: 260px; height: 460px; background-color: white"></div>
</template><script setup lang="ts">
// import { useI18n } from 'vue-i18n'
// import { useQuasar } from 'quasar'
import * as echarts from 'echarts'
import { computed, nextTick, onMounted, ref, useTemplateRef } from 'vue'// const { t } = useI18n()
const chartDom = useTemplateRef('chartDom')
let chartInstance: echarts.ECharts | null = null
let data = 0
const domHeight = ref(0)
const domWidth = ref(0)
const blockHeight = ref(4) // 小白块长度
const blockWidth = ref(50) // 小白块宽度 (比下面那个加2就行)
const progressWidth = ref(48)
const name = ref('示例数据')
const radius = computed(() => ((domHeight.value > domWidth.value ? domWidth.value : domHeight.value) * 0.75) / 2,
) // 图形的半径
const pi = Math.PI // ≈3.141592653589793onMounted(async () => {await nextTick()chartInstance = echarts.init(chartDom.value)if (!chartDom.value) {console.error('Chart DOM element is not available')return}domHeight.value = chartInstance.getHeight()domWidth.value = chartInstance.getWidth()const option: echarts.EChartsOption = {series: [{type: 'gauge',center: ['50%', '60%'],startAngle: 180,endAngle: 0,min: 0,max: 100,splitNumber: 1,itemStyle: {color: new echarts.graphic.LinearGradient(0, 1, 0, 0, [{ offset: 1, color: '#ffffff' }, // 渐变色的开始颜色{ offset: 0, color: '#f7b733' }, // 渐变色的结束颜色]),},progress: {show: true,width: progressWidth.value,},pointer: {show: false,},axisLine: {lineStyle: {width: progressWidth.value,},},axisTick: {distance: 0,splitNumber: 5,lineStyle: {width: 2,color: '#999',},show: false,},splitLine: {distance: -52,show: false,length: 14,lineStyle: {width: 3,color: '#999',},},axisLabel: {distance: 40,padding: [10, -5, 0, 0],height: 40,width: 20,color: '#999',fontSize: 12,lineHeight: 56,rich: {a: {// 没有设置 `lineHeight`,则 `lineHeight` 为 56},},},anchor: {show: false,},title: {show: true,color: '#999',fontSize: 10,offsetCenter: [0, 15],},detail: {valueAnimation: true,width: '20%',lineHeight: 40,borderRadius: 8,offsetCenter: [0, '-6%'],fontSize: 18,fontWeight: 'bolder',formatter: '{value}%',color: 'black',}, //百分比那一行的data: [{name: name.value,value: data,},], //title那里的显示name是在这里,百分比值也是这个value来决定的},],graphic: [{id: 'endBlock',type: 'rect',shape: {width: blockWidth.value,height: blockHeight.value,r: [2, 2, 2, 2],}, //长宽zlevel: 100,style: {fill: '#FFFFFF',shadowColor: '#999999',shadowBlur: 2,},originX: radius.value + 1,originY: 0,// position: [19, 95], // 初始占位坐标x: (domWidth.value - radius.value * 2) / 2 - (blockWidth.value % 2 != 0 ? 0 : 1),y: domHeight.value * 0.6, //因为上面center那里Y轴是在60%,需要自己调整transition: ['rotation'],rotation: 0,},],}chartInstance.setOption(option)chartInstance.setOption({series: [{data: [{name: name.value,value: data,},],},],graphic: [{id: 'endBlock',rotation: 0, // 方向修正},],})setInterval(function () {data = +(Math.random() * 60).toFixed(2)if (chartInstance) {chartInstance.setOption({series: [{data: [{name: name.value,value: data,},],},],graphic: [{id: 'endBlock',rotation: -((data / 100) * pi) - 0.01, // 方向修正},],})}}, 2000)
})
</script>
setOptions第二次是因为要处理白块跟进度条初始化时不同步的问题,echarts我不是特别熟,不知道有没有别的办法。只能用笨方法了
翻echarts官方没找到特别相符的,百度也只找到了那种圆球实现,如果又更好的实现也麻烦评论区回复一下,感谢