示例源码1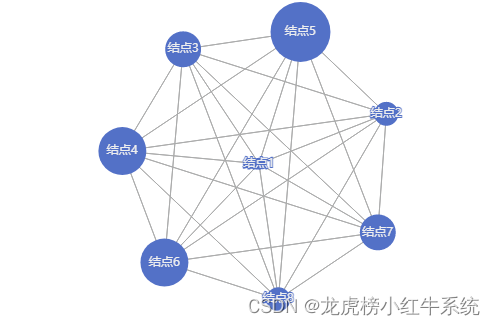
from pyecharts import options as opts
from pyecharts.charts import Graphnodes = [{"name": "结点1", "symbolSize": 10},{"name": "结点2", "symbolSize": 20},{"name": "结点3", "symbolSize": 30},{"name": "结点4", "symbolSize": 40},{"name": "结点5", "symbolSize": 50},{"name": "结点6", "symbolSize": 40},{"name": "结点7", "symbolSize": 30},{"name": "结点8", "symbolSize": 20},
]
links = []
for i in nodes:for j in nodes:links.append({"source": i.get("name"), "target": j.get("name")})
c = (Graph().add("", nodes, links, repulsion=8000).set_global_opts(title_opts=opts.TitleOpts(title="Graph-基本示例")).render("graph_base.html")
)
示例源码02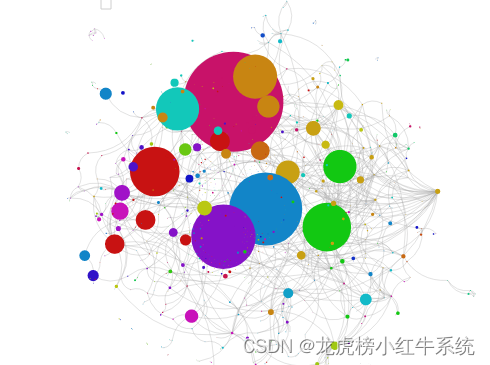
import asyncio
from aiohttp import TCPConnector, ClientSessionimport pyecharts.options as opts
from pyecharts.charts import Graphasync def get_json_data(url: str) -> dict:async with ClientSession(connector=TCPConnector(ssl=False)) as session:async with session.get(url=url) as response:return await response.json()# 获取官方的数据
data = asyncio.run(get_json_data(url="https://echarts.apache.org/examples/data/asset/data/npmdepgraph.min10.json")
)nodes = [{"x": node["x"],"y": node["y"],"id": node["id"],"name": node["label"],"symbolSize": node["size"],"itemStyle": {"normal": {"color": node["color"]}},}for node in data["nodes"]
]edges = [{"source": edge["sourceID"], "target": edge["targetID"]} for edge in data["edges"]
](Graph().add(series_name="",nodes=nodes,links=edges,layout="none",is_roam=True,is_focusnode=True,label_opts=opts.LabelOpts(is_show=False),linestyle_opts=opts.LineStyleOpts(width=0.5, curve=0.3, opacity=0.7),).set_global_opts(title_opts=opts.TitleOpts(title="NPM Dependencies")).render("npm_dependencies.html")
)