前述
在前文的multi Agents for Data Analysis的设计说起,本文将继续探索和测试借助llm实现基于私有知识库的数据治理全自动化及智能化。整体设计如下:
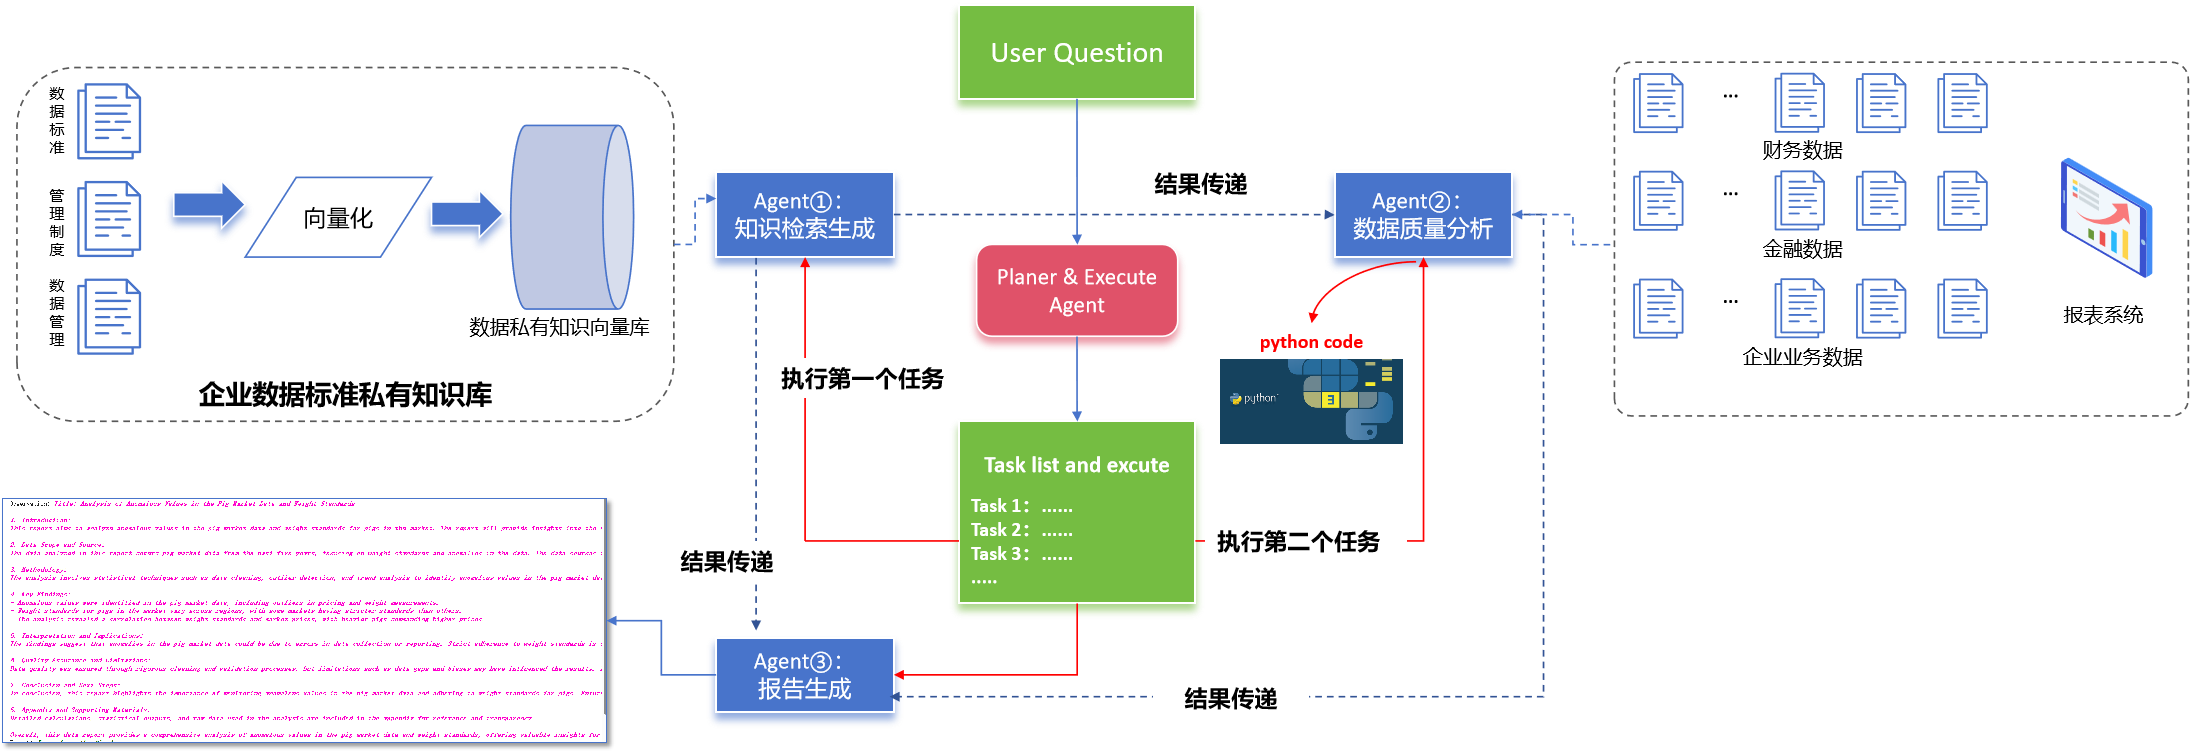
整个体系设计了3个Agent以及一个Planer&Execute Agent,第一个Agent用于从企业数据标准私有知识库中检索生成与用户问题相关联的知识块,第二个Agent用于结合企业或者用户的数据做数据质量分析,第三个Agent用于根据用户的问题或者其他Agent的结果总结生成报告;Planer&Excute Agent用于根据用户的问题规划任务及调度Agents执行。**本文实践的例子流程是这样的:**根据用户的私有知识库检索数据治理的流程或者数据的标准范围,根据该标准或者流程,分析用户上传的数据的异常值及数据质量,撰写数据质量报告。
一、Agent①:知识检索
使用create_retriever_tool及 ZeroShotAgent构建第一个Agent用于从私有知识库检索生成相关的知识块。
model_id = "iic/nlp_corom_sentence-embedding_english-base"
embeddings = HuggingFaceEmbeddings(model_name="sentence-transformers/paraphrase-multilingual-MiniLM-L12-v2")
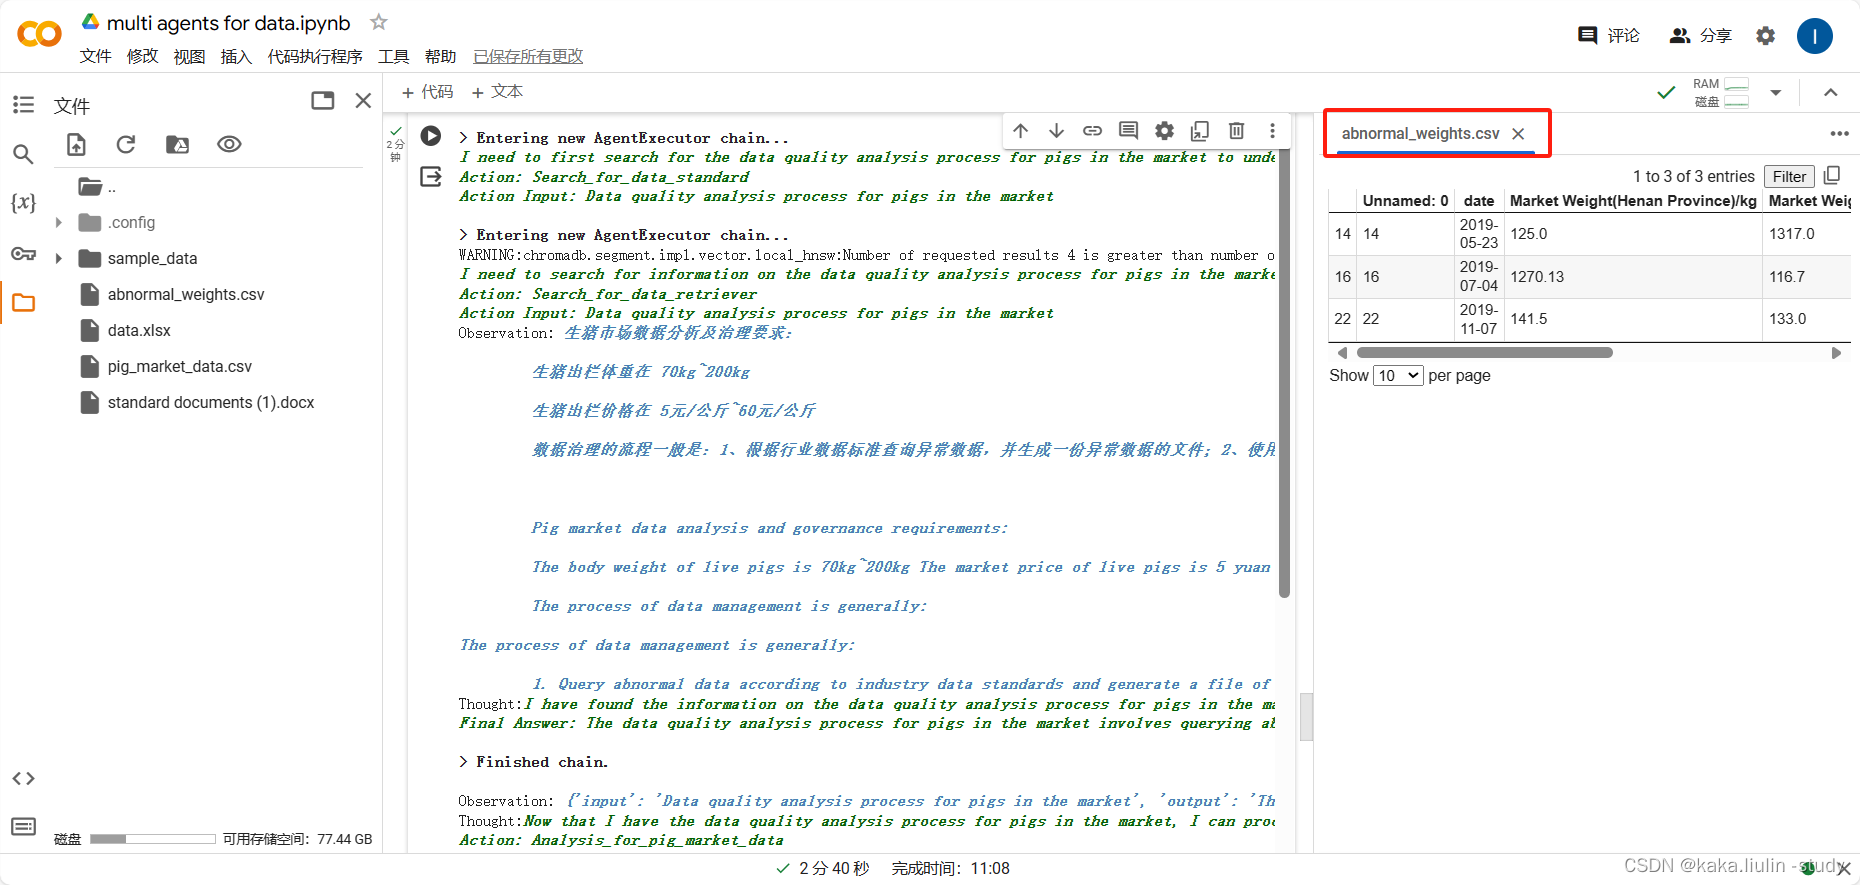
loader = Docx2txtLoader('./standard documents (1).docx')
docs = loader.load()
text_splitter = RecursiveCharacterTextSplitter(
chunk_size=500, chunk_overlap=150)
split_docs = text_splitter.split_documents(docs)
vectordb = Chroma.from_documents(documents=split_docs,embedding=embeddings)
retriever_tool = create_retriever_tool(vectordb.as_retriever(), "Search_for_data_retriever", "which you can retriever relate data block."
)tools_kg = [retriever_tool]
memory = ConversationBufferMemory(memory_key="chat_history",human_prefix="Input",ai_prefix="Response",input_key="question",return_messages=False,
)
template_kg = 'You are a knowledge retrieval and generation tool that searches for relevant text based on user questions and generates answers accordingly.'
agent_kg = ZeroShotAgent.from_llm_and_tools(llm=llm,tools=tools_kg,prefix=template_kg,)
二、Agent②:数据分析
1、提示词设计:包含三个部分,工具的简单介绍,数据基础信息的提示(dhead),可参考的例子。
TEMPLATE_dt = """You are working with a pandas dataframe in Python. The name of the dataframe is `df`.
It is important to understand the attributes of the dataframe before working with it. This is the result of running `df.head().to_markdown()`<df>
{dhead}
</df>You are not meant to use only these rows to answer questions - they are meant as a way of telling you about the shape and schema of the dataframe.
You also do not have use only the information here to answer questions - you can run intermediate queries to do exporatory data analysis to give you more information as needed.You possess  essential tools:  `python_repl_dt`: With this tool, you can analyze and process the data retrieved from df using Python code.When facing a question, assess whether you need to employ these tools iteratively.Example:
<question>It is known that the price interval for apples in the market is between 5 and 20 yuan per kilogram; your task is to detect any anomalous values within the set of apple market price quotes. </question>
<logic>First, To begin with, you should scrutinize the user's query, where in the user has furnished an essential detail: that the benchmark data range for apple prices is from 5 to 20 yuan per kilogram.Then, leverage `python_repl_dt` to detect any anomalous values based on the retrieved data.the code write by python_repl_dt:'''import pandas as pddf[df['apple'].lt(10) | df['apple'].gt(20)].to_csv('abnormal_data.csv')the output should print the anomalous,and output a file named apple market price anomalous.csv.
</logic>
If you have not found the precise answer, please iteratively use the tools.
"""
2、工具的构建及Agent的组装
#使用PythonAstREPLTool工具
repl = PythonAstREPLTool(locals={"df": df},name="python_repl_dt",description="The tool is used to generate Python code analysis based on the 'df' named pig_market_data ,runs the code and outputs both the code and the results of the computation.",#args_schema=PythonInputs,
)
tools_re = [repl]
#Agent_dt
template_dt = TEMPLATE_dt.format(dhead=df.head().to_markdown())
agent_dt = ZeroShotAgent.from_llm_and_tools(llm=llm,tools=tools_re,prefix=template_dt,)
agent_dt = AgentExecutor(agent=agent_dt, tools=tools_re, max_iterations=50, handle_parsing_errors=True,early_stopping_method="generate",verbose=True)
三、Agent③:总结报告
1、提示词设计:设计一个总结报告的基础框架,包含目的、背景、过程、结论、建议等。
template_bg = """As a Data Analys, please compose a comprehensive data report addressing the user's inquiry:{question}, adhering to the following guidelines:1.Introduction: Begin with a clear and concise overview of the purpose of the report, briefly outlining the user's question or problem statement. This section should set the context and provide a roadmap for the content that follows.2.Data Scope and Source: Specify the scope of the data analyzed, including relevant timeframes, geographical coverage, and any specific datasets utilized. Mention the sources from which the data was obtained, emphasizing their credibility and relevance to the analysis.3.Methodology: Describe the analytical methods employed to examine the data, including any statistical techniques, models, or tools used. Explain why these methods were chosen and how they contribute to answering the user's question. Outline any assumptions, limitations, or caveats associated with the methodology.4.Key Findings: Present the main insights derived from the analysis in a structured and visually appealing manner, using tables, charts, graphs, or other appropriate visualizations. Accompany each finding with a clear explanation and, where applicable, quantitative measures such as percentages, averages, or trends. Ensure findings are directly responsive to the user's inquiry and are contextualized within the broader data landscape.5.Interpretation and Implications: Interpret the key findings, drawing meaningful conclusions and highlighting their significance. Relate these conclusions back to the user's question, explaining how they address the initial concerns or objectives. Discuss any potential implications for business decisions, strategy, or further research, and offer actionable recommendations where appropriate.6.Quality Assurance and Limitations: Discuss the steps taken to ensure data quality throughout the analysis process, such as data cleaning, validation, and outlier detection. Acknowledge any limitations or challenges encountered during the analysis, including data gaps, inconsistencies, or inherent biases, and discuss how these may have influenced the results and conclusions.7.Conclusion and Next Steps: Summarize the key takeaways from the report, reinforcing the most important findings and their implications. Suggest potential avenues for future analysis or data collection that could further enhance understanding or address remaining questions. Encourage user engagement by inviting feedback or follow-up inquiries.8.Appendix and Supporting Materials: Include any additional information, detailed calculations, or raw data that support the analysis but would disrupt the flow of the main report. This might include detailed statistical outputs, full dataset summaries, or detailed descriptions of complex methodologies.By adhering to these guidelines, your data report will effectively communicate the results of your analysis, address the user's question thoroughly, and provide a robust foundation for informed decision-making.
"""
2、Agent的构建
prompt = ChatPromptTemplate.from_template(template_bg)
chain_bg = ({"question": RunnablePassthrough()}| prompt| llm| StrOutputParser()
)
四、Planer&Execute Agent设计及构建
1、方式一:使用ZeroShotAgent+提示词的方式构建一个任务规划及调度执行的Agent
(1)提示词的设计:包含三部分,介绍该Agent的基础信息(角色定位、工具库)、任务执行的流程、可参考的例子
template= """As an AI data analyst, it is crucial to optimize workflow by utilizing tools within the tool library, especially "Search_for_data_standard" 、 "Analysis_for_pig_market_data" and "Tool_for_Data_analysis_report". Below are streamlined methods for efficiently handling user inquiries:1. **Task Understanding & Strategy Formulation**:- Firstly, comprehensively understand the user's requirements and constraints, aligning with industry expertise and best practices.- Develop personalized data analysis strategies, setting operational guidelines for each data item based on established norms.- Based on the user's questions, output a matching task list.2. **Utilizing "Search_for_data_standard" to Establish Data Analysis Framework and Standards**:- Within the strategy, define standards and guidelines for each data item to ensure alignment with business context and analysis objectives.3. **Performing Data Analysis Using "Analysis_for_pig_market_data" Tool**:- Employ the "Analysis_for_pig_market_data" tool to analyze data uploaded by the user, following the framework and standards established by "Search_for_data_standard".— That is, the input of tool "Analysis_for_pig_market_data" should contain the framework and standards established by "Search_for_data_standard".
4. ** Utilize the "Tool_for_Data_analysis_report" to craft a report.— Compose a data analysis report based on industry knowledge and standards (query by "Search_for_data_standard" ), data analysis results("Analysis_for_pig_market_data" output), and user inquiries.Example:
<question>Please calculate the cost and profit of the company's batch products for this year, and identify the batches of products that exceed the average cost. And generate a financial report</question>
<logic>First, Based on the user's questions, plan a task list and execution process:1. Use tool "Search_for_data_standard" to search and generate the company's financial management system and cost accounting process;2. According to the system or process, use tool "Analysis_for_pig_market_data" to analyze financial data, including batch cost, profit, and batch product ranking;3. Write financial analysis reports using "Tool_for_Data_analysis_report" tools based on management systems, cost accounting processes, data analysis, etc.
<task1>Use tool "Search_for_data_standard" to search and generate......
task1 output: The cost of product batches should be between 10-20 yuan/kg
<task2>use tool "Analysis_for_pig_market_data" to analyze financial data......
task2 input: the batch cost of the product should be between 10-20 yuan/kg. Analyze products with unreasonable batch costs
task2 output:'''import pandas as pddf[df['apple'].lt(10) | df['apple'].gt(20)].to_csv("the batch cost of the product  anomalous.csv", index=False)'''
<task3>Write a report using tool "Tool_for_Data_analysis_report"......
task3 input: the company's financial management system and cost accounting process,Financial data analysis results.....
task3 output: Our company's batch cost analysis overview is as follows: the average cost of a batch is 15 yuan/batch, and the batches of products that exceed the abnormal cost warning value include A, B, C, etc......
</logic>"""
(2)工具库及P-Agent的构建
tools = [Tool(name = "Search_for_data_standard",func=agent_KG.invoke,description="By retrieving relevant text, obtain industry standards, data analysis strategies related to user questions, and summarize and generate answers."),Tool(name = "Analysis_for_pig_market_data",func=agent_dt.invoke,description="A tool used to excute code analyze the situation in the data named pig_market_data, where the data is the slaughter weight and price data of the pig market."),Tool(name = "Tool_for_Data_analysis_report",func=chain_bg.invoke,description="As a Data Analyst, please compose a comprehensive data report addressing the user's inquiry."),]agent = ZeroShotAgent.from_llm_and_tools(llm=llm,tools=tools,prefix=template,)
agent_executor = AgentExecutor(agent=agent, tools=tools, max_iterations=150, handle_parsing_errors=True,early_stopping_method="generate",verbose=True)
2、方式二、使用langchain 的plan & excute模块
from langchain_experimental.plan_and_execute import PlanAndExecute, load_agent_executor, load_chat_plannerplanner = load_chat_planner(llm,template)
executor = load_agent_executor(llm, tools, verbose=True)agent = PlanAndExecute(planner=planner, executor=executor, verbose=True)
五、实践结果讨论
任务一:
从标准私有知识库中检索数据标准(生猪体重标准范围),根据此标准分析用户数据中的异常值,生成一份异常数据表,并根据数据标准与异常数据情况撰写数据质量分析报告。
agent_executor.invoke({'input':'''Obtain the weight standards for pigs in the market;
According to this standard, Identify abnormal weight values in data named pig_market_data from various provinces and cities across the country that exceed the slaughter standard weight range,
And generate a csv containing the identified outliers,above all,
Write a data quality analysis report.'''})
①任务规划:
steps=[Step(value='Use tool "Search_for_data_standard" to search and generate weight standards for pigs in the market; ')
Step(value='According to the weight standards, use tool "Analysis_for_pig_market_data" to analyze the data named pig_market_data from various provinces and cities across the country, identifying abnormal weight values that exceed the slaughter standard weight range; ')
Step(value='Generate a CSV file containing the identified outliers;')
Step(value='Write a data quality analysis report based on the weight standards, data analysis results, and identified outliers.\n</logic>\n\n<task1>Use tool "Search_for_data_standard" to search and generate weight standards for pigs in the market.\ntask1 output: The weight standards for pigs in the market should be between 100-150 kg.\n\n<task2>Use tool "Analysis_for_pig_market_data" to analyze the data named pig_market_data from various provinces and cities across the country.\ntask2 input: The weight standards for pigs in the market should be between 100-150 kg. Analyze data to identify abnormal weight values that exceed the slaughter standard weight range.\ntask2 output: \n```python\nimport pandas as pd\ndf[df[\'weight\'].lt(100) | df[\'weight\'].gt(150)].to_csv("abnormal_weight_values.csv", index=False)\n```\n\n<task3>Write a report using tool "Tool_for_Data_analysis_report" based on weight standards, data analysis results, and identified outliers.\ntask3 input: Weight standards for pigs in the market, data analysis results, identified outliers in the data.\ntask3 output: The data quality analysis report includes information on the weight standards, analysis of abnormal weight values exceeding the slaughter standard weight range, and recommendations for data quality improvement.\n')]
②执行第一个Agent:知识检索生成,从私有知识库检索生成生猪出栏体重标准为70~200kg。
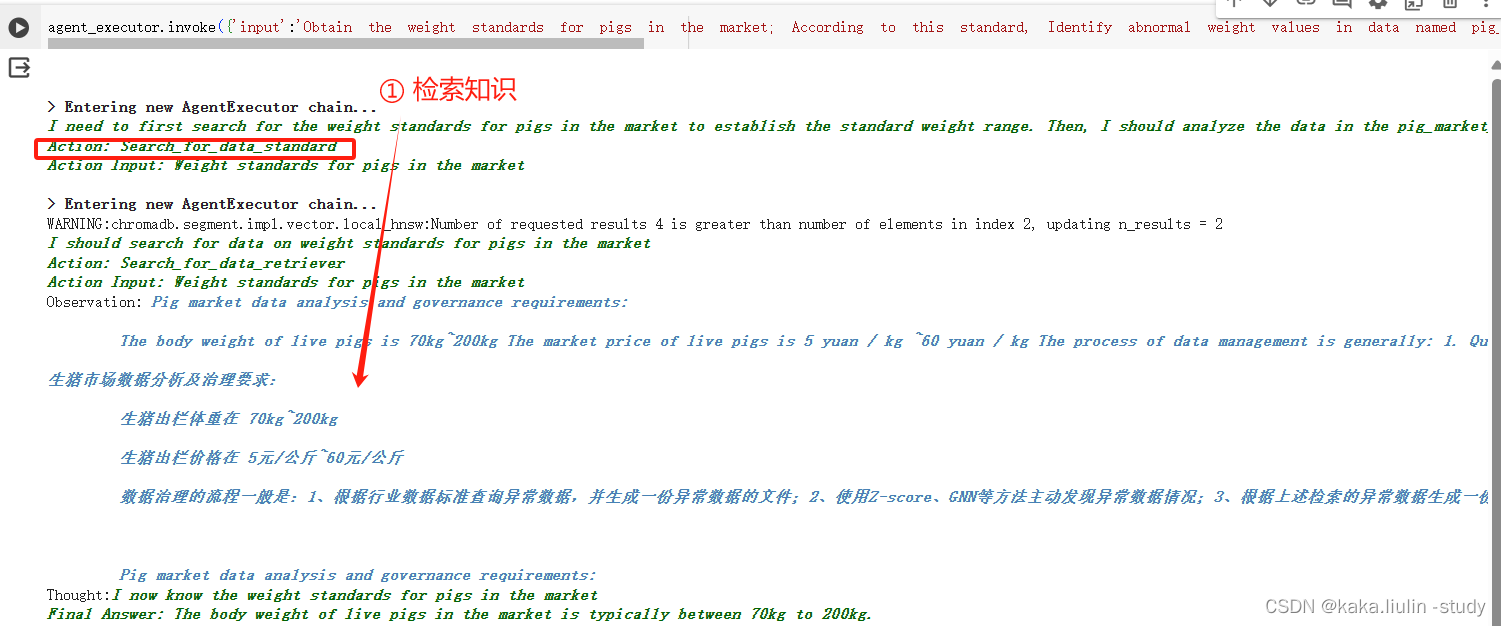
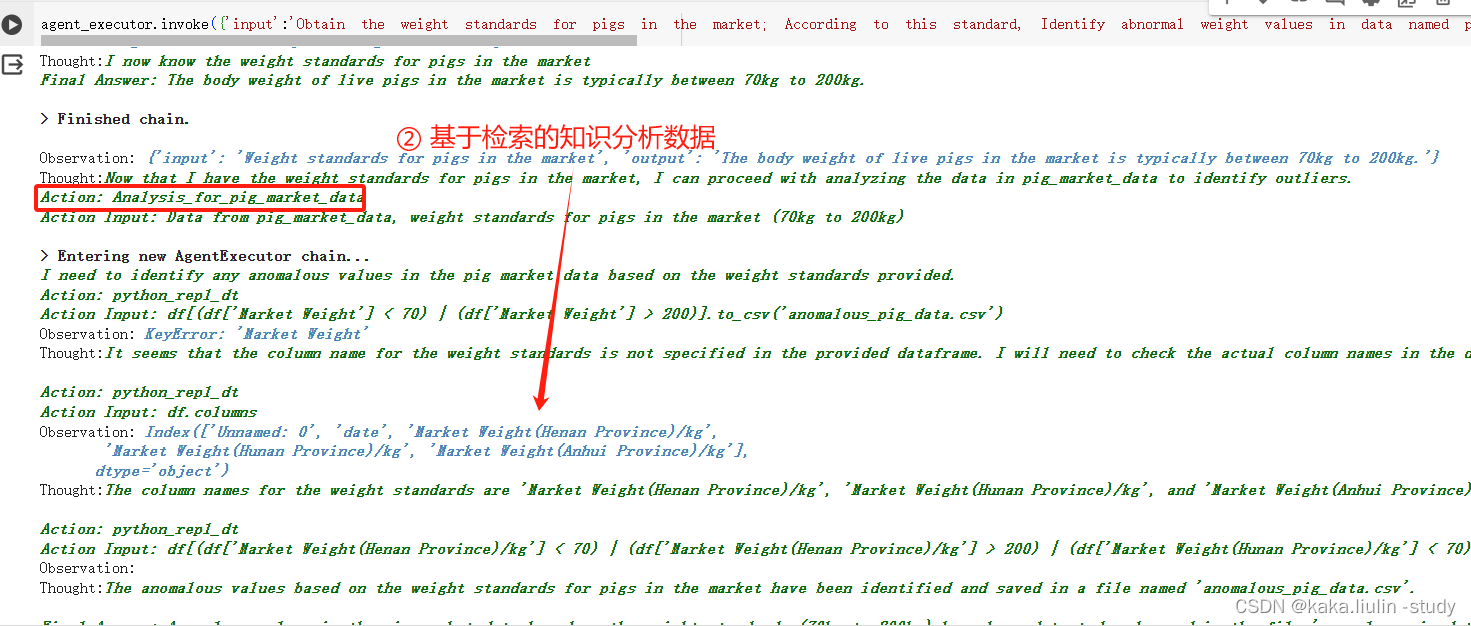
③执行第二个Agent:数据质量分析,根据生猪出栏体重标准范围【70,200】,查询异常值并生成异常数据文件。
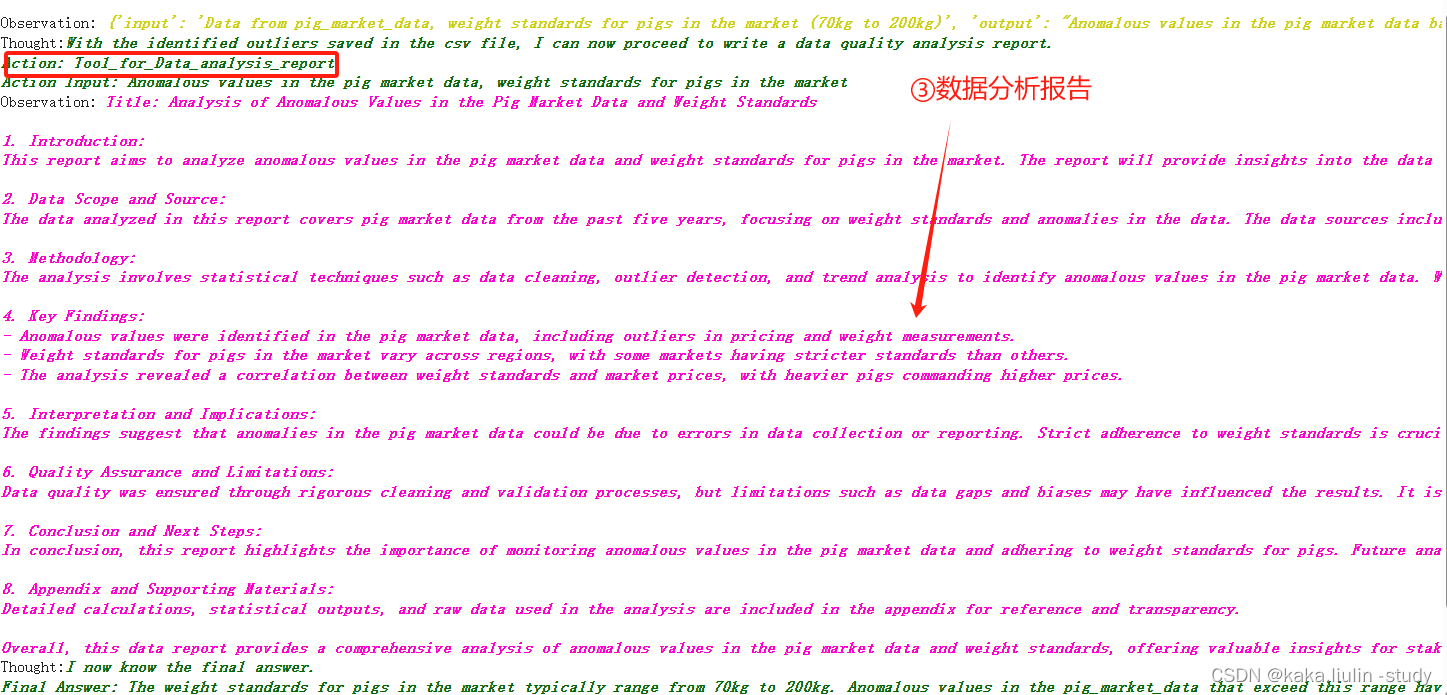
④执行第三个Agent:数据质量报告撰写,根据提供的数据分析报告模板撰写报告。
任务二:从私有知识库中检索生成数据质量分析流程,根据此流程分析用户数据中的异常值,生成一份异常数据表,并根据数据标准与异常数据情况撰写数据质量分析报告。
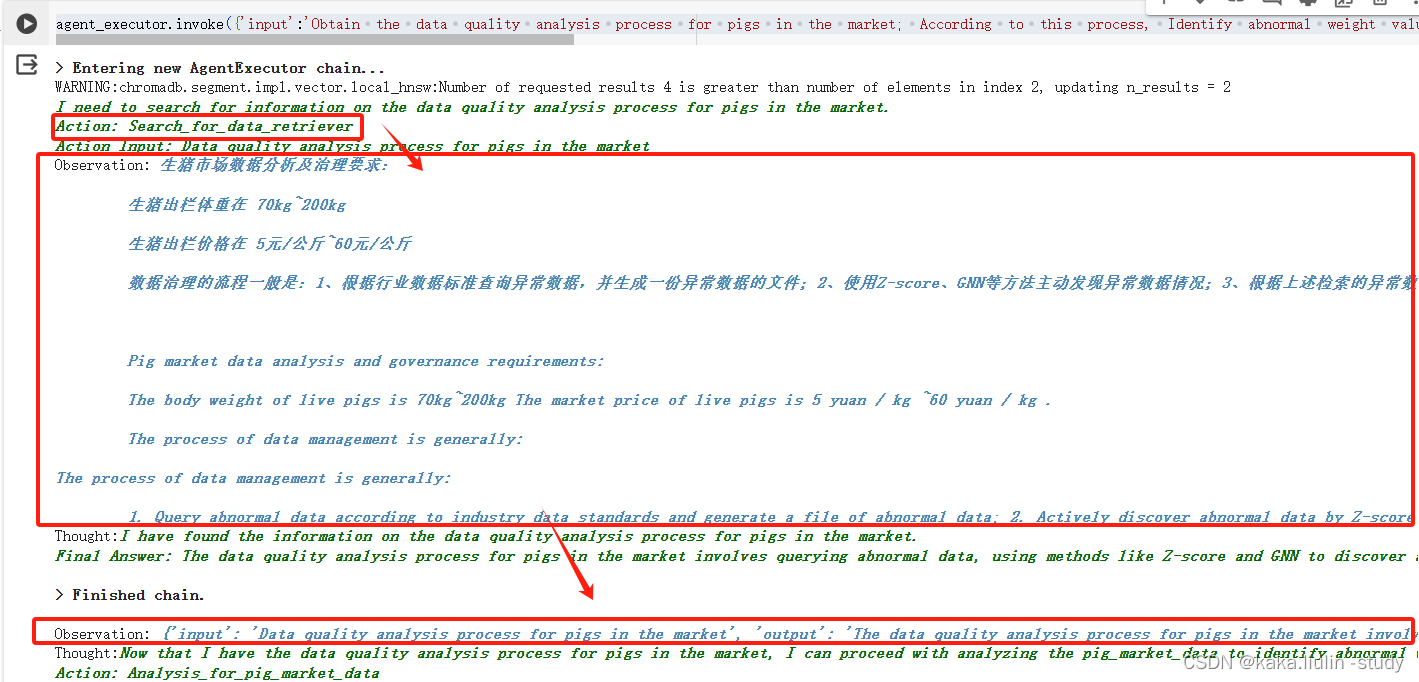
agent_executor.invoke({'input':'Obtain the data quality analysis process for pigs in the market; According to this process, Identify abnormal weight values in data named pig_market_data from various provinces and cities across the country that exceed the slaughter standard weight range,And generate a csv containing the identified outliers,above all, Write a data quality analysis report.'})
①任务规划
I need to first search for the data quality analysis process for pigs in the market to understand the standards and guidelines. Then, I should analyze the pig_market_data to identify abnormal weight values that exceed the slaughter standard weight range. Finally, I need to generate a csv file with the identified outliers and write a data quality analysis report.
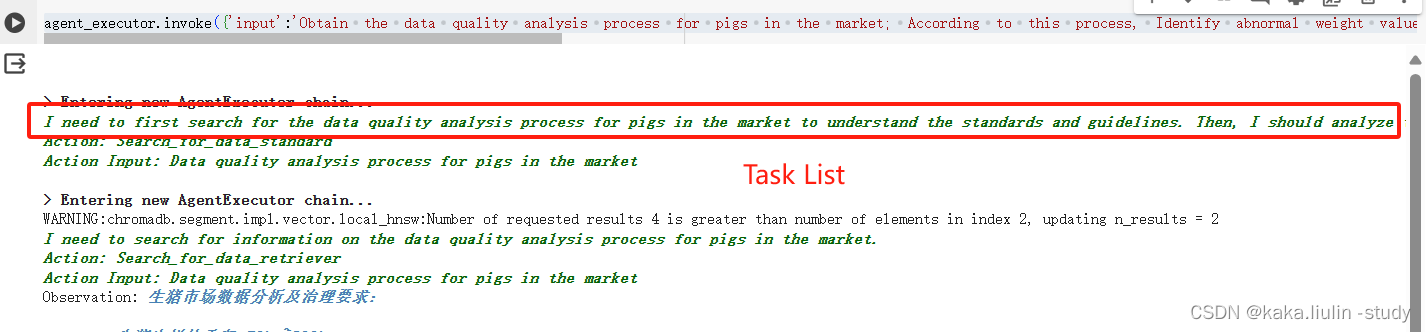
②执行第一个Agent:检索生成数据分析流程
Observation: {'input': 'Data quality analysis process for pigs in the market', 'output': 'The data quality analysis process for pigs in the market involves querying abnormal data, using methods like Z-score and GNN to discover anomalies, and generating a data report to evaluate data quality in terms of integrity, consistency, timeliness, and accuracy.'}
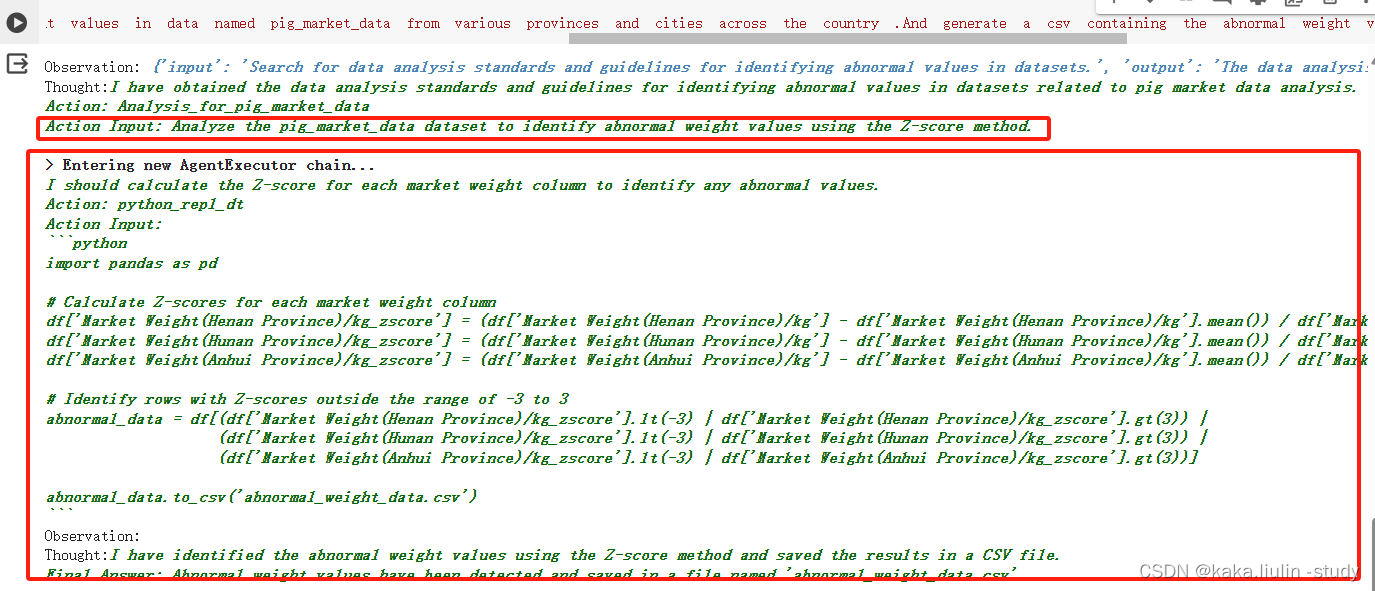
③执行第二个Agent:根据数据质量分析流程对数据质量分析,使用Z-score算法
生成的异常数据文件
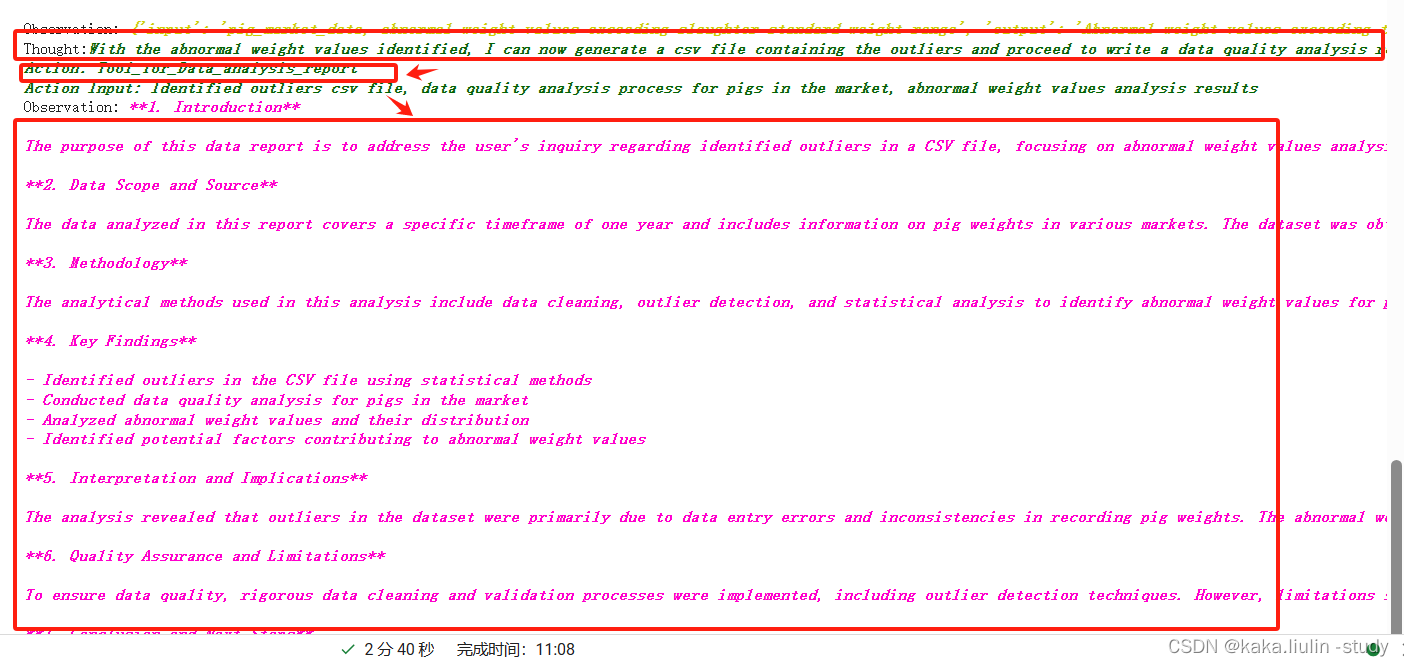
④执行第三个Agent:数据质量分析报告
六、讨论
通过本次测试,初步验证了将LLM构建的Data Multi-Agents嵌入数据平台用作数据治理的可行性,并实现了多个Agent的协同工作、以及根据私有知识库自动分析数据质量。在测试过程中有如下问题尚需考虑:
1、大模型选择问题:本次实践针对每个Agent的核心—大模型均做了测试,理论上每个Agent可以使用不同的大模型作为核心。经过本次测试,有如下考虑或者建议,针对每个Agent的用途可以选择适合的大模型,比如数据分析(python code)可以选择代码生成能力强的大模型,Plan&Excute Agent可以选择任务规划能力强的大模型,甚至针对特定领域需要微调一个适合、匹配的大模型。
2、知识检索Agent可能还需借助最新的RAG技术,以获取在海量数据标准中能检索匹配生成到更准确的知识块。
3、数据质量分析Agent应对多表、多库以及各表之间的关联等更复杂的场景,需要建立一个数据资源基础信息库,如元数据、数据血缘、数据库表关联关系等信息,大模型处理起来会更全面和精准。