首先是具体对于雷达图的要求
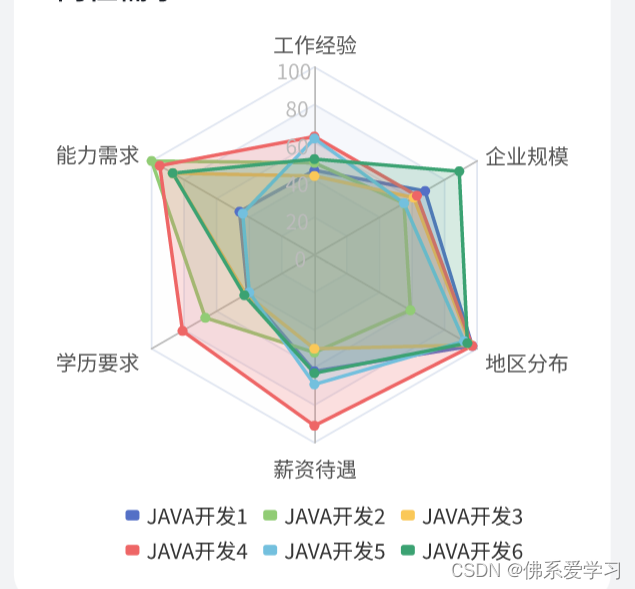
相应的要求难点主要集中于

一
这个  标签的大小的调整通常不进行调整他会按照自定义的格式进行调整,但按要求来说的话是不符合的这是需要注意到的一点
需要在legend中设置下面参数进行调整
itemWidth : 17,itemHeight: 15二

y轴上的刻度数标也是很容易遗忘的
在 radar中添加一下内容,按照自己的需求进行调整
indicator: [{ text: '工作经验', max: 100 ,axisLabel:{show : true}},{ text: '能力需求', max: 100 },{ text: '学历要求', max: 100 },{ text: '薪资待遇', max: 100 },{ text: '地区分布', max: 100 },{ text: '企业规模', max: 100 }]需要注意的是可以直接添加如下面的内容
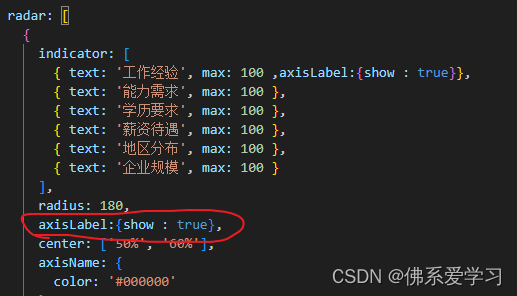
但得到的效果是全局的这个可以按照自己的需求进行适当调整
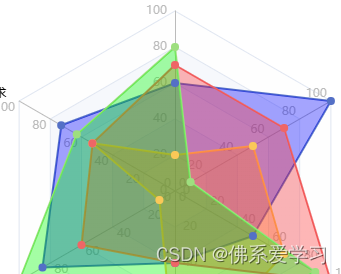
三
对于雷达图渐变色和透明度是一定要进行设置是否则出来的效果是非常不尽人意的

颜色的堆叠以及颜色的互冲会对效果图照成严重的影响严重影响美观
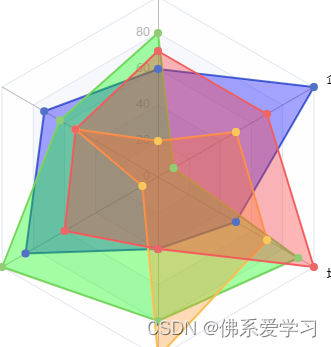
可以设置下面的参数调整透明度
areaStyle: {color: new echarts.graphic.RadialGradient(0.1, 0.6, 1, [{color: 'rgba(0,0, 255,0.5)',offset: 0},])}调整后在进行对比可以看出有很大的区别
最后所有代码马上呈上
代码可能会有很多拖拉,但我认为这可以很好展现代码的整体需求,方便阅读和修改
<template><div id="myBar" style="width: 500px; height: 800px;padding-left: 37%; padding-top: 50px;" ></div>
</template>
<script setup>
import { onMounted } from 'vue';
import * as echarts from "echarts";
onMounted(()=>{const myBarChart = echarts.init(document.getElementById("myBar"));
let option = {title: {text: 'JAVA开发工作的介绍',left:"center",top:100},tooltip: {trigger: 'axis'},legend: {data: ['JAVA开发1', 'JAVA开发2','JAVA开发3','JAVA开发4'],left:"center",top:750,itemWidth : 17,itemHeight: 15},radar: [{indicator: [{ text: '工作经验', max: 100 ,axisLabel:{show : true}},{ text: '能力需求', max: 100 },{ text: '学历要求', max: 100 },{ text: '薪资待遇', max: 100 },{ text: '地区分布', max: 100 },{ text: '企业规模', max: 100 }],radius: 180,center: ['50%', '60%'],axisName: {color: '#000000'},},],series: [{type: 'radar',tooltip: {trigger: 'item'},areaStyle: { },data: [{value: [60, 73, 85, 40,50,100],name: 'JAVA开发1',areaStyle: {color: new echarts.graphic.RadialGradient(0.1, 0.6, 1, [{color: 'rgba(0,0, 255,0.5)',offset: 0},])}},{value: [80, 63, 100, 80,90,10],name: 'JAVA开发2',color: 'rgba(1, 1, 1, 0.6)',areaStyle: {color: new echarts.graphic.RadialGradient(0.1, 0.6, 1, [{color: 'rgba(0,255, 0,0.5)',offset: 0},])}},{value: [20, 53, 10, 100,70,50],name: 'JAVA开发3',color: 'rgba(255, 228, 52, 0.6)',areaStyle: {color: new echarts.graphic.RadialGradient(0.1, 0.6, 1, [{color: 'rgba(255,153, 51,0.5)',offset: 0},])}},{value: [70, 53, 60, 40,100,70],name: 'JAVA开发4',color: 'rgba(255, 228, 52, 0.6)',areaStyle: {color: new echarts.graphic.RadialGradient(0.1, 0.6, 1, [{color: 'rgba(255,51, 51,0.5)',offset: 0},])}}]},]
};
myBarChart.setOption(option)
})
</script>
欢迎各位大佬批评指导
