本文根据某招聘网站抓取的岗位信息,来预测该岗位平均薪资。
数据预处理
数据示例如下:

因为本文重点介绍如何实现预测,因此对于数据的预处理部分讲解一下处理逻辑:
1、统一薪资的单位,要么统一为年薪(万/千),要么统一为月薪(万/千);
2、将薪资的上下限分割成两列数据,然后求得其平均值;
3、对其他文字性数据进行独热编码(one-hot),参考独热编码(One-Hot Encoding)-CSDN博客;
4、由于是预测每个岗位的平均薪资,因此针对采集下来的岗位需要分开处理一下,我这里以预测“前端开发”岗位为例。
预处理后数据示例如下:

可以看到,第一列为平均薪资(我这里是年薪-万为单位),然后有工作地点、公司规模、工作经验、学历四个特征的独热编码。独热编码的逻辑就是:假如公司规模的类型有三种,分别是50人以下,50-100人,100人以上,那么将这三种类型分为三列,然后1代表有,0代表无。其他特征的编码按照这个逻辑以此类推。
线性回归预测
使用sklearn导包,数据总共1W+,训练80%,测试20%,代码示例如下:
import pandas as pd
from sklearn.model_selection import train_test_split
from sklearn.linear_model import LinearRegression
from sklearn.metrics import mean_squared_error, r2_score, mean_absolute_error
from sklearn.model_selection import GridSearchCV
import numpy as npdata = pd.read_csv('../input_data/test.csv', encoding='latin1')
output_path = '../output_data/LinearRegression/test/'# 提取特征和标签
features = data.drop('avg_salary', axis=1)
labels = data['avg_salary']# 拆分训练集和测试集 -- 训练80%,测试20%
train_features, test_features, train_labels, test_labels = train_test_split(features, labels, test_size=0.2, random_state=42)# 创建线性回归模型
model = LinearRegression()# 定义超参数搜索空间
param_grid = {'fit_intercept': [True, False],'copy_X': [True, False],'n_jobs': [-1, 1, 2],'positive': [True, False]
}# 使用网格搜索进行超参数调优
grid_search = GridSearchCV(estimator=model, param_grid=param_grid, scoring='neg_mean_squared_error', cv=5)
grid_search.fit(train_features, train_labels)# 获取最佳模型和参数
best_model = grid_search.best_estimator_
best_params = grid_search.best_params_# 对测试集进行预测
predictions = best_model.predict(test_features)# 保存预测结果和标签
results = pd.DataFrame({'Label': test_labels, 'Pred': predictions})
results.to_csv(output_path + 'result.csv', index=False)# 评估模型性能
mse = mean_squared_error(test_labels, predictions)
mae = mean_absolute_error(test_labels, predictions)
r2 = r2_score(test_labels, predictions)
rmse = np.sqrt(mse)# 四舍五入保留4位小数
mse = round(mse, 4)
mae = round(mae, 4)
r2 = round(r2, 4)
rmse = round(rmse, 4)# 创建包含评估结果的数据帧
result_df = pd.DataFrame({'Metric': ['MSE', 'MAE', 'R2 Score','RMSE'],'Value': [mse, mae, r2, rmse]})
# 保存为CSV文件
result_df.to_csv(output_path + 'evaluate.csv', index=False)print("MSE: {:.4f}".format(mse))
print("MAE: {:.4f}".format(mae))
print("R2 Score: {:.4f}".format(r2))
print("RMSE: {:.4f}".format(rmse))
决策树预测
from sklearn.tree import DecisionTreeRegressor
from sklearn.metrics import mean_squared_error, r2_score, mean_absolute_error
from sklearn.model_selection import train_test_split
from sklearn.model_selection import GridSearchCV
import pandas as pd
import numpy as npdata = pd.read_csv('../input_data/test.csv', encoding='latin1')
output_path = '../output_data/DecisionTreeRegressor/test/'# 提取特征和标签
features = data.drop('avg_salary', axis=1)
labels = data['avg_salary']# 拆分训练集和测试集 -- 训练80%,测试20%
train_features, test_features, train_labels, test_labels = train_test_split(features, labels, test_size=0.2, random_state=42)# 创建决策树回归模型
model = DecisionTreeRegressor()# 定义超参数搜索空间
param_grid = {'criterion': ['mse', 'friedman_mse', 'mae'],  # 分割质量的评估准则'max_depth': [None, 5, 10],  # 决策树的最大深度'min_samples_split': [2, 5, 10],  # 内部节点再划分所需的最小样本数'min_samples_leaf': [1, 2, 4]  # 叶节点上所需的最小样本数
}# 使用网格搜索进行超参数调优
grid_search = GridSearchCV(estimator=model, param_grid=param_grid, scoring='neg_mean_squared_error', cv=5)
grid_search.fit(train_features, train_labels)# 获取最佳模型和参数
best_model = grid_search.best_estimator_
best_params = grid_search.best_params_# 对测试集进行预测
predictions = best_model.predict(test_features)# 保存预测结果和标签
results = pd.DataFrame({'Label': test_labels, 'Pred': predictions})
results.to_csv(output_path + 'result.csv', index=False)# 评估模型性能
mse = mean_squared_error(test_labels, predictions)
mae = mean_absolute_error(test_labels, predictions)
r2 = r2_score(test_labels, predictions)
rmse = np.sqrt(mse)# 四舍五入保留4位小数
mse = round(mse, 4)
mae = round(mae, 4)
r2 = round(r2, 4)
rmse = round(rmse, 4)# 创建包含评估结果的数据帧
result_df = pd.DataFrame({'Metric': ['MSE', 'MAE', 'R2 Score','RMSE'],'Value': [mse, mae, r2, rmse]})
# 保存为CSV文件
result_df.to_csv(output_path + 'evaluate.csv', index=False)print("MSE: {:.4f}".format(mse))
print("MAE: {:.4f}".format(mae))
print("R2 Score: {:.4f}".format(r2))
print("RMSE: {:.4f}".format(rmse))
随机森林预测
from sklearn.ensemble import RandomForestRegressor
from sklearn.metrics import mean_squared_error, r2_score, mean_absolute_error
from sklearn.model_selection import train_test_split
from sklearn.model_selection import GridSearchCV
import pandas as pd
import numpy as npdata = pd.read_csv('../input_data/test.csv', encoding='latin1')
output_path = '../output_data/RandomForestRegressor/test/'# 提取特征和标签
features = data.drop('avg_salary', axis=1)
labels = data['avg_salary']# 拆分训练集和测试集 -- 训练80%,测试20%
train_features, test_features, train_labels, test_labels = train_test_split(features, labels, test_size=0.2, random_state=42)# 创建随机森林回归模型
model = RandomForestRegressor()# 定义超参数搜索空间
param_grid = {'n_estimators': [100, 200, 300],  # 决策树的数量'max_depth': [None, 5, 10],  # 决策树的最大深度'min_samples_split': [2, 5, 10],  # 内部节点再划分所需的最小样本数'min_samples_leaf': [1, 2, 4],  # 叶节点上所需的最小样本数'max_features': ['auto', 'sqrt']  # 寻找最佳分割时要考虑的特征数量
}# 使用网格搜索进行超参数调优
grid_search = GridSearchCV(estimator=model, param_grid=param_grid, scoring='neg_mean_squared_error', cv=5)
grid_search.fit(train_features, train_labels)# 获取最佳模型和参数
best_model = grid_search.best_estimator_
best_params = grid_search.best_params_# 对测试集进行预测
predictions = best_model.predict(test_features)# 保存预测结果和标签
results = pd.DataFrame({'Label': test_labels, 'Pred': predictions})
results.to_csv(output_path + 'result.csv', index=False)# 评估模型性能
mse = mean_squared_error(test_labels, predictions)
mae = mean_absolute_error(test_labels, predictions)
r2 = r2_score(test_labels, predictions)
rmse = np.sqrt(mse)# 四舍五入保留4位小数
mse = round(mse, 4)
mae = round(mae, 4)
r2 = round(r2, 4)
rmse = round(rmse, 4)# 创建包含评估结果的数据帧
result_df = pd.DataFrame({'Metric': ['MSE', 'MAE', 'R2 Score','RMSE'],'Value': [mse, mae, r2, rmse]})
# 保存为CSV文件
result_df.to_csv(output_path + 'evaluate.csv', index=False)print("MSE: {:.4f}".format(mse))
print("MAE: {:.4f}".format(mae))
print("R2 Score: {:.4f}".format(r2))
print("RMSE: {:.4f}".format(rmse))
评估结果

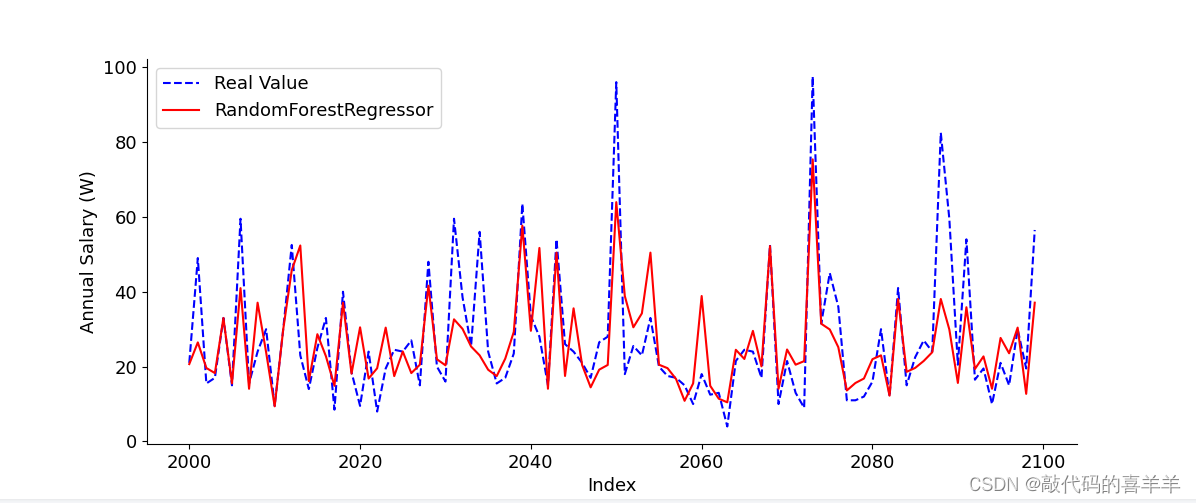
由于我使用的是基本模型,没有怎么去设置参数以及特征优化等操作,导致结果并没有那么理想,大家可以根据需要去完善模型。
数据拟合可视化
示例100条的数据拟合情况(从下标第2000行开始)


