1. springboot引入的依赖组件
项目中需要引入itextpdf和jfreechart两个组件,版本根据项目所需进行引入,maven组件版本查询可根据如下地址进行查询:maven组件查询
<dependency><groupId>com.itextpdf</groupId><artifactId>itextpdf</artifactId><version>5.5.13</version></dependency><dependency><groupId>com.itextpdf</groupId><artifactId>itext-asian</artifactId><version>5.2.0</version></dependency><dependency><groupId>org.jfree</groupId><artifactId>jfreechart</artifactId><version>1.5.4</version></dependency>
2. PDF中的图表制作
项目中根据接口进行导出PDF,示例如下:
点击查看代码
@GetMapping("/export/pdf")public void exportPDFReport(HttpServletResponse response)throws Exception {Document document = new Document(PageSize.A4, 36, 36, 36, 36);try {response.setContentType("application/pdf");response.addHeader("Content-Disposition", "attachment;filename=" + URLEncoder.encode("测试报告", "UTF-8") + ".pdf");OutputStream os = new BufferedOutputStream(response.getOutputStream());PdfWriter writer = PdfWriter.getInstance(document, os);// pdf报告标题addTitlePage(document);// 饼图addPieChart(document, writer);// 条形图addBarChart(document, writer);// 折线图addLineChart(document, writer);// 数据表格addDataTable(document,"任务标题","张三");document.open();document.close();os.close();} catch (Exception e) {document.close();throw new RuntimeException("导出报告异常,错误信息:" + e.getMessage());}finally {document.close();}}
private static void addTitlePage(Document document) throws DocumentException, IOException {// 创建一个BaseFont对象,指定字体路径和编码以支持中文BaseFont bfChinese = BaseFont.createFont("STSong-Light", "UniGB-UCS2-H", BaseFont.NOT_EMBEDDED);// 使用上面的字体创建一个Font对象Font chineseFont = new Font(bfChinese, 18, Font.BOLD, BaseColor.BLACK);// 使用支持中文的字体创建段落Paragraph title = new Paragraph("测试计划", chineseFont);title.setAlignment(Element.ALIGN_CENTER);Chapter chapter = new Chapter(title, 1);chapter.setNumberDepth(0);document.add(chapter);
}
注意:如果需要上下层级保持一定的间隔,需要加入如下代码,主要作用是为上下内容保持一定的间隙,示例如下:
document.add(new Paragraph(" ", new Font(Font.FontFamily.HELVETICA, 12))); // 增加间距
- 报告插入饼图图表,示例如下:
private static void addPieChart(Document document, PdfWriter writer) throws DocumentException {DefaultPieDataset dataset = new DefaultPieDataset();dataset.setValue("Category 1", 30);dataset.setValue("Category 2", 20);dataset.setValue("Category 3", 50);JFreeChart pieChart = ChartFactory.createPieChart("Sample Pie Chart",dataset,true,true,false);Image chartImage = getImageFromChart(pieChart, writer);placeImageInDocument(document, chartImage);}
- 报告插入条形图,示例如下:
private static void addBarChart(Document document, PdfWriter writer) throws DocumentException {DefaultCategoryDataset dataset = new DefaultCategoryDataset();dataset.addValue(400, "Series 1", "Category 1");dataset.addValue(150, "Series 1", "Category 2");dataset.addValue(120, "Series 1", "Category 3");JFreeChart barChart = ChartFactory.createBarChart("Sample Bar Chart","Category","Value",dataset,PlotOrientation.VERTICAL,true,true,false);CategoryPlot plot = barChart.getCategoryPlot();BarRenderer renderer = (BarRenderer) plot.getRenderer();renderer.setDefaultItemLabelGenerator(new StandardCategoryItemLabelGenerator());renderer.setDefaultItemLabelsVisible(true); // 数值标签可见// 动态设置y轴范围// 计算最大值double maxValue = 0;for (int i = 0; i < dataset.getRowCount(); i++) {for (int j = 0; j < dataset.getColumnCount(); j++) {Number value = dataset.getValue(i, j);if (value != null && value.doubleValue() > maxValue) {maxValue = value.doubleValue();}}}// 动态设置y轴范围NumberAxis rangeAxis = (NumberAxis) plot.getRangeAxis();rangeAxis.setAutoRangeIncludesZero(false); // 不包括0rangeAxis.setAutoRange(true); // 自适应范围rangeAxis.setUpperBound(maxValue * 1.1); // 设置上限为最大值的1.1倍或其他适当值Image chartImage = getImageFromChart(barChart, writer);placeImageInDocument(document, chartImage);}
- 报告插入折线图,示例如下:
public void addLineChart(Document document, PdfWriter writer) throws DocumentException {DefaultCategoryDataset dataset = new DefaultCategoryDataset();dataset.addValue(400, "Series 1", "Category 1");dataset.addValue(150, "Series 1", "Category 2");dataset.addValue(120, "Series 1", "Category 3");JFreeChart lineChart = ChartFactory.createLineChart("","","",dataset,PlotOrientation.VERTICAL,true,true,false);CategoryPlot plot = lineChart.getCategoryPlot();plot.setOutlineVisible(false); // 关闭绘图区域的边框线// 启用Y轴网格线的显示plot.setRangeGridlinesVisible(true);// 设置Y轴网格线颜色和样式plot.setRangeGridlinePaint(Color.GRAY); // 设置网格线颜色为灰色// 创建虚线效果float[] dashPattern = {5f, 5f}; // 定义虚线的模式BasicStroke dashed = new BasicStroke(0.1f, // 线宽BasicStroke.CAP_BUTT,BasicStroke.JOIN_MITER,10.0f, // 斜接长度dashPattern, // 虚线模式0.0f); // 虚线相位// 应用虚线设置到Y轴网格线plot.setRangeGridlineStroke(dashed);// 如果需要,也可以启用并设置X轴网格线的颜色和样式plot.setDomainGridlinesVisible(false);// 自定义X轴标签,只显示原始name,去除索引部分CategoryAxis domainAxis = new CategoryAxis() {@Overrideprotected TextBlock createLabel(Comparable category, float width, RectangleEdge edge, Graphics2D g2) {String label = category.toString();// 假设唯一标识符是原始name后跟一个空格和序号,这里我们只提取原始nameString originalName = label.substring(0, label.lastIndexOf('_')); // 假设'_'之前的是原始namereturn super.createLabel(originalName, width, edge, g2);}};// 创建一个新的字体,并设置字体大小为12java.awt.Font labelFont = new java.awt.Font("宋体", java.awt.Font.PLAIN, 8);// 将新的字体应用到X轴标签上domainAxis.setTickLabelFont(labelFont);domainAxis.setLabelFont(labelFont);// 设置自定义的标签生成器到图表的X轴plot.setDomainAxis(domainAxis);// 动态设置y轴范围// 计算最大值double maxValue = 0;for (int i = 0; i < dataset.getRowCount(); i++) {for (int j = 0; j < dataset.getColumnCount(); j++) {Number value = dataset.getValue(i, j);if (value != null && value.doubleValue() > maxValue) {maxValue = value.doubleValue();}}}// 动态设置y轴范围NumberAxis rangeAxis = (NumberAxis) plot.getRangeAxis();rangeAxis.setAutoRangeIncludesZero(false); // 不包括0rangeAxis.setAutoRange(true); // 自适应范围// 设置Y轴的刻度单位// 检查是否所有数据都是0if (maxValue == 0.0) {rangeAxis.setUpperBound(1); // 如果是,则手动设置一个上限,例如1} else {rangeAxis.setUpperBound(maxValue * 1.5); // 否则,设置上限为最大值的1.5倍}Image chartImage = getImageFromChart(lineChart, writer);placeImageInDocument(document, chartImage);}
- 报告插入数据表格,示例如下:
   private static void addDataTable(Document document, String taskTitle,String nickName) throws Exception {Font font = new Font(BaseFont.createFont("STSong-Light", "UniGB-UCS2-H", BaseFont.NOT_EMBEDDED));Font fontHeader = new Font(BaseFont.createFont("STSong-Light", "UniGB-UCS2-H", BaseFont.NOT_EMBEDDED), 12, Font.BOLD);PdfPTable table = new PdfPTable(6);// 设置每列的宽度float[] columnWidths = {2, 8, 3, 2, 4, 2}; // 定义每列的相对宽度比例table.setWidths(columnWidths);// 设置表格行高
//        table.getDefaultCell().setFixedHeight(80);table.setTotalWidth(600);PdfPCell cell1 = new PdfPCell(new Phrase("ID",fontHeader));cell1.setHorizontalAlignment(Element.ALIGN_CENTER);table.addCell(cell1);PdfPCell cell2 = new PdfPCell(new Phrase("任务预览",fontHeader));cell2.setHorizontalAlignment(Element.ALIGN_CENTER);table.addCell(cell2);PdfPCell cell3 = new PdfPCell(new Phrase("任务状态",fontHeader));cell3.setHorizontalAlignment(Element.ALIGN_CENTER);table.addCell(cell3);PdfPCell cell4 = new PdfPCell(new Phrase("缺陷数",fontHeader));cell4.setHorizontalAlignment(Element.ALIGN_CENTER);table.addCell(cell4);PdfPCell cell5 = new PdfPCell(new Phrase("关联产品与版本",fontHeader));cell5.setHorizontalAlignment(Element.ALIGN_CENTER);table.addCell(cell5);PdfPCell cell6 = new PdfPCell(new Phrase("需求数",fontHeader));cell6.setHorizontalAlignment(Element.ALIGN_CENTER);table.addCell(cell6);// 添加其它字段的值// IDPdfPCell cell1Value = new PdfPCell(new Phrase("1", font));cell1Value.setHorizontalAlignment(Element.ALIGN_CENTER);// 垂直居中cell1Value.setVerticalAlignment(Element.ALIGN_MIDDLE);table.addCell(cell1Value);// 任务预览PdfPCell progressBarCell = createProgressBarCellWithDetails(10,2, 2, 1,1,3, taskTitle,nickName); // 假设Pass:2个, Fail:1个// 垂直居中progressBarCell.setVerticalAlignment(Element.ALIGN_MIDDLE);table.addCell(progressBarCell);// 任务状态PdfPCell cell3Value = new PdfPCell(new Phrase("进行中", font));cell3Value.setHorizontalAlignment(Element.ALIGN_CENTER);// 垂直居中cell3Value.setVerticalAlignment(Element.ALIGN_MIDDLE);table.addCell(cell3Value);// 缺陷数// 任务状态PdfPCell cell4Value = new PdfPCell(new Phrase("10", font));cell4Value.setHorizontalAlignment(Element.ALIGN_CENTER);// 垂直居中cell4Value.setVerticalAlignment(Element.ALIGN_MIDDLE);table.addCell(cell4Value);// 关联产品与版本PdfPCell cel54Value = new PdfPCell(new Phrase("产品A(v1.0.0)", font));cel54Value.setHorizontalAlignment(Element.ALIGN_CENTER);// 垂直居中cel54Value.setVerticalAlignment(Element.ALIGN_MIDDLE);table.addCell(cel54Value);// 需求数PdfPCell cell6Value = new PdfPCell(new Phrase("10", font));cell6Value.setHorizontalAlignment(Element.ALIGN_CENTER);// 垂直居中cell6Value.setVerticalAlignment(Element.ALIGN_MIDDLE);table.addCell(cell6Value);document.add(table);}
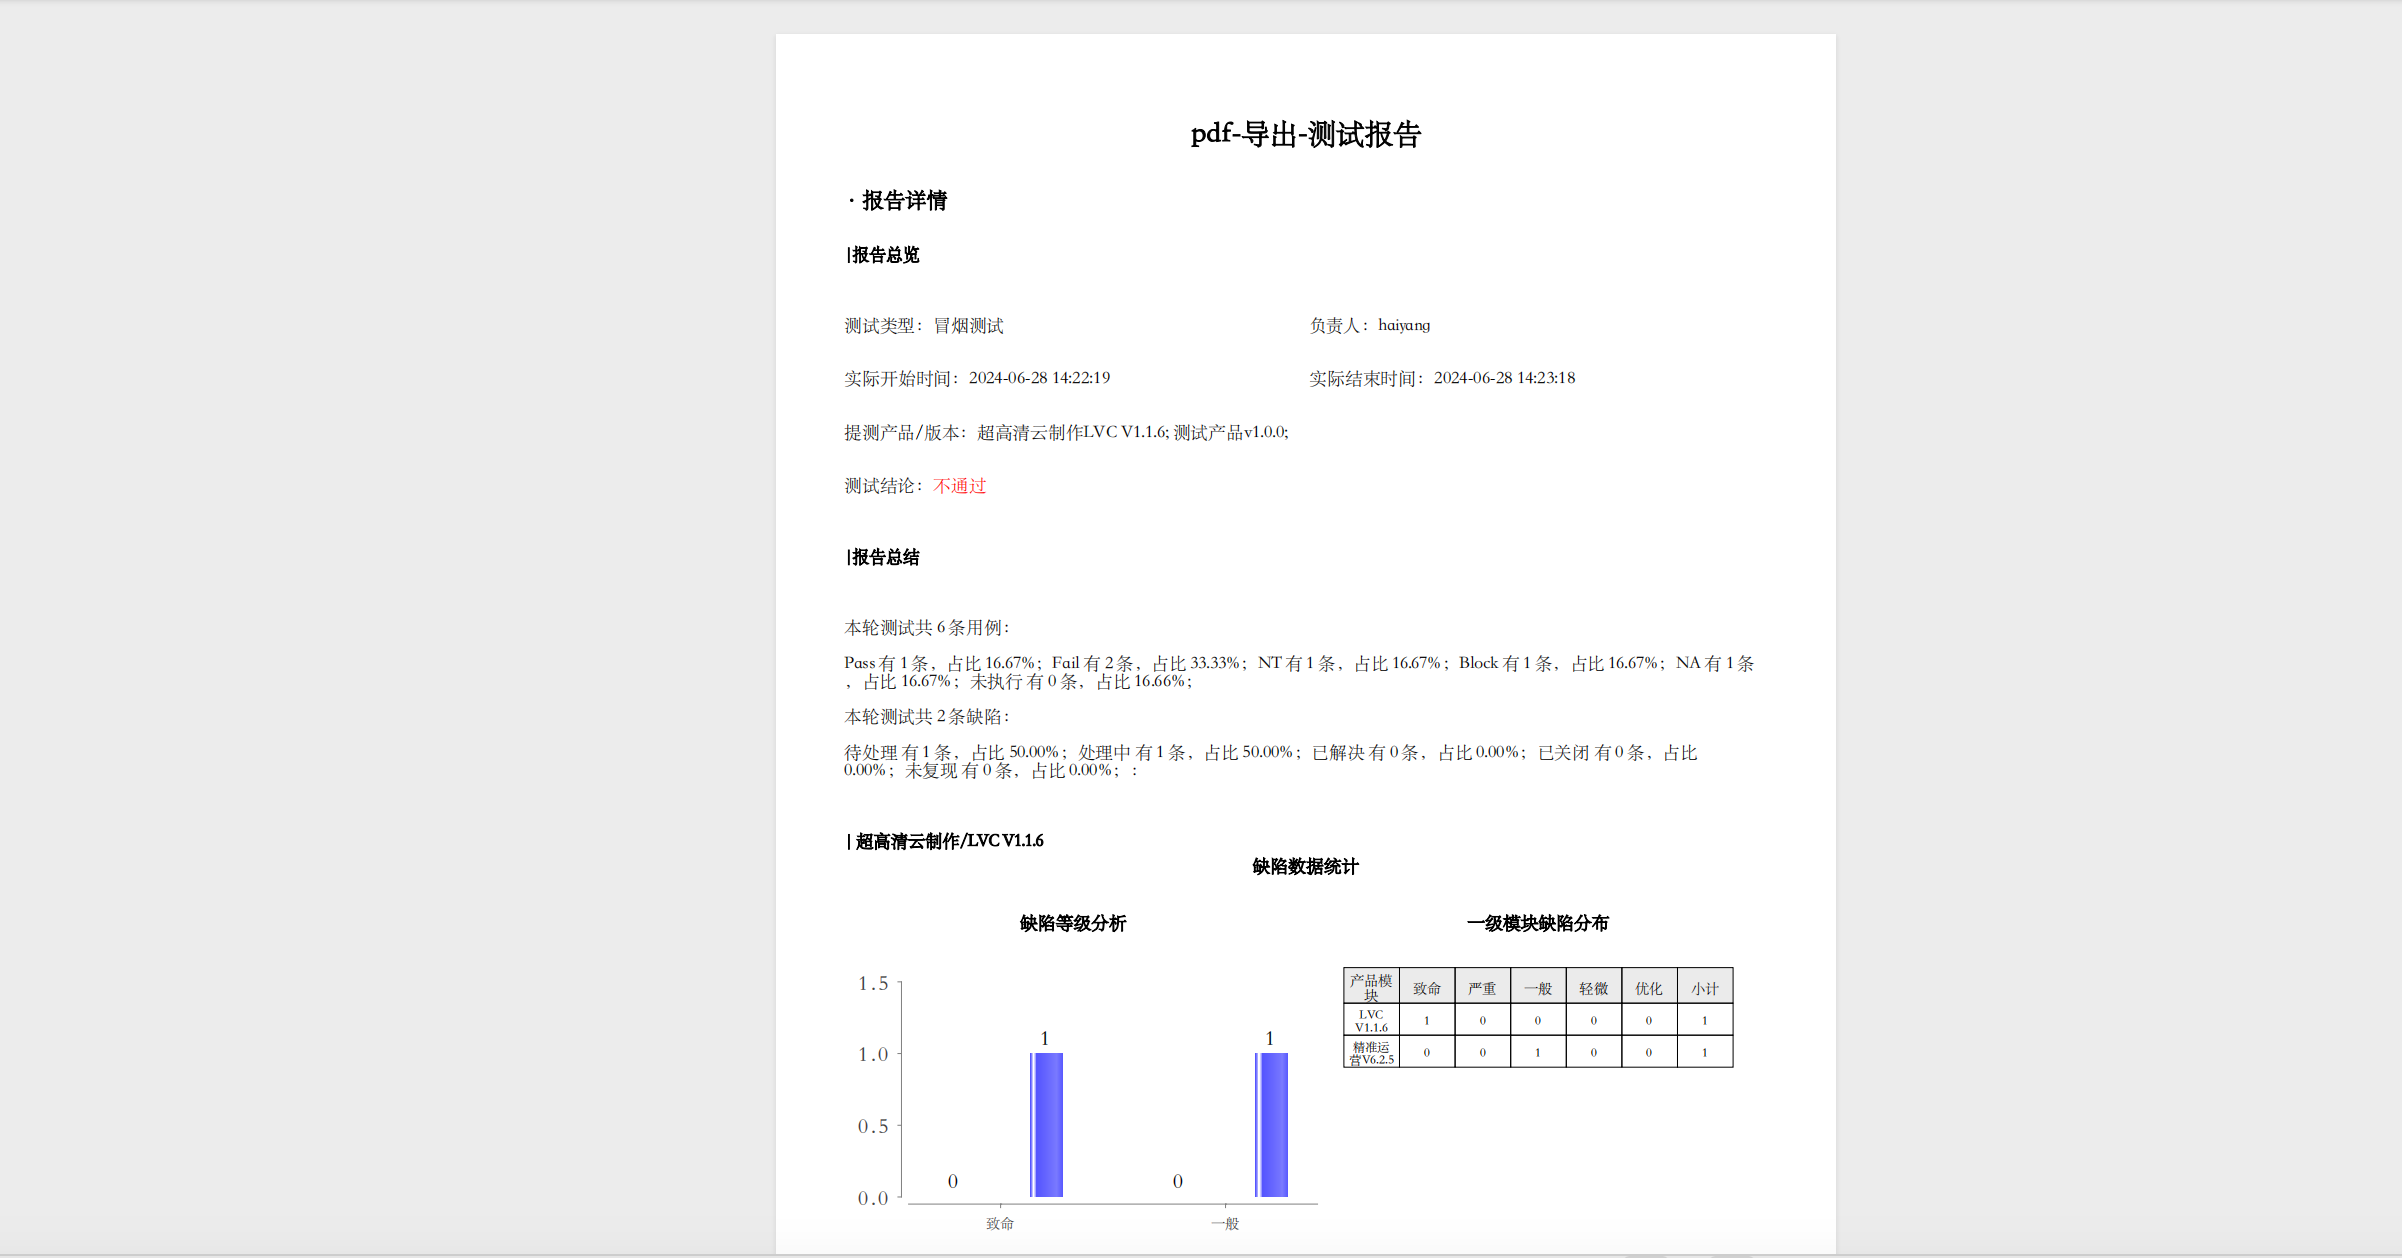
3. 导出PDF制作完成后结果
- 结果呈现示例图片如下:
4.总结分析
本次分享主要作为一个经验分享,该内容完全由本人真实项目中所使用及遇到的问题所描述,如有不了解或者想要深入研究分析的可以评论及联系,下面我结合本次实现该功能所遇到的问题总结如下几点进行避免踩坑:
- 图表中的中文显示问题
如上诉的图表中涉及到的中文,有可能在开发中无法显示,这里面主要是因为使用到的Font类需要自定义中文显示类型,如:
// 创建一个BaseFont对象,指定字体路径和编码以支持中文BaseFont bfChinese = BaseFont.createFont("STSong-Light", "UniGB-UCS2-H", BaseFont.NOT_EMBEDDED);
如果你遇到了Series或者toolti中文显示不出来,则需要使用JFreeChart进行一个自定义的字体显示,如下:
默认的是Graphics2D graphics2d = new PdfGraphics2D(template, width, height, new DefaultFontMapper());改写如下:
需要自定义FontMapper
// 创建一个自定义的字体映射DefaultFontMapper mapper = new DefaultFontMapper() {@Overridepublic BaseFont awtToPdf(java.awt.Font font) {try {// 指定一个支持中文的PDF字体,例如使用iText内置的STSong-Light字体// 并设置编码以支持中文return BaseFont.createFont("STSong-Light", "UniGB-UCS2-H", BaseFont.NOT_EMBEDDED);} catch (Exception e) {e.printStackTrace();return super.awtToPdf(font);}}};Graphics2D graphics2d = new PdfGraphics2D(template, width, height, mapper);
- PDF本身受到宽距和高距限制,导致字符长无法显示完整问题
问题:
在比较拥挤的页面时,发现图标的X轴标签显示不完整,或者呈现...字样
解决方式:
CategoryPlot plot = barChart.getCategoryPlot();plot.setOutlineVisible(false); // 关闭绘图区域的边框线CategoryAxis domainAxis = plot.getDomainAxis();// 创建一个新的字体,并设置字体大小为12java.awt.Font labelFont = new java.awt.Font("宋体", java.awt.Font.PLAIN, 8);// 将新的字体应用到X轴标签上domainAxis.setTickLabelFont(labelFont);domainAxis.setLabelFont(labelFont);
//        domainAxis.setCategoryLabelPositions(CategoryLabelPositions.UP_45);  // 设置标签角度为45度,以便显示较长的标签BarRenderer renderer = (BarRenderer) plot.getRenderer();renderer.setDefaultItemLabelGenerator(new StandardCategoryItemLabelGenerator());renderer.setDefaultItemLabelsVisible(true); // 数值标签可见
- 内容宽距和高距设置不合理导致无法显示问题
问题:我们在制作各种数据内容的时候,例如想在一行既显示图表,有显示表格,这样的话就会涉及到两个表所需要的实际宽距,如果不合理就会导致超出后无法显示内容
解决方式:
根据不同表所需要的宽距和高距设置进行合理调整,并留出一定的空间public Image getImageFromChart(JFreeChart chart, PdfWriter writer,int cellWidth, int cellHeight) throws DocumentException {int width = cellWidth - 20; // 减去一些边距int height = cellHeight - 20; // 减去一些边距chart.setBackgroundPaint(Color.white); // 设置绘图区域的背景色为白色chart.getPlot().setBackgroundPaint(Color.white); // 设置图表区域的背景色为白色
//        if (chart.getLegend() != null) {
//            chart.getLegend().setItemFont(new java.awt.Font("宋体", java.awt.Font.PLAIN, 10)); // 设置图例的字体
//        }PdfContentByte contentByte = writer.getDirectContent();PdfTemplate template = contentByte.createTemplate(width, height);// 创建一个自定义的字体映射DefaultFontMapper mapper = new DefaultFontMapper() {@Overridepublic BaseFont awtToPdf(java.awt.Font font) {try {// 指定一个支持中文的PDF字体,例如使用iText内置的STSong-Light字体// 并设置编码以支持中文return BaseFont.createFont("STSong-Light", "UniGB-UCS2-H", BaseFont.NOT_EMBEDDED);} catch (Exception e) {e.printStackTrace();return super.awtToPdf(font);}}};Graphics2D graphics2d = new PdfGraphics2D(template, width, height, mapper);Rectangle2D rectangle2d = new Rectangle2D.Double(0, 0, width, height);chart.draw(graphics2d, rectangle2d);graphics2d.dispose();return Image.getInstance(template);}
结论:希望本博客能够为你开发此功能提供有需要的帮助,如果遇到问题,也可联系,看到的话会提供相应的帮助,长路漫漫,程序不断,携手共进,创造辉煌,😄

![[LeetCode] 189. Rotate Array](https://img2024.cnblogs.com/blog/747577/202407/747577-20240701162225843-1895343239.png)