# pyplot
import matplotlib.pyplot as plt
import numpy as np
import seaborn as sns
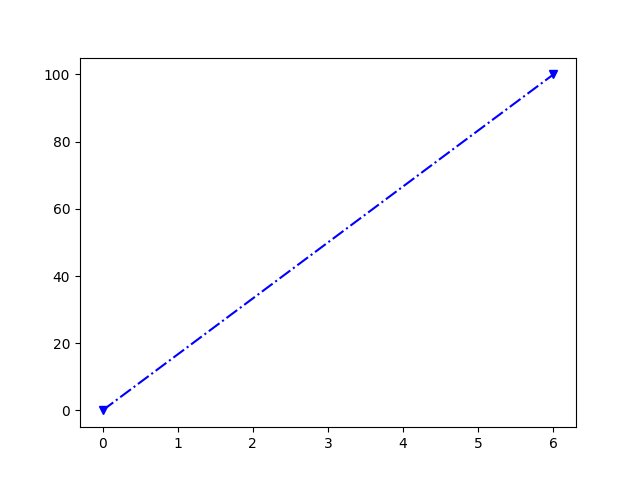
import pandas as pdx_point = np.array([0,6])
y_point = np.array([0,100])
plt.plot(x_point,y_point,'b-.v')   # 格式处理
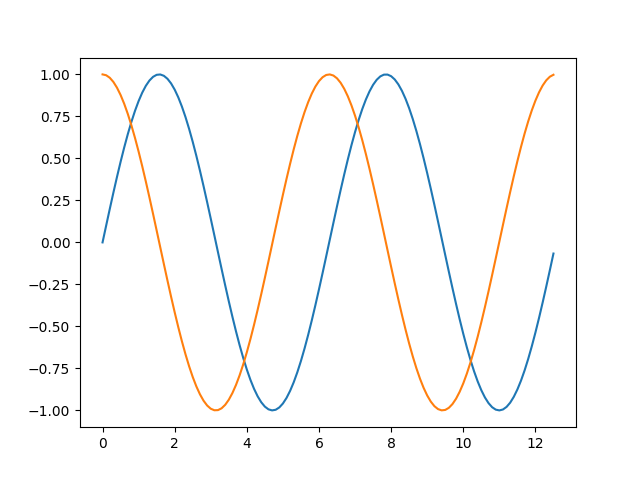
plt.show()x = np.arange(0,4*np.pi, 0.1)
y = np.sin(x)
z = np.cos(x)
plt.plot (x,y,x,z)  # 函数绘图, 绘制多条线
plt.show()# 坐标点的格式设定,“标记”  maker参数: 标记形状,
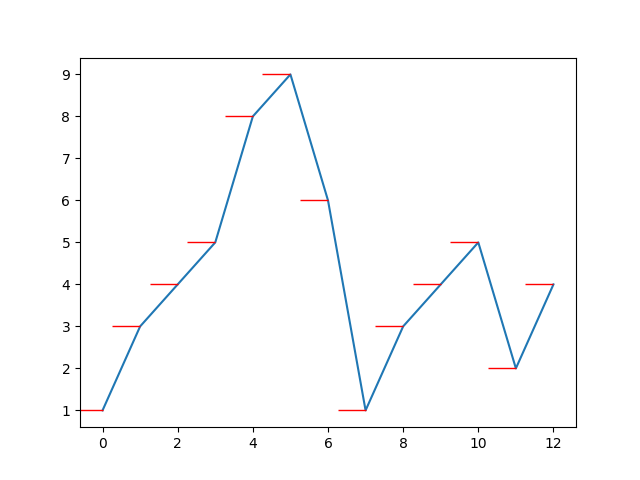
ypoints = np.array([1,3,4,5,8,9,6,1,3,4,5,2,4])plt.plot(ypoints, marker = 0, ms = 20, mec = 'r')  # 还有fmt参数:端点形状,线形,颜色
plt.show()#  标记:端点格式, 还可以 定义大小ms,内部颜色mfc,边框颜色 mec , 颜色取值:r  或者#4CAF50# 绘图线格式:类型,颜色  ,大小
#    plot参数:linestyle ls color  线形值:‘-.’ dotted   color  c  值:r  HTML颜色值
#      宽度: linewidth  lw  值:# 多条线
x1 = np.array([0, 1, 2, 3])
y1 = np.array([3, 7, 5, 9])
x2 = np.array([0, 1, 2, 3])
y2 = np.array([6, 2, 13, 10])plt.subplot(1, 2, 1)   # 切分画布为2个图表
plt.plot(x1, y1, x2, y2)
plt.xlabel("X axis",loc = "left")
plt.ylabel("Y axis")
plt.title("title for sample")
plt.grid(axis= 'x', ls = '-.')
plt.show()
#  轴标签内容,格式  和标题  xlable方法
''' 字体大小:fontproperties自定义样式:fortdict定位:loc  值:left right center
''''''
网格线:plt.grid()网格线方向:axis1
color , ls  lw
b = ture 开关
''''''
绘制多个子图:
subplot方法切分画布
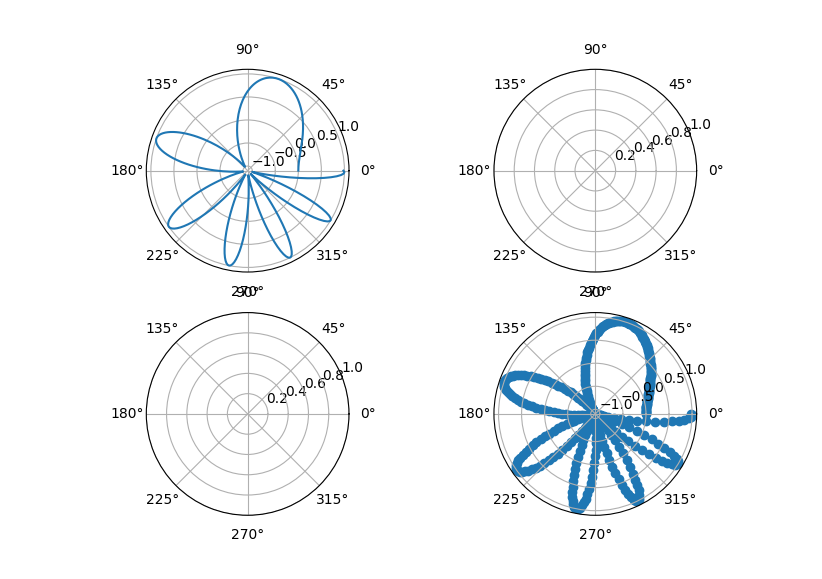
subplots; 参数:sharex   subplot_kw:传入格式参数'''x = np.linspace(0, 2*np.pi, 400)
y = np.sin(x**2)
fig, axs = plt.subplots(2, 2, subplot_kw=dict(projection="polar"))
axs[0, 0].plot(x, y)
axs[1, 1].scatter(x, y)
plt.show()# 散点图
'''
数据:x y  一维序列,数组
格式:s  c  ,   marker  norm/alpha  lw    2个散点图叠加显示,不同的颜色点。
颜色条功能:cmap 值0-100 多种可选'''
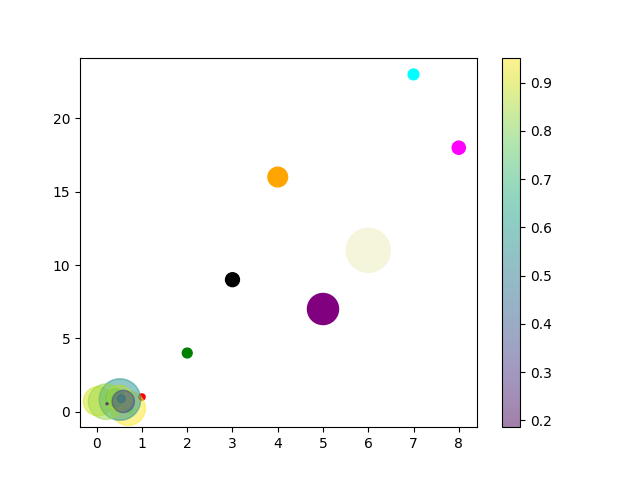
x = np.array([1, 2, 3, 4, 5, 6, 7, 8])
y = np.array([1, 4, 9, 16, 7, 11, 23, 18])
colors = np.array(["red","green","black","orange","purple","beige","cyan","magenta"])
sizes = np.array([20,50,100,200,500,1000,60,90])
plt.scatter(x, y, c=colors, s= sizes)N = 10
x = np.random.rand(N)
y = np.random.rand(N)
colors = np.random.rand(N)area = (30 * np.random.rand(N))**2  # 0 to 15 point radii
# plt.scatter(x, y, s=area, c=colors, alpha=0.5)  # 第2个图

plt.scatter(x, y, s=area, c=colors, alpha=0.5 , cmap='viridis')  # 第2个图
plt.colorbar()  # 显示颜色条

plt.show()'''
bar  pie hist
imshow: 热力图,矩阵,地图
imsave 保存图像
imread 读取图像''''''
seanborn:
主题: 深色网格  set_theme(style , context)
模板:标签 线条格式
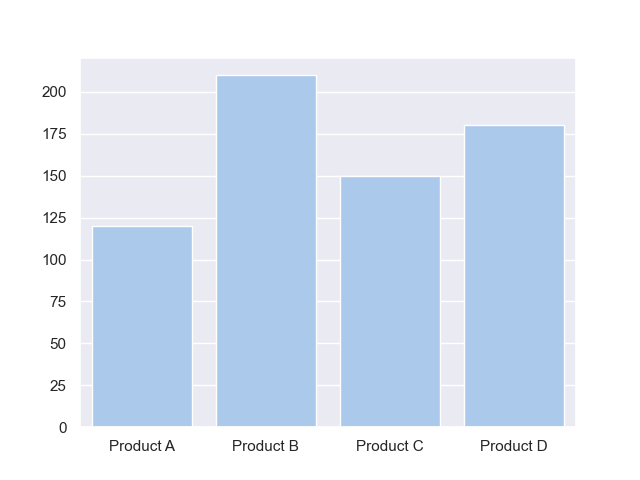
绘图函数:scatterplot()lineplotbarplotheatmap '''sns.set_theme(style="darkgrid", palette="pastel")
products = ["Product A", "Product B", "Product C", "Product D"]
sales = [120, 210, 150, 180]
sns.barplot(x=products, y=sales)
plt.show()data = {'Category': ['A', 'B', 'C'], 'Value': [3, 7, 5]}
df = pd.DataFrame(data)  # dataframe
sns.barplot(x='Category', y='Value', data=df)
plt.show()
图例
