第一种方式:使用 bar 实现
想要的效果:

代码实现:
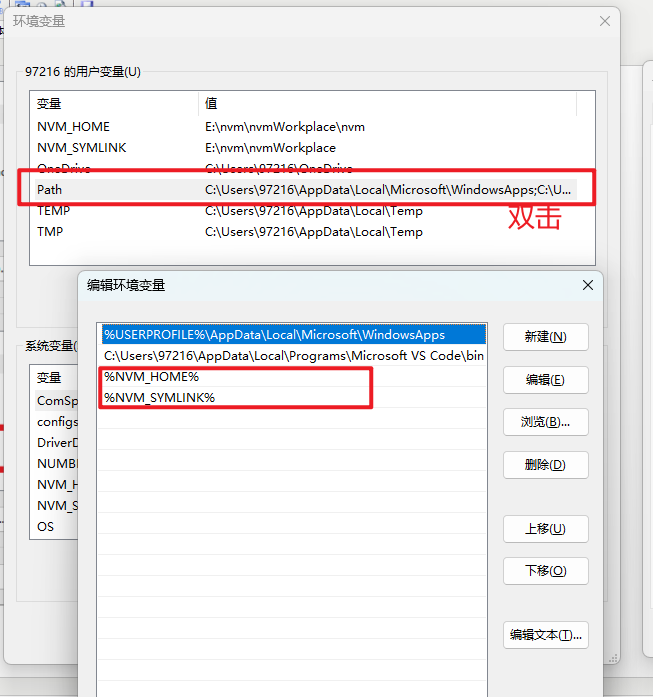
    const chartData = {title: {text: '97', // 圆环中间数字textStyle: {color: '#222222',fontSize: 20,},subtext: '成功数',subtextStyle: {color: '#222222',},itemGap: 10, // 主副标题距离left: 'center',top: 'center',},angleAxis: {max: 100, // 总数clockwise: false, // 逆时针// 隐藏刻度线
        axisLine: {show: false,},axisTick: {show: false,},axisLabel: {show: false,},splitLine: {show: false,},},radiusAxis: {type: 'category',// 隐藏刻度线
        axisLine: {show: false,},axisTick: {show: false,},axisLabel: {show: false,},splitLine: {show: false,},},polar: {center: ['50%', '50%'],radius: '100%', // 图形大小
      },series: [{type: 'bar',data: [{name: '交易结果成功数',value: 97,itemStyle: {normal: {color: new echarts.graphic.LinearGradient(1, 0, 0, 0, [ // 渐变色,如果正常一个颜色的话,直接写 color:色值;{offset: 0,color: '#0091ff',},{offset: 1,color: '#cfe8fc',},]),},},},],coordinateSystem: 'polar',roundCap: true,barWidth: 10,barGap: '-100%',z: 2,},{// 灰色环type: 'bar',data: [{value: 100,itemStyle: {color: '#cfe8fc',shadowColor: 'rgba(0, 0, 0, 0.2)',shadowBlur: 5,shadowOffsetY: 2,},},],coordinateSystem: 'polar',roundCap: true,barWidth: 10,barGap: '-100%', // 两环重叠z: 1,},],};


![[学习笔记]后缀数组(Suffix Array)](https://raw.githubusercontent.com/xMinh/xMinh.github.io/master/pic/havana3.png)