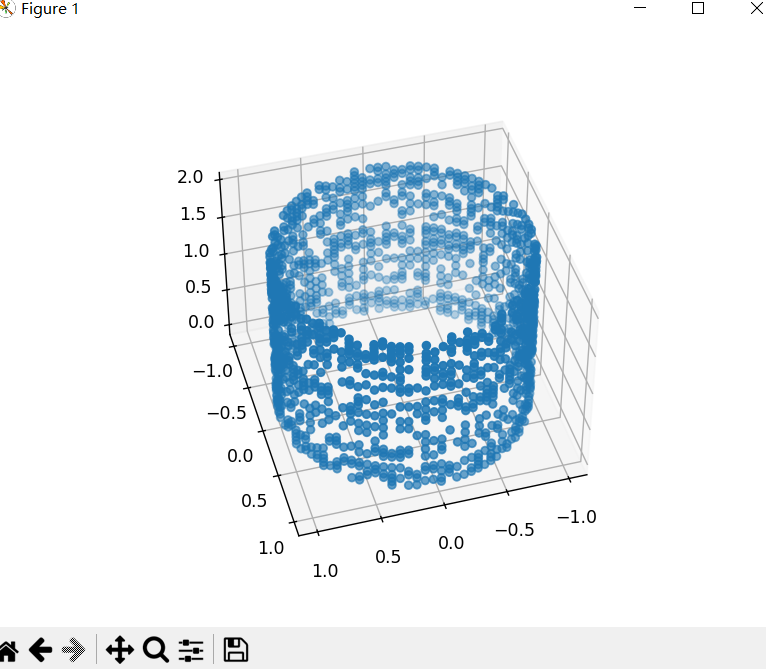
import os
import randomimport numpy as np
import matplotlib.pyplot as plt
#合成管道数据集def plot_cylinder(center, radius, height, num_points=100):# 生成圆柱体的侧面点坐标theta = np.linspace(0, 2*np.pi, num_points)intervalZ = np.floor(height/0.05)indx2 = [ix for ix in range(int(intervalZ))]random_int2 = random.sample(indx2, int(intervalZ - 10))xx = []yy = []zz = []print(random_int2)for j in random_int2:indx = [i for i in range(num_points)]random_int = random.sample(indx, 50)theta2 = theta[random_int]print(random_int)x = center[0] + radius * np.cos(theta2)y = center[1] + radius * np.sin(theta2)z = (center[2]+0.05*j)*np.ones_like(x)xx = np.hstack((xx, x))yy = np.hstack((yy, y))zz = np.hstack((zz, z))print(j)#np.linspace(center[2], center[2]+height, num_points)return xx,yy,zzx,y,z=plot_cylinder((0, 0, 0), 1, 2)
print(x.shape,y.shape,z.shape)
fig = plt.figure()
ax = fig.add_subplot(111, projection='3d')
ax.scatter(x, y, z)
plt.show()