习题6.1
a图
点击查看代码
import networkx as nx
import matplotlib.pyplot as plt  G = nx.Graph()  nodes = ['v1', 'v2', 'v3', 'v4', 'v5', 'v6']
G.add_nodes_from(nodes)  edges = [  ('v1', 'v2'), ('v1', 'v3'), ('v1', 'v4'),  ('v2', 'v3'), ('v2', 'v6'),  ('v3', 'v4'),  ('v4', 'v5'),  ('v5', 'v6')
]
G.add_edges_from(edges)  pos = nx.circular_layout(G)  center = (0, 0)
pos['v1'] = center  plt.figure(figsize=(8, 8))
nx.draw(G, pos, with_labels=True, node_color='skyblue', node_size=700, font_size=15, font_weight='bold')
plt.title("Undirected Graph as Described")
plt.axis('equal')
plt.show()print("学号:3001")
plt. show( )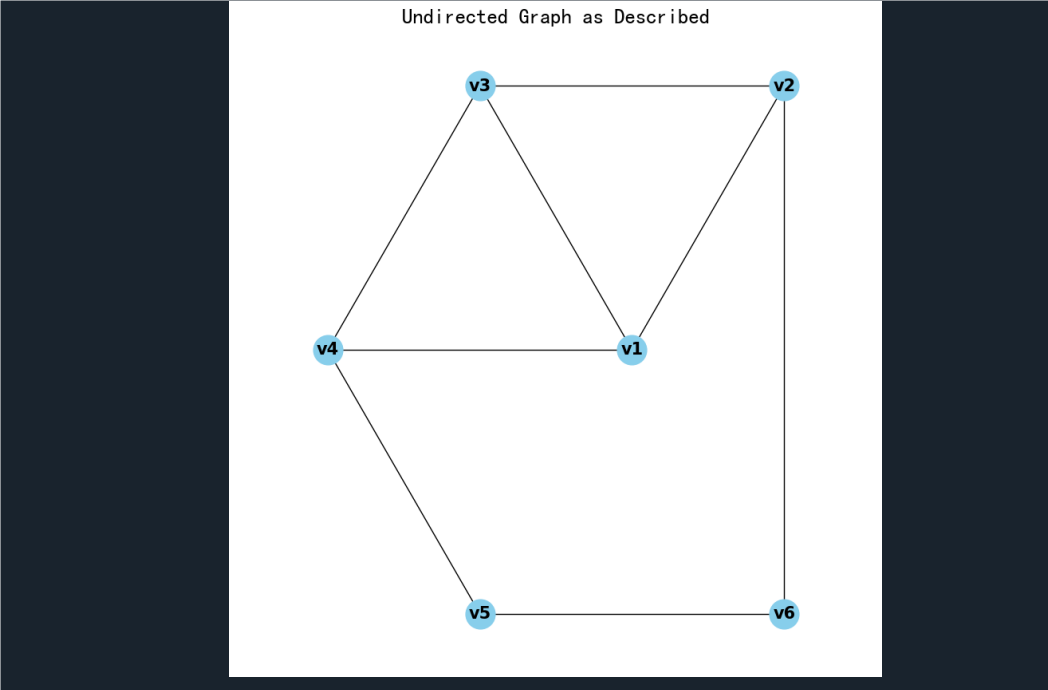
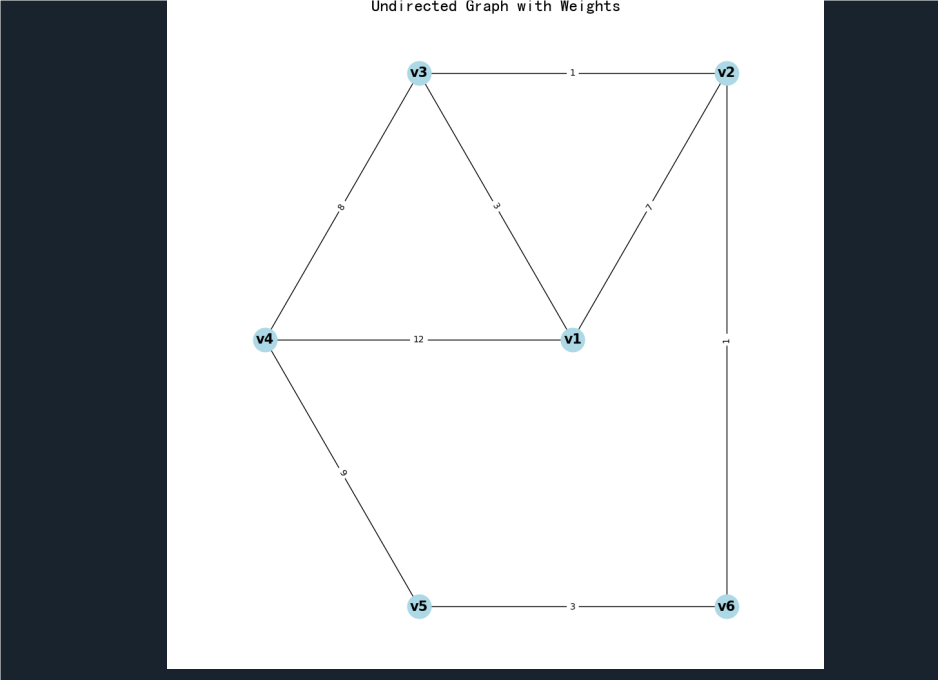
b图
点击查看代码
import networkx as nx
import matplotlib.pyplot as plt  G = nx.Graph()  nodes = ['v1', 'v2', 'v3', 'v4', 'v5', 'v6']
G.add_nodes_from(nodes)  edges = [  ('v1', 'v2', 7),  ('v1', 'v3', 3),  ('v1', 'v4', 12),  ('v2', 'v3', 1),  ('v2', 'v6', 1),  ('v3', 'v4', 8),  ('v4', 'v5', 9),  ('v5', 'v6', 3)
]
G.add_weighted_edges_from(edges)  pos = nx.circular_layout(G)  center = (0, 0)
pos['v1'] = center  def draw_edges_with_weights(G, pos):  edge_labels = {(u, v): d['weight'] for u, v, d in G.edges(data=True)}  nx.draw_networkx_edge_labels(G, pos, edge_labels=edge_labels)  plt.figure(figsize=(10, 10))
nx.draw(G, pos, with_labels=True, node_color='lightblue', node_size=700, font_size=15, font_weight='bold')
draw_edges_with_weights(G, pos)
plt.title("Undirected Graph with Weights")
plt.axis('equal')
plt.show()print("学号:3001")
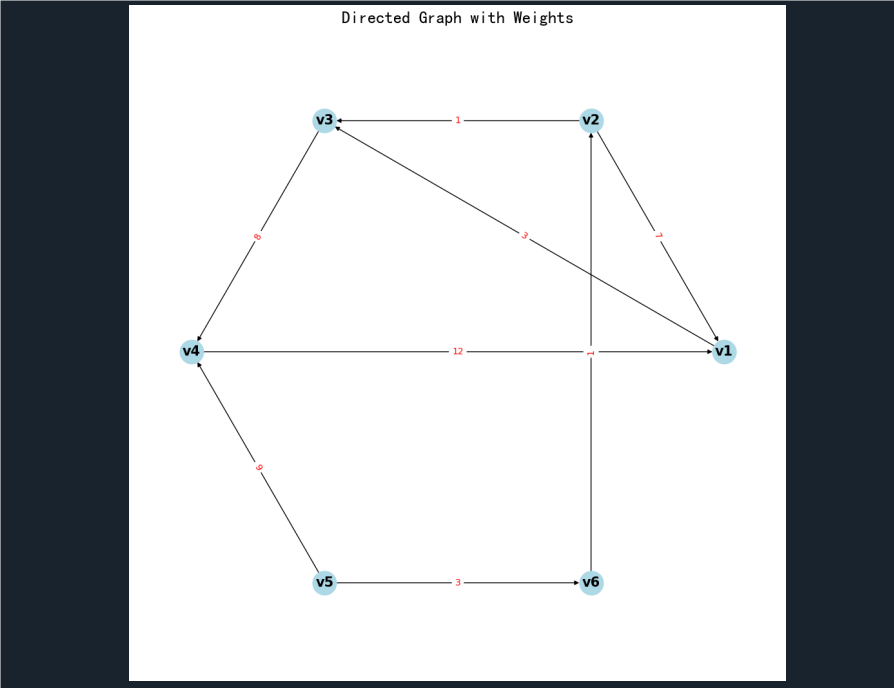
c图
点击查看代码
import networkx as nx
import matplotlib.pyplot as plt  G = nx.DiGraph()  nodes = ['v1', 'v2', 'v3', 'v4', 'v5', 'v6']
G.add_nodes_from(nodes)  edges = [  ('v2', 'v1', 7),  ('v1', 'v3', 3),  ('v4', 'v1', 12),  ('v2', 'v3', 1),  ('v6', 'v2', 1),  ('v3', 'v4', 8),  ('v5', 'v4', 9),  ('v5', 'v6', 3)
]
G.add_weighted_edges_from(edges)  pos = nx.circular_layout(G)  def draw_edges_with_weights(G, pos):  edge_labels = {(u, v): d['weight'] for u, v, d in G.edges(data=True)}  nx.draw_networkx_edge_labels(G, pos, edge_labels=edge_labels, font_color='red')  plt.figure(figsize=(10, 10))
nx.draw(G, pos, with_labels=True, node_color='lightblue', node_size=700, font_size=15, font_weight='bold', arrows=True)
draw_edges_with_weights(G, pos)
plt.title("Directed Graph with Weights")
plt.axis('equal')
plt.show()
print("学号:3001")
习题6.3
点击查看代码
import heapq  def prim(graph, start):  num_nodes = len(graph)  visited = [False] * num_nodes  min_heap = [(0, start, -1)]   mst_cost = 0  mst_edges = []  while min_heap:  weight, u, parent = heapq.heappop(min_heap)  if visited[u]:  continue  visited[u] = True  mst_cost += weight  if parent != -1:  mst_edges.append((parent, u, weight))  for v in range(num_nodes):  if not visited[v] and graph[u][v] != 0:  heapq.heappush(min_heap, (graph[u][v], v, u))  return mst_cost, mst_edges  graph = [  [0,20,0,0,15,0],  [20,0,20,60,25,0],  [0,20,0,30,18,0],  [0,60,30,0,35,10],  [0,0,0,10,15,0]
]  mst_cost, mst_edges = prim(graph, 0)
print("Prim's MST Cost:", mst_cost)
print("Prim's MST Edges:", mst_edges)print("学号:3001")

习题6.4
点击查看代码
initial_costs = [2.5, 2.6, 2.8, 3.1]
salvage_values = [2.0, 1.6, 1.3, 1.1]
maintenance_costs = [0.3, 0.8, 1.5, 2.0]  dp = [[float('inf')] * 2 for _ in range(4)]
dp[0][1] = initial_costs[0] + maintenance_costs[0]  for i in range(1, 4):  dp[i][1] = min(dp[i-1][1] + maintenance_costs[i],  initial_costs[i] + maintenance_costs[i])  if i > 0:  dp[i][0] = dp[i-1][1] + salvage_values[i-1] min_cost = min(dp[3][1],  min(dp[i][0] for i in range(3)))  print(f"最优更新策略下的4年内最小总费用是:{min_cost}万元")
print("学号:3001")

习题6.5
点击查看代码
import numpy as np  distances = np.array([  [0, 2, 7, np.inf, np.inf, np.inf],  [2, 0, 4, 6, 8, np.inf],           [7, 4, 0, 1, 3, np.inf],          [np.inf, 6, 1, 0, 1, 6],           [np.inf, 8, 3, 1, 0, 3],          [np.inf, np.inf, np.inf, 6, 3, 0]
], dtype=float)  students = np.array([50, 40, 60, 20, 70, 90])  hospital_distances_sum = np.zeros(6)
for i in range(6):   connected_distances = distances[i, :i+1].copy()  connected_distances = connected_distances[connected_distances != np.inf]  hospital_distances_sum[i] = np.sum(connected_distances)
hospital_location = np.argmin(hospital_distances_sum)
print(f"医院应该建在村庄 {chr(65 + hospital_location)} 处,使得最远村庄的人到医院看病所走的路最短。")  school_total_distances = np.zeros(6)
for i in range(6):  weighted_distances = 0  for j in range(6):  if distances[j, i] != np.inf:  weighted_distances += students[j] * distances[j, i]  school_total_distances[i] = weighted_distances  school_location = np.argmin(school_total_distances)
print(f"小学应该建在村庄 {chr(65 + school_location)} 处,使得所有学生上学走的总路程最短。")
print("学号:3001")

习题6.7
(1)
点击查看代码
import numpy as np
import pandas as pd
import networkx as nx
import matplotlib.pyplot as plt
from matplotlib.patches import RegularPolygon  # 用于绘制五角星  # 读取数据
a = pd.read_excel('ti6_7.xlsx')
b = a.values  # 提取数据
s = list(b[:, 0])  # 节点名称
x = b[:, 1]  # x坐标
y = b[:, 2]  # y坐标
num = b[:, 3].astype(float)  # 节点类型
ad = b[:, 4:].astype(str)  # 邻接矩阵(字符串形式)  # 转换节点类型
in1 = np.where(num == 1)[0]  # 一类重要点
in2 = np.where(num == 2)[0]  # 二类重要点
in3 = np.where(np.isnan(num))[0]  # 一般点  # 绘制节点
plt.figure()
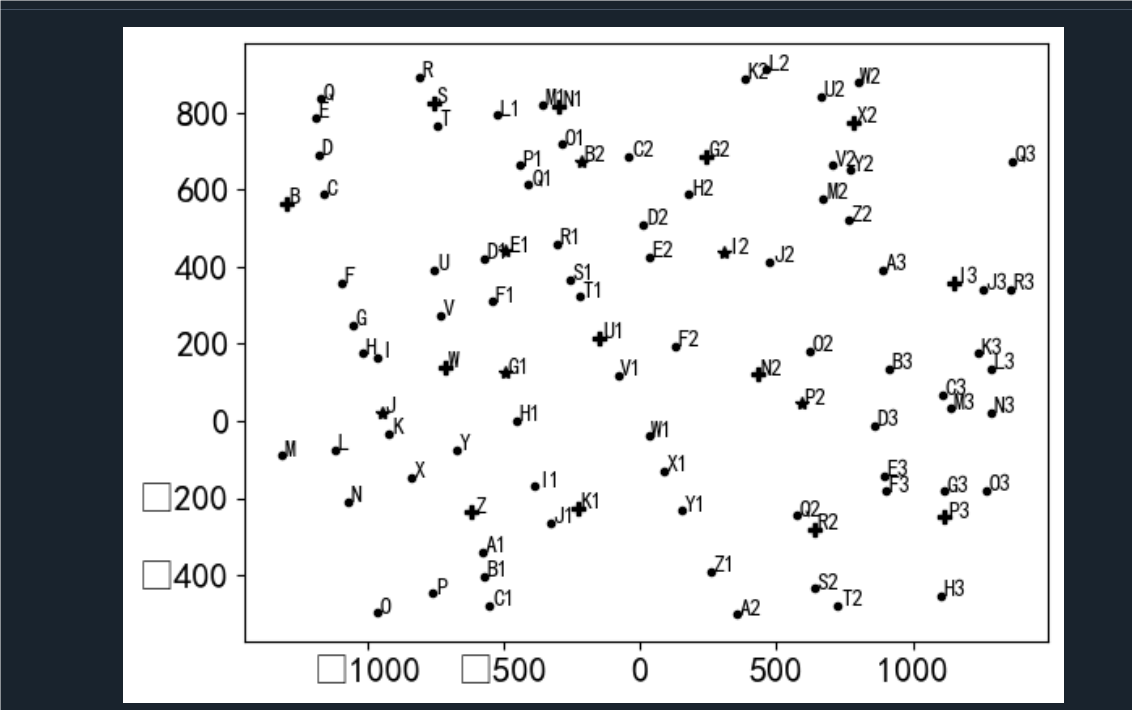
plt.plot(x[in1], y[in1], 'Pk')
for i in range(len(in1)):  plt.text(x[in1[i]] + 10, y[in1[i]], s[in1[i]], fontsize=10)
plt.plot(x[in2], y[in2], '*k')  # 二类重要点
for i in range(len(in2)):  plt.text(x[in2[i]] + 10, y[in2[i]], s[in2[i]], fontsize=10)
plt.plot(x[in3], y[in3], '.k')  # 一般点
for i in range(len(in3)):  plt.text(x[in3[i]] + 10, y[in3[i]], s[in3[i]], fontsize=10)  # 构建距离矩阵
c = np.zeros((len(s), len(s)))
for i in range(len(s)):  tt = list(ad[i])  tt = [t for t in tt if t != 'nan' and t in s]  # 过滤掉非节点名称和NaN  for k in range(len(tt)):  j = s.index(tt[k])  c[i, j] = np.sqrt((x[i] - x[j]) ** 2 + (y[i] - y[j]) ** 2)  # 只保留非零元素作为图的边
i, j = np.nonzero(c)
c = c[i, j]
edges = list(zip(i, j, c))  # 创建图并添加边
G = nx.Graph()
G.add_nodes_from(s)
G.add_weighted_edges_from(edges)
plt.show()
print("学号:3001")
(2)和(3)
点击查看代码
import numpy as np
import pandas as pd
import networkx as nx
import matplotlib.pyplot as plt  # 读取数据
a = pd.read_excel('ti6_7.xlsx')
b = a.values  # 提取数据
s = list(b[:, 0])
x = b[:, 1]
y = b[:, 2]
num = b[:, 3].astype(float)
ad = b[:, 4:].astype(str)  # 分类索引
in1 = np.where(num == 1)[0]
in2 = np.where(num == 2)[0]
in3 = np.where(np.isnan(num))[0]  # 绘图
plt.plot(x[in1], y[in1], 'Pk')  # 修正了变量名
for i in range(len(in1)):  plt.text(x[in1[i]] + 10, y[in1[i]], s[in1[i]])
plt.plot(x[in2], y[in2], '*k')
for i in range(len(in2)):  plt.text(x[in2[i]] + 10, y[in2[i]], s[in2[i]])
plt.plot(x[in3], y[in3], '.k')
for i in range(len(in3)):  plt.text(x[in3[i]] + 10, y[in3[i]], s[in3[i]])
plt.show()  # 创建距离矩阵
c = np.zeros((len(s), len(s)))
for i in range(len(s)):  tt = list(ad[i])  tt = [t for t in tt if t != 'nan' and t in s]  # 确保t是有效的节点名  for k in range(len(tt)):  j = s.index(tt[k])  c[i, j] = np.sqrt((x[i] - x[j]) ** 2 + (y[i] - y[j]) ** 2)  # 修正了距离计算  # 创建图并添加边
G = nx.Graph()
G.add_nodes_from(s)  edges = []
for i in range(len(s)):  for j in range(len(s)):  if c[i, j] > 0:  # 只添加有实际距离的边  edges.append((s[i], s[j], c[i, j]))
G.add_weighted_edges_from(edges)  # 计算最小生成树
T = nx.minimum_spanning_tree(G)
w = nx.get_edge_attributes(T, 'weight')
total_weight = sum(w.values())  # 计算最小生成树的总权重
print('最小生成树的长度为:', round(total_weight, 4))  # 绘制最小生成树
pos = dict(zip(s, b[:, [1, 2]]))
plt.figure()
nx.draw_networkx(T, pos, node_size=180, font_weight='bold', with_labels=True, node_color='w')
plt.show()  # 计算最短路径和最短距离(确保起点和终点在图中)
if 'I' in G.nodes() and 'R3' in G.nodes():  p = nx.shortest_path(G, 'I', 'R3', weight='weight')  d = nx.shortest_path_length(G, 'I', 'R3', weight='weight')  print('最短路径为:', p)  print('最短距离为:', round(d, 4))  # 绘制原图并突出显示最短路径  plt.figure()  nx.draw_networkx(G, pos, node_size=180, font_weight='bold', with_labels=True, node_color='w')  path_edges = list(zip(p, p[1:]))  nx.draw_networkx_edges(G, pos, edgelist=path_edges, edge_color='r', style='dashed', width=4)  plt.show()
else:  print("起点或终点不在图中。")
print("学号:3001")

