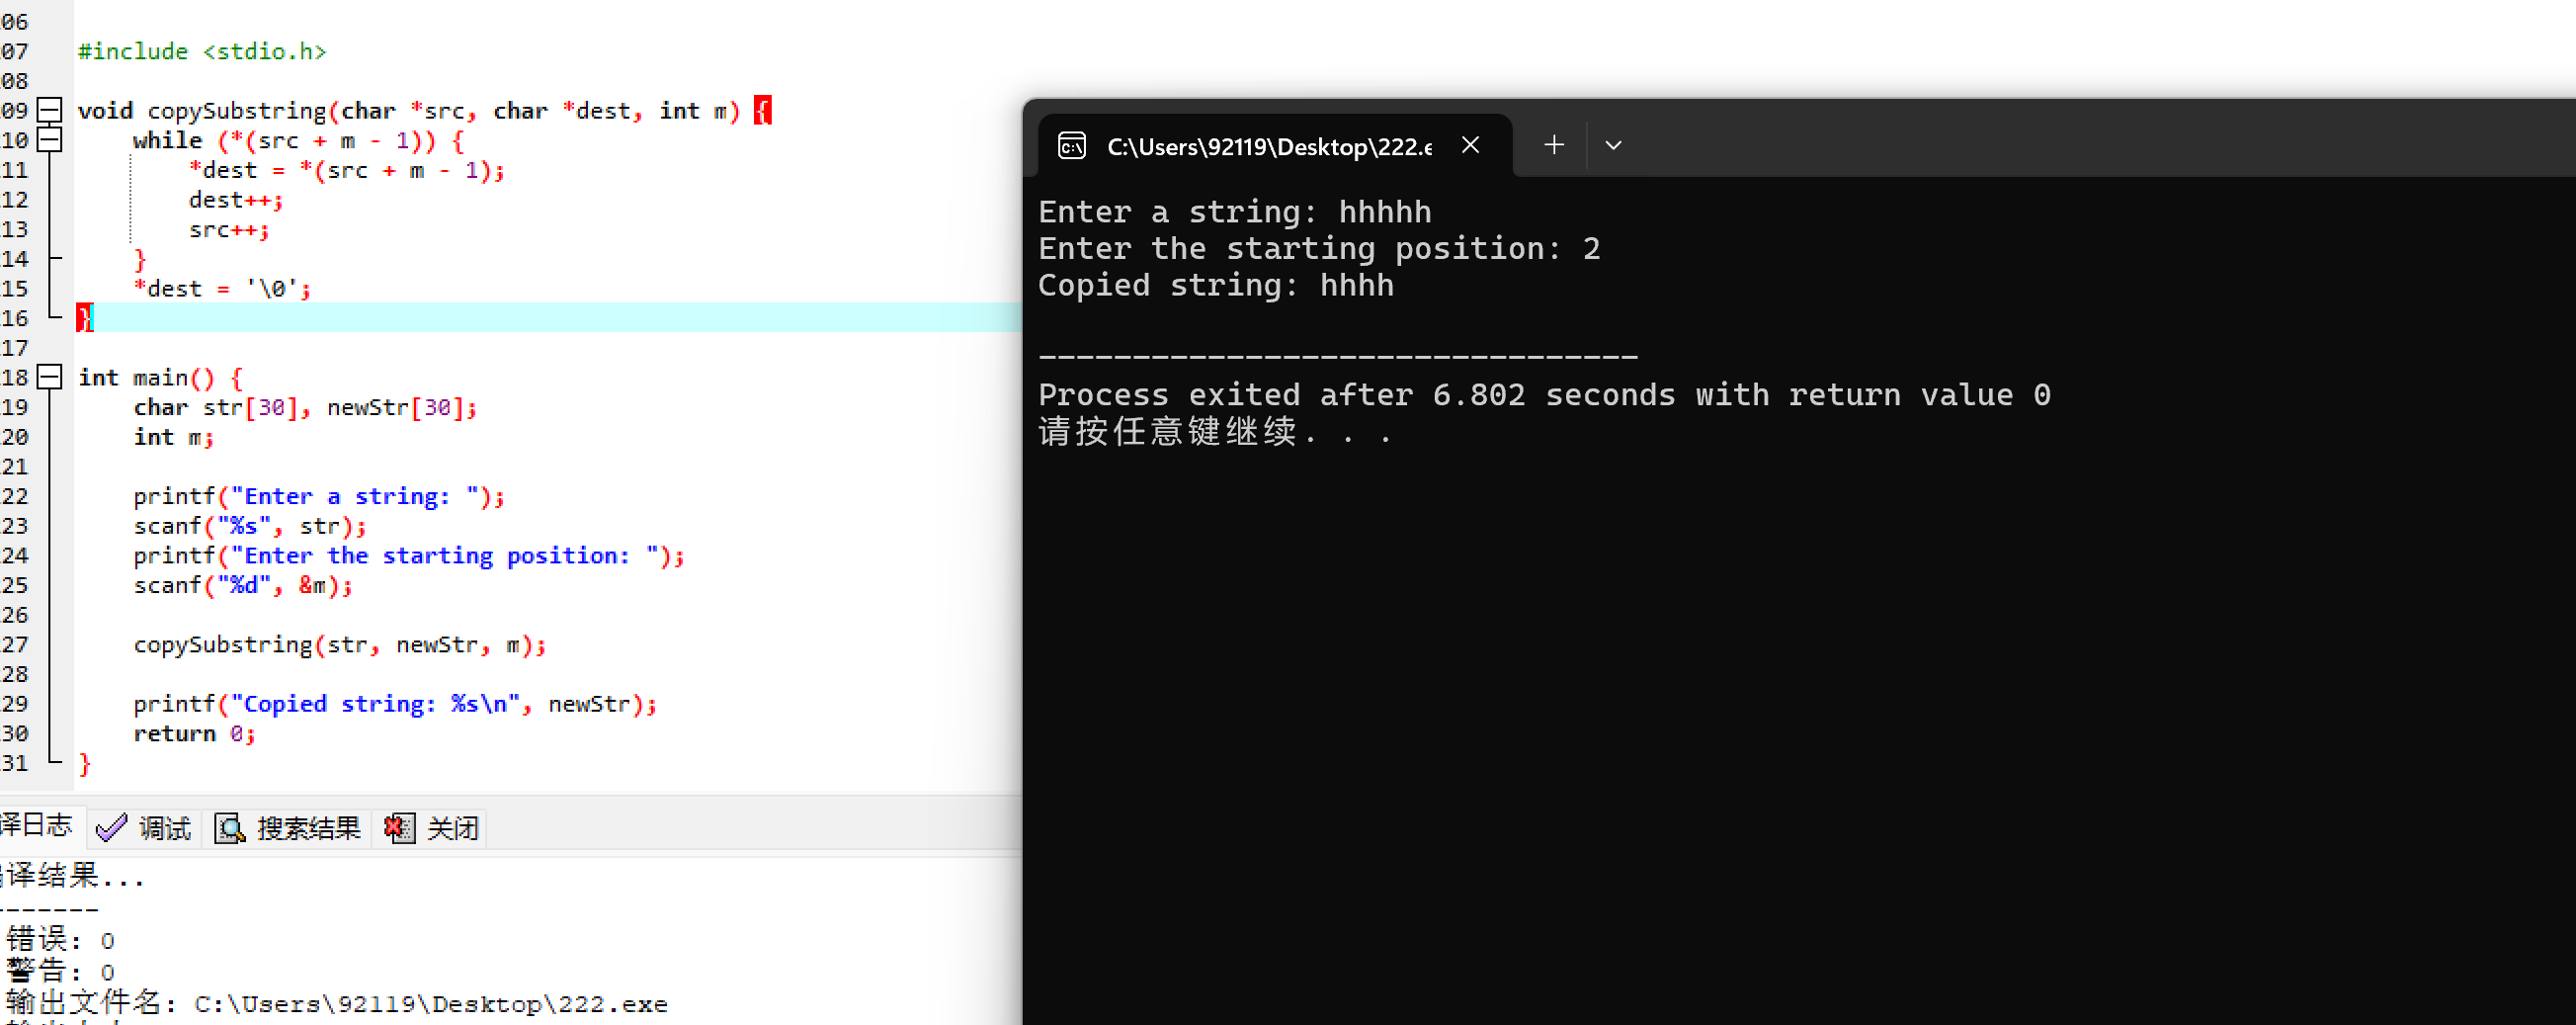
习题7.1
点击查看代码
import numpy as np
from scipy.interpolate import interp1d
from scipy.integrate import quad
import matplotlib.pyplot as pltg = lambda x: (3 * x ** 2 + 4 * x + 6) * np.sin(x) / (x ** 2 + 8 * x + 6)
x0 = np.linspace(0, 10, 1000)
y0 = g(x0)
# 创建三次样条插值函数
gh = interp1d(x0, y0, 'cubic')
xn = np.linspace(0, 10, 10000)
yn = gh(xn)
Il = quad(g, 0, 10)
I2 = np.trapz(yn, xn)
print('Il =', Il) # 将会输出积分值,误差值
print('I2 =', I2)
plt.rc('font', family='SimHei')  # 设置字体为 SimHei
plt.rc('axes', unicode_minus=False)  # 正确显示负号
plt.plot(x0, y0, '*-', label='原来函数')
plt.plot(xn, yn, '.-', label='插值函数')
plt.legend()
plt.show()
print("学号后四位:3001")
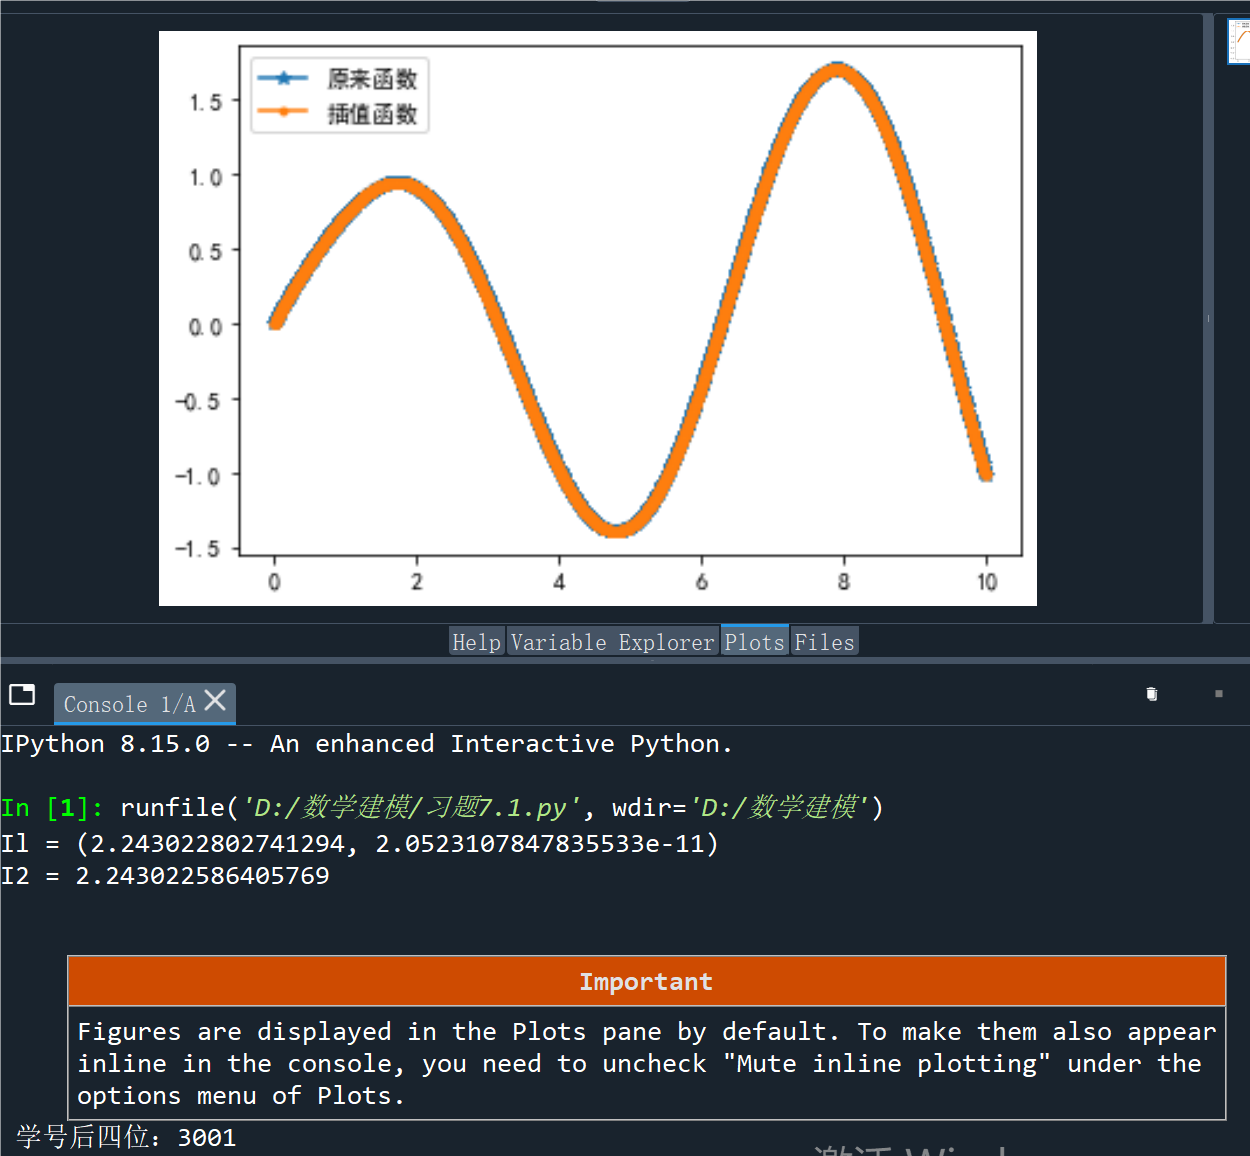
习题7.3
点击查看代码
import numpy as np
import pylab as plt
from scipy.interpolate import interp1d
T0=np.linspace(700,780,5)
V0=np.array([0.0977,0.1218,0.1406,0.1551,0.1664])
T=[750,770]
fv1=interp1d(T0,V0);fv2=interp1d(T0,V0,'cubic')
V1=fv1(T);V2=fv2(T)
xn=np.linspace(700,780,81)
vn1=fv1(xn);vn2=fv2(xn)
plt.rc('font',family='SimHei')
plt.plot(xn,vn1,'-*',label="线性插值")
plt.plot(xn,vn2,'.-',label="三次样条插值")
plt.legend()
plt.show()
print("学号后四位:3001")
习题7.4
点击查看代码
import numpy as np
import pylab as plt
import numpy.random as nr
from scipy.interpolate import griddata
z = lambda x, y: (x**2 - 2*x) * np.exp(-x**2 - y**2 - x*y)
# 生成随机点
x0 = nr.uniform(-3, 3, 60)
y0 = nr.uniform(-4, 4, 60)
z0 = z(x0, y0)
# 创建网格
xn = np.linspace(-3, 3, 61)
yn = np.linspace(-4, 4, 81)
xn, yn = np.meshgrid(xn, yn)
# 将随机点坐标组合成 (x, y) 对
xy0 = np.vstack([x0, y0]).T
# 使用 griddata 进行插值
zn1 = griddata(xy0, z0, (xn, yn), method='cubic')
zn2 = griddata(xy0, z0, (xn, yn), method='nearest')
# 处理 NaN 值(如果有的话),这里使用最近邻插值的结果来填充
zn1[np.isnan(zn1)] = zn2[np.isnan(zn1)]
# 创建子图
fig = plt.figure()
ax1 = fig.add_subplot(121, projection='3d')
ax2 = fig.add_subplot(122, projection='3d')
# 绘制原始函数曲面
ax1.plot_surface(xn, yn, z(xn, yn), cmap='summer')
ax1.set_title('原函数图形')
# 绘制插值后的曲面
# 注意:这里应该使用 ax2 而不是 ax1 来绘制第二个曲面
ax2.plot_surface(xn, yn, zn1, cmap='winter')
ax2.set_title('插值函数图形')
# 显示图形
plt.show()
print("学号后四位:3001")
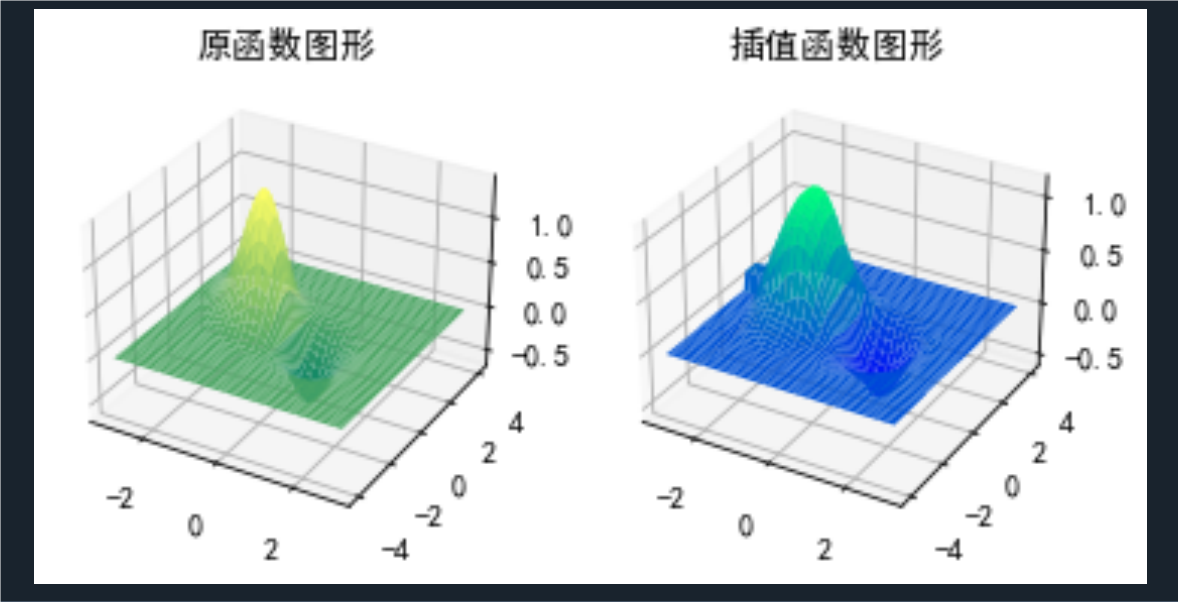
习题7.7
点击查看代码
import numpy as np
import matplotlib.pyplot as plt
from scipy.optimize import curve_fit, leastsq, least_squares
from scipy.constants import edef g(x, a, b):return (10 * a) / (10 * b + (a - 10 * b) * np.exp(a * np.sin(x)))a = 1.1
b = 0.01x_values = np.arange(1, 21)
y_values = g(x_values, a, b)for i, (xi, yi) in enumerate(zip(x_values, y_values), start=1):print(f"({xi}, {yi:.6f})")popt_curve_fit, pcov_curve_fit = curve_fit(g, x_values, y_values, p0=[a, b])
y_fit_curve_fit = g(x_values, *popt_curve_fit)def func_leastsq(params, x, y):return y - g(x, *params)popt_leastsq = leastsq(func_leastsq, [a, b], args=(x_values, y_values))[0]
y_fit_leastsq = g(x_values, *popt_leastsq)popt_least_squares = least_squares(func_leastsq, [a, b], args=(x_values, y_values)).x
y_fit_least_squares = g(x_values, *popt_least_squares)print("\ncurve_fit parameters:", popt_curve_fit)
print("leastsq parameters:", popt_leastsq)
print("least_squares parameters:", popt_least_squares)plt.figure(figsize=(10, 6))
plt.scatter(x_values, y_values, label='Simulated data', color='red')
plt.plot(x_values, y_fit_curve_fit, label='curve_fit', linestyle='-')
plt.plot(x_values, y_fit_leastsq, label='leastsq', linestyle='--')
plt.plot(x_values, y_fit_least_squares, label='least_squares', linestyle='-.')
plt.xlabel('x')
plt.ylabel('g(x)')
plt.legend()
plt.title('Fitting of g(x) using curve_fit, leastsq, and least_squares')
plt.grid(True)
plt.show()print("学号后四位:3001")
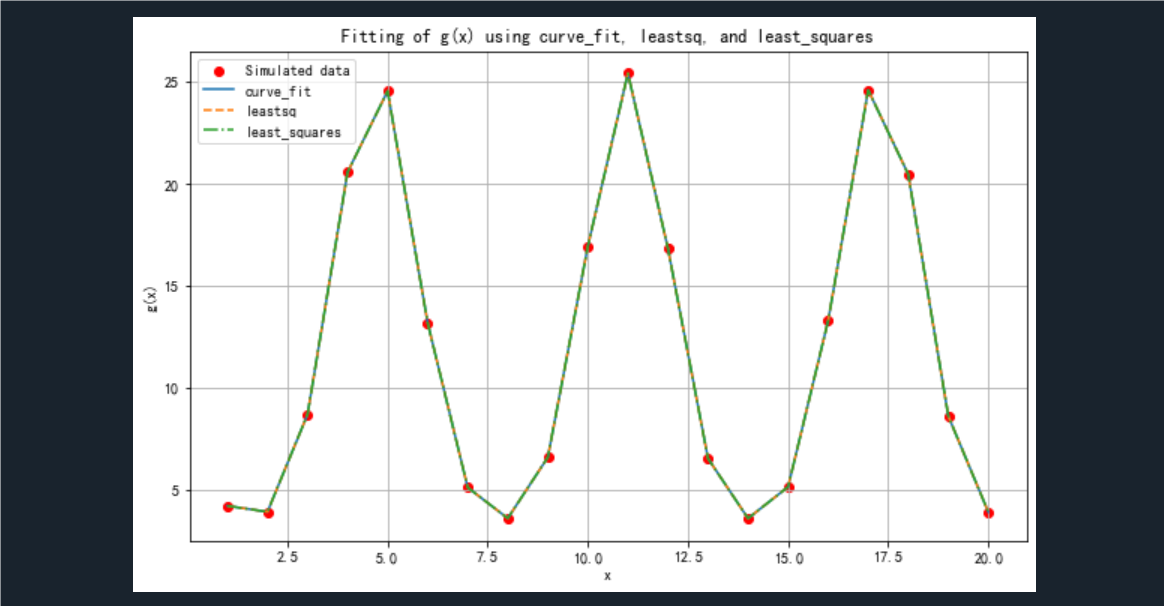
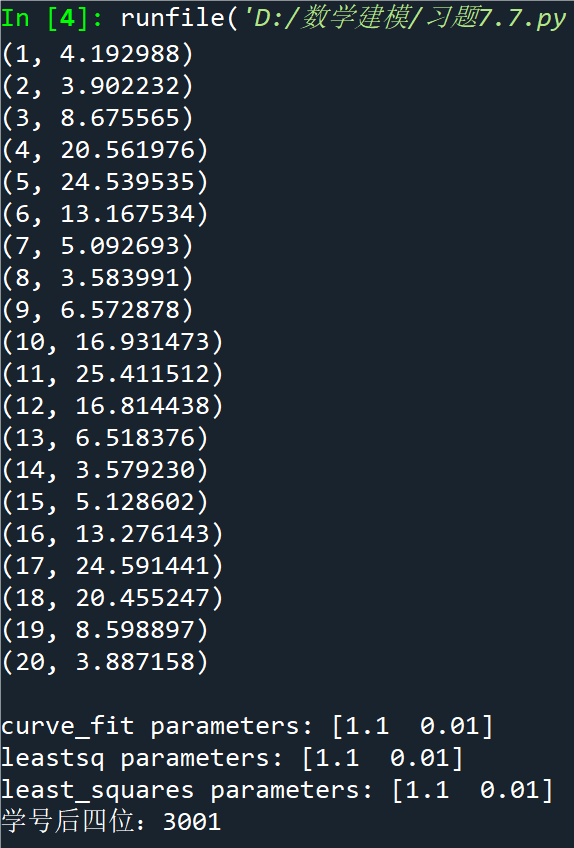
习题7.10

点击查看代码
import numpy as np
from scipy.interpolate import interp1d,lagrange
import matplotlib.pyplot as plt
from scipy.optimize import curve_fit# 加载数据
a = np.loadtxt('ti7.10.txt')
x0 = a[::2].flatten()
y0 = a[1::2].flatten()# Lagrange 插值
p1 = lagrange(x0, y0)
yx1 = interp1d(x0,y0)
yx2 = interp1d(x0, y0, 'quadratic')
yx3 = interp1d(x0, y0, 'cubic')# 生成用于绘图的x值
x = np.linspace(-2, 4.9, 200)# 设置绘图参数
plt.rc('font', family='SimHei')
plt.rc('axes', unicode_minus=False)# 绘制Lagrange插值
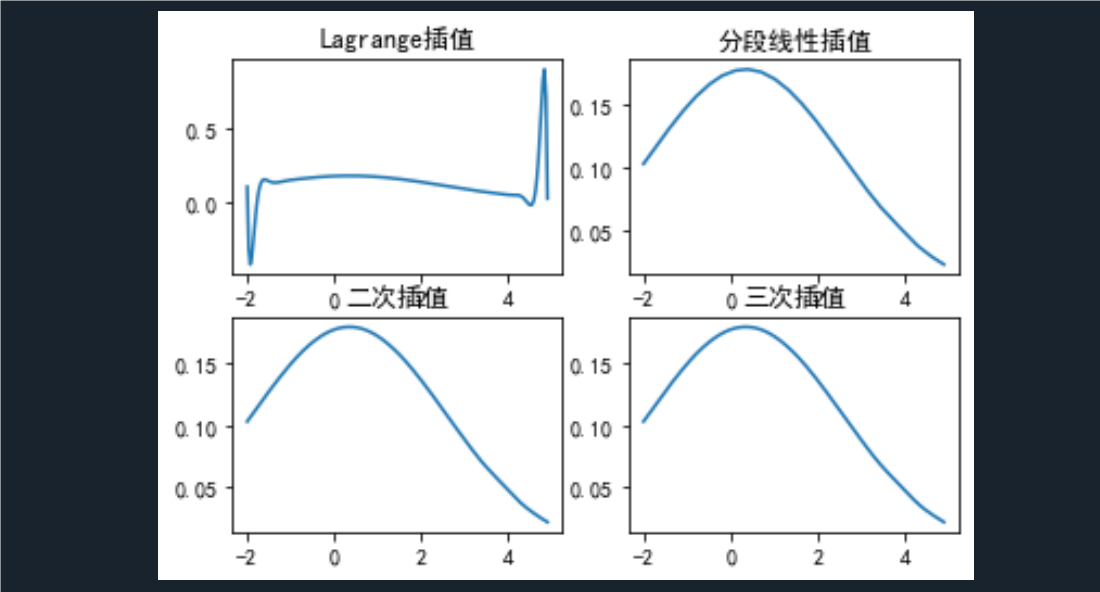
plt.subplot(221)
plt.plot(x, np.polyval(p1,x))
plt.title('Lagrange插值')# 绘制分段线性插值
plt.subplot(222)
plt.plot(x, yx1(x))
plt.title('分段线性插值')# 绘制二次插值
plt.subplot(223)
plt.plot(x, yx2(x))
plt.title('二次插值')# 绘制三次插值
plt.subplot(224)
plt.plot(x, yx3(x))
plt.title('三次插值')# 多项式拟合
m = len(x0)
RMSE = []
S = []
for n in range(1, 5):p = np.polyfit(x0, y0, n)rmse = np.sqrt(sum((np.polyval(p,x0) - y0) ** 2) / (m - n - 1))RMSE.append(rmse)S.append(p)ind = np.argmin(RMSE)  # 求RMSE最小值的索引
print("拟合的多项式次数:", ind + 1)
print(np.round(S[ind], 4))def gaussian(x, mu, sigma):return (1 / (np.sqrt(2 * np.pi) * sigma)) * np.exp(-((x - mu) ** 2) / (2 * sigma ** 2))# 使用curve_fit来拟合高斯函数到数据
params, covariance = curve_fit(gaussian, x0, y0, p0=[np.mean(x0), np.std(x0)])# 打印拟合的系数
print('拟合的均值和标准差:', np.round(params, 4))# 计算拟合函数的取值
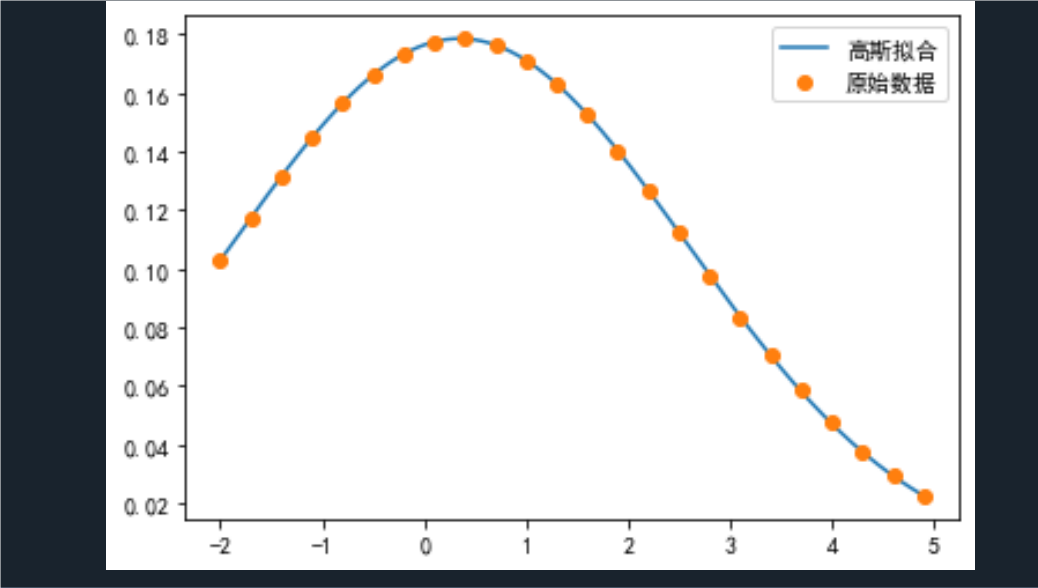
yh = gaussian(x, *params)# 绘制拟合曲线
plt.figure()
plt.plot(x, yh, label='高斯拟合')
plt.plot(x0, y0, 'o', label='原始数据')
plt.legend()
plt.show()
print('学号:3001')
