思路:使用多个移表盘叠加
效果图:
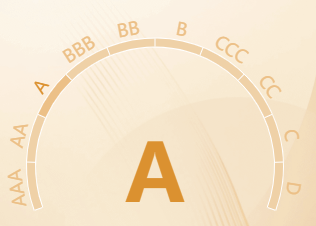
代码:
setGaugeChart() {this.gaugeChart && this.gaugeChart?.dispose && this.gaugeChart?.dispose()this.gaugeChart = echarts.init(this.$refs.gaugeChartRef)const grades = ['AAA', 'AA', 'A', 'BBB', 'BB', 'B', 'CCC', 'CC', 'C', 'D']const diffAngle = 220 / grades.length / 2 // 计算角度差值,用来使label在两个刻度中间显示const curValue = 2 // 当前值,对应grades索引const gaugeOption = {type: 'gauge',center: ['50%', '75%'],radius: 128,max: grades.length,splitNumber: grades.length,pointer: {show: false},axisTick: {show: false}}// 设置当前值对应的axisLine颜色let lineColor = []if (curValue === 0) {lineColor = [[(curValue + 1) / grades.length, '#ECC087'],[1, '#EFD1A7']]} else if (curValue === grades.length - 1) {lineColor = [[curValue / grades.length, '#EFD1A7'],[(curValue + 1) / grades.length, '#ECC087']]} else {lineColor = [[curValue / grades.length, '#EFD1A7'],[(curValue + 1) / grades.length, '#ECC087'],[1, '#EFD1A7']]}const option = {series: [// 边框底色盘{...gaugeOption,radius: gaugeOption.radius + 1,z: 2,startAngle: 200,endAngle: -20,axisLine: {lineStyle: {width: 10,color: [[1, '#fff']]}},splitLine: {show: false},axisLabel: {show: false}},// 数据展示盘{...gaugeOption,z: 3,startAngle: 200,endAngle: -20,axisLine: {lineStyle: {width: 8,color: lineColor}},splitLine: {distance: -8,length: 8,lineStyle: {color: '#fff',width: 1}},axisLabel: {show: false},detail: {valueAnimation: true,offsetCenter: [0, 15],formatter: () => {return `{a|${grades[curValue] || ''}}`},rich: {a: {color: '#DB9130',fontSize: 80,fontWeight: 600}}},data: [{value: curValue}]},// 展示label仪表盘{...gaugeOption,z: 4,startAngle: 200 - diffAngle,endAngle: -20 - diffAngle,axisLine: {lineStyle: {width: 8,color: [[1, 'rgba(236, 192, 135, 0)']]}},splitLine: {show: false,distance: -8,length: 8,lineStyle: {color: '#fff',width: 1}},axisLabel: {color: '#ECC087',distance: -10,fontSize: 18,rotate: 'tangential',formatter: value => {if (value === curValue) {return `{b|${grades[value] || ''}}`} else {return `{a|${grades[value] || ''}}`}},rich: {a: {fontSize: 18,color: '#ECC087'},b: {fontSize: 18,color: '#DB9130'}}}}]}this.gaugeChart.setOption(option)
}

