Drug2cell is a new computational pipeline that can predict drug targets as well as drug side effects.

该软件是英国sanger研究所的研究人员基于药品与基因调控关系数据库所开发,该工具可以预测药物靶标和药物副作用。
它利用单细胞图谱和EMBL-EBI ChEMBL数据库中的1900万个药物-靶标相互作用。使用该方法能够对于基础医学的研究在后续应用上开拓思路。
应用/背景
1.Drug2cell能够改进新疗法的评估方式及其对器官和组织的影响。
2.它允许检查在有单细胞数据的器官中药物的特定细胞靶点。
3.在心脏的背景下,分析确定了非心脏药物在起搏细胞中表达的靶点,这些药物具有文件记载的节律效应。
其中包括抗糖尿病药物利拉鲁肽(GLP-1类似物)和抗癫痫药物帕拉潘(谷氨酸AMPA受体抑制剂)。这些药物都已知会改变心率,
但在此研究之前,未知它们的靶点存在于起搏细胞中,之前曾提出替代作用部位(分别是ANS和CNS)作为副作用的介导者。
4.将drug2cell应用于全身细胞图谱数据集将通过预测所有器官细胞类型的不良效应来改善体内筛选。
1.安装软件
该软件基于python平台开发,使用pip即可安装,我在安装的时候没有问题。
pip install drug2cell(python)
2.input data
该软件基于human开发,如何是老鼠需要进行ID转换
整合人鼠 anndata 对象
import re,anndata
import pandas as pd
def merge_hm(hadata=None,madata=None,Species='homo',join='outer'):hm = pd.read_csv('mus_homo.txt', sep='\t')hm1 = hm.iloc[:, [4, 6]]  # Adjust column indices if necessaryhm1.columns = ['mus', 'homo']hm1.replace('', pd.NA, inplace=True)if Species == 'homo':d1=list(madata.var_names)hm2 = hm1[hm1['mus'].isin(d1)].dropna()hm3 = hm2[~hm2.duplicated(subset='mus')]madata=madata[:,hm3['mus']]hm3['mus'] = pd.Categorical(hm3['mus'], categories=list(madata.var_names), ordered=True)madata.var_names= hm3['homo']hadata.var_names_make_unique()madata.var_names_make_unique()adata=anndata.concat([hadata,madata],join=join)elif Species == 'mus':d1=list(hadata.var_names)hm2 = hm1[hm1['homo'].isin(d1)].dropna()hm3 = hm2[~hm2.duplicated(subset='homo')]hadata=hadata[:,hm3['homo']]hm3['homo'] = pd.Categorical(hm3['homo'], categories=list(hadata.var_names), ordered=True)hadata.var_names= hm3['mus']hadata.var_names_make_unique()madata.var_names_make_unique()adata=anndata.concat([hadata,madata],join=join)return(adata)
import scanpy as sc
import drug2cell as d2c
import blitzgsea as blitz
sc.settings.set_figure_params(dpi=80)
1.Drug2cell offers two independent sets of utility functions for assessing gene group activity in single cell data - scoring and overrepresentation/enrichment. This notebook will demonstrate both on PBMC3K demo data.
1.Drug2cell 提供了两套独立的实用功能,用于评估单细胞数据中基因组活动——评分和过表达/富集。本笔记将在 PBMC3K 演示数据上展示这两种方法。
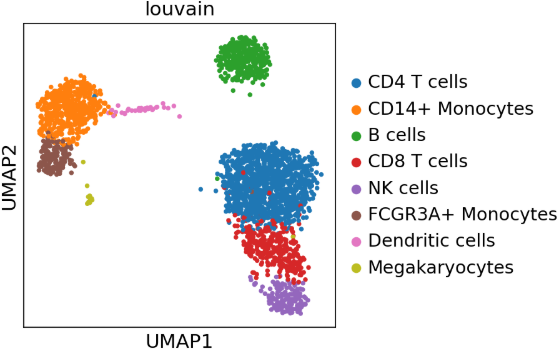
adata = sc.datasets.pbmc3k_processed()
sc.pl.umap(adata, color="louvain")
Scoring
2.The scoring function efficiently computes the mean of the expression of each gene group in each cell. Can be directed to an appropriate location of log-normalised data via a combination of the layer and use_raw arguments.
By default, the function will load a set of ChEMBL drugs and their targets in a form distributed with the package.
2.评分函数可以高效地计算每个细胞中每个基因组表达的均值。通过组合 layer 和 use_raw 参数,可以将其定向到对数归一化数据的适当位置。
默认情况下,该函数将加载一组 ChEMBL 药物及其靶标,这些靶标以该软件包分发的形式提供。
d2c.score(adata, use_raw=True)
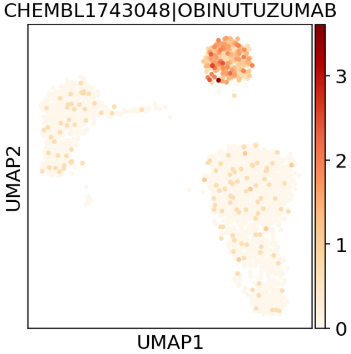
2.1 d2c.score() creates a fully fledged AnnData object in adata.uns['drug2cell'] with the gene groups as the feature space. The original object's .obs and .obsm get copied over for ease of downstream use. Let's use the existing UMAP to visualise a drug.
2.1 d2c.score() 创建了一个完整的 AnnData 对象,存储在 adata.uns['drug2cell'] 中,其中基因组作为特征空间。原始对象的 .obs 和 .obsm 被复制过来,便于后续使用。让我们使用现有的 UMAP 来可视化一个药物。
sc.pl.umap(adata.uns['drug2cell'], color="CHEMBL1743048|OBINUTUZUMAB", color_map="OrRd")
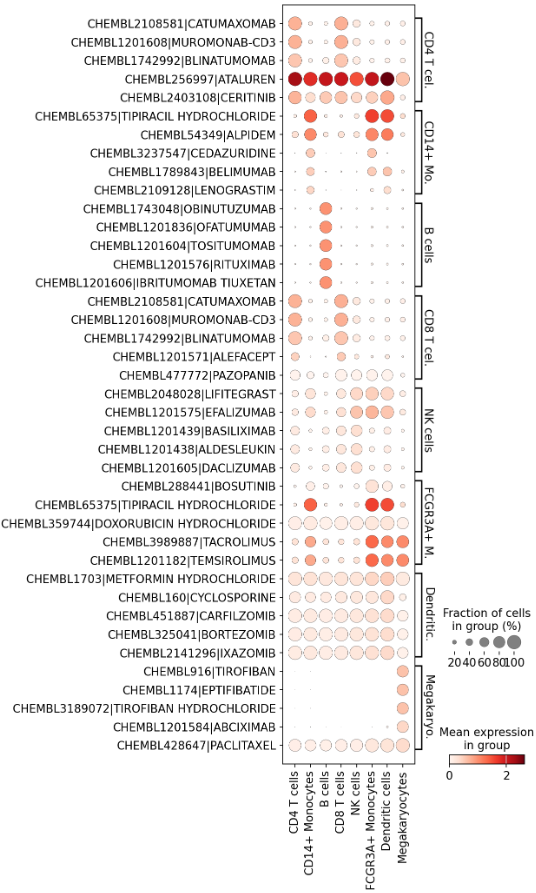
We can use the new object to run differential expression analysis, getting gene groups that are up-regulated in particular clusters.
sc.tl.rank_genes_groups(adata.uns['drug2cell'], method="wilcoxon", groupby="louvain")
sc.pl.rank_genes_groups_dotplot(adata.uns['drug2cell'], swap_axes=True, dendrogram=False, n_genes=5)
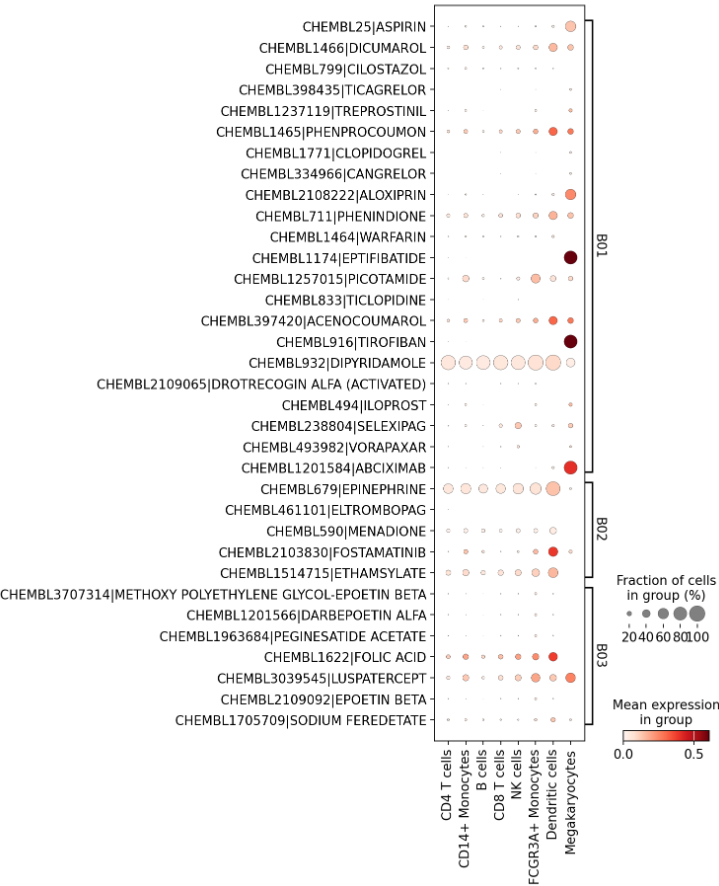
If working with the ChEMBL drug targets and aiming to plot complete ATC groups, there's a helper function within drug2cell which prepares some extra arguments for use in scanpy plotting. Passing them to the visualising functions selects the appropriate compounds and groups them nicely. The syntax to do so is catching the output of d2c.util.prepare_plot_args() into a variable, and then passing that variable into a plotting function with ** at the start, like below.
It's possible to subset this drug space based on their ATC level 1 and 2 categorisation by use of the categories argument.
如果使用 ChEMBL 药物靶标并计划绘制完整的 ATC 组,drug2cell 中有一个辅助函数,可以准备一些额外的参数以用于 scanpy 绘图。将这些参数传递给可视化函数可以选择合适的化合物并将它们进行适当的分组。使用的语法是捕获 d2c.util.prepare_plot_args() 的输出到一个变量中,然后将该变量以 ** 开头传递到绘图函数中,如下所示。
通过使用 categories 参数,可以根据它们的 ATC 1级和2级分类来细分这个药物空间。
plot_args = d2c.util.prepare_plot_args(adata.uns['drug2cell'], categories=["B01","B02","B03"])
sc.pl.dotplot(adata.uns['drug2cell'], groupby="louvain", swap_axes=True, **plot_args)
Specifying gene groups
3.It's possible to use drug2cell to score any gene groups of choice. All it takes is a dictionary with the group names as keys and corresponding gene membership lists as items.
This is the same format as the ~200 various libraries of gene sets distributed within blitzgsea.enrichr. Let's load one and take a look at the formatting.
可以使用drug2cell来评分任何选择的基因组。所需的只是一个字典,其中以组名为键,相应的基因成员列表为值。
这与blitzgsea.enrichr中分发的大约200个不同基因集库的格式相同。让我们加载一个并查看格式。
targets = blitz.enrichr.get_library("GO_Molecular_Function_2021")
targets["MHC class II receptor activity (GO:0032395)"]
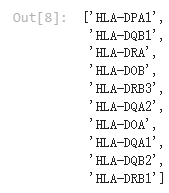
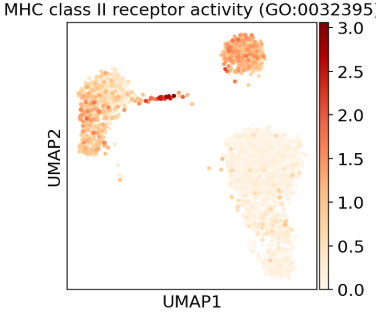
It's now possible to run drug2cell's scoring with these gene groups, passing them as the targets argument.
d2c.score(adata, targets=targets, use_raw=True)
sc.pl.umap(adata.uns['drug2cell'], color="MHC class II receptor activity (GO:0032395)", color_map="OrRd")
Overrepresentation/enrichment
Please ensure you've ran sc.tl.rank_genes_groups() on your gene space object prior to commencing these analyses.
#this is an old object, so it will benefit from having an up-to-date marker detection performed on it
sc.tl.rank_genes_groups(adata, method="wilcoxon", groupby="louvain", use_raw=True)
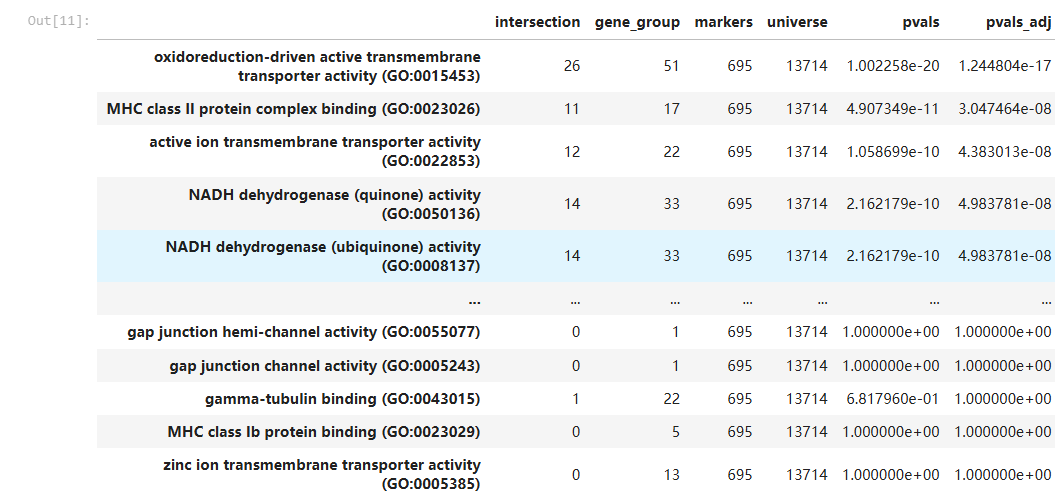
4.Seeing how both the marker genes and gene group memberships are sets, it's possible to compute an overlap between them and evaluate its significance. This can be accomplished via the hypergeometric test, and drug2cell comes with a function to do that.
d2c.hypergeometric() can either accept a targets dictionary like d2c.score(), or read gene groups embedded within the d2c.score() output. As such, it can be ran without needing to perform scoring first if so desired, as overrepresentation analysis answers a different question.
The output is a dictionary of data frames with the clusters used to compute the markers in the original expression space as the keys.
4.鉴于标记基因和基因组成员都是集合,可以计算它们之间的重叠并评估其显著性。这可以通过超几何检验来完成,drug2cell中包含了一个执行此检验的函数。
d2c.hypergeometric() 可以接受一个类似于 d2c.score() 的目标字典,或者读取嵌入在 d2c.score() 输出中的基因组。因此,如果需要,它可以在不首先执行评分的情况下运行,因为过表达分析回答的是一个不同的问题。
输出是一个数据帧的字典,字典的键是用来计算原始表达空间中的标记的簇。
overrepresentation = d2c.hypergeometric(adata)
overrepresentation["B cells"]
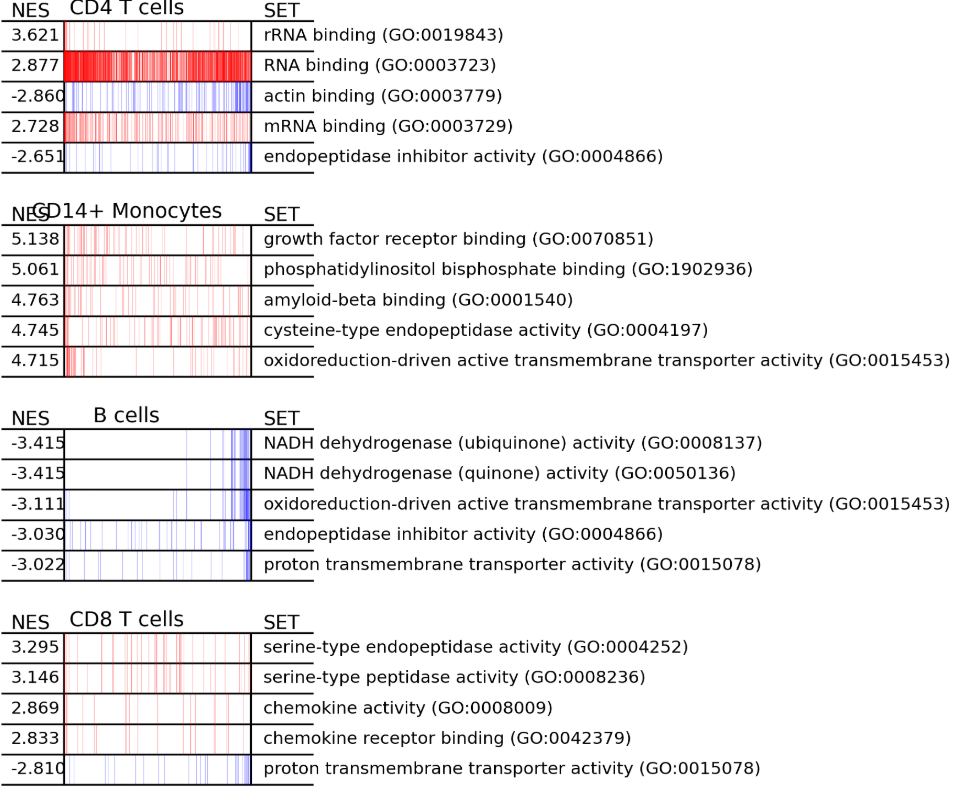
The package also comes with a wrapper for running GSEA (gene set enrichment analysis), carried out via blitzgsea. GSEA is a more advanced alternative to conventional overrepresentation testing, taking the genes ordered by their marker scores and assessing the distribution of the gene group members in it.
d2c.gsea() yields two pieces of output by default. enrichment is a result data frame dictionary akin to what came out put d2c.hypergeometric() above, and plot_gsea_args is a plot-minded collection of arguments that can be passed to d2c.util.plot_gsea() not unlike what was done earlier with the ATC categories helper function.
In the plots, the left side of the bar is genes with high positive scores, and the right side of the bar is genes with high negative scores. Scores near zero do not necessarily fall in the middle, this just represents the ranked order.
该软件包还包括一个用于运行 GSEA(基因集富集分析)的封装函数,通过 blitzgsea 进行。与传统的过表达检测相比,GSEA 是一种更高级的替代方案,它根据基因的标记得分顺序来评估基因组成员在其中的分布。
d2c.gsea() 默认产生两个输出结果。enrichment 是一个类似于上面 d2c.hypergeometric() 输出的结果数据帧字典,plot_gsea_args 是一个面向绘图的参数集合,可以传递给 d2c.util.plot_gsea(),这与之前使用 ATC 类别辅助函数的方式类似。
在图表中,条形图的左侧是具有高正分的基因,右侧是具有高负分的基因。接近零的分数不一定出现在中间,这只代表了排名顺序。
24.cnblogs.com/blog/3492126/202411/3492126-20241128172425399-485974928.png)
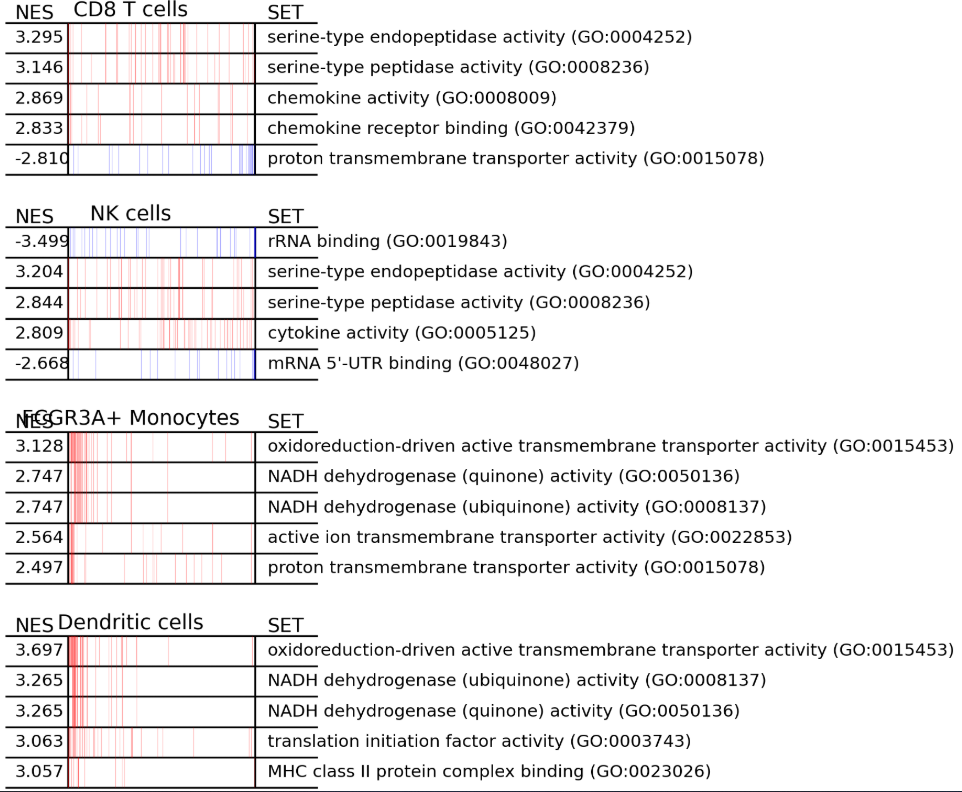
plot_gsea_args is just a dictionary with targets and scores, where scores has groups as keys and the corresponding GSEA gene input as values. It's possible to use those values to call other blitzgsea plotting.
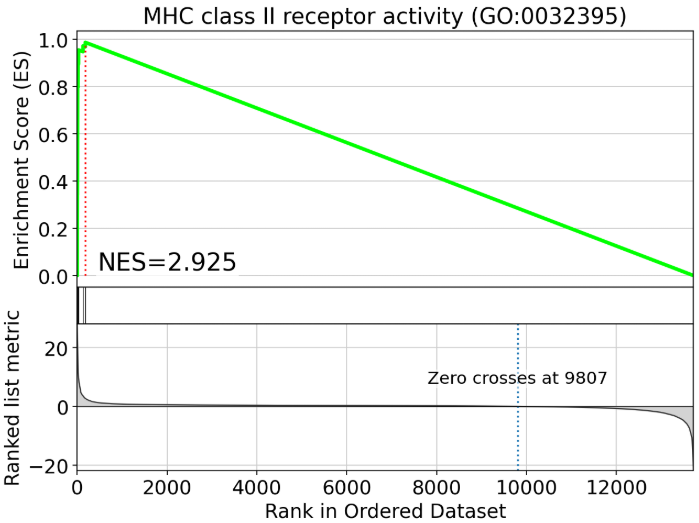
plot_gsea_args 只是一个字典,其中包含目标和分数,分数以组为键,对应的 GSEA 基因输入为值。可以使用这些值来调用其他的 blitzgsea 绘图功能。
fig = blitz.plot.running_sum(signature = plot_gsea_args['scores']['B cells'],library = plot_gsea_args['targets'],result = enrichment['B cells'],geneset = "MHC class II receptor activity (GO:0032395)",interactive_plot = True
)
fig.show()
参考信息———————
sanger:https://www.sanger.ac.uk/technology/drug2cell/
该方法文章介绍:https://www.cn-healthcare.com/articlewm/20230718/content-1579939.html
演示流程:https://github.com/Teichlab/drug2cell/blob/main/notebooks/demo.ipynb
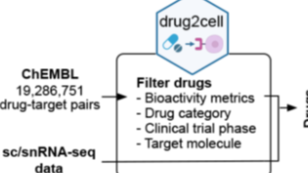 Drug2Cell利用单细胞图谱和EMBL-EBI ChEMBL数据库中的1900万个药物-靶标相互作用。使用该方法能够对于基础医学的研究在后续应用上开拓思路。