文章目录
- avalonia、WPF使用ScottPlot动态显示ECG心电图
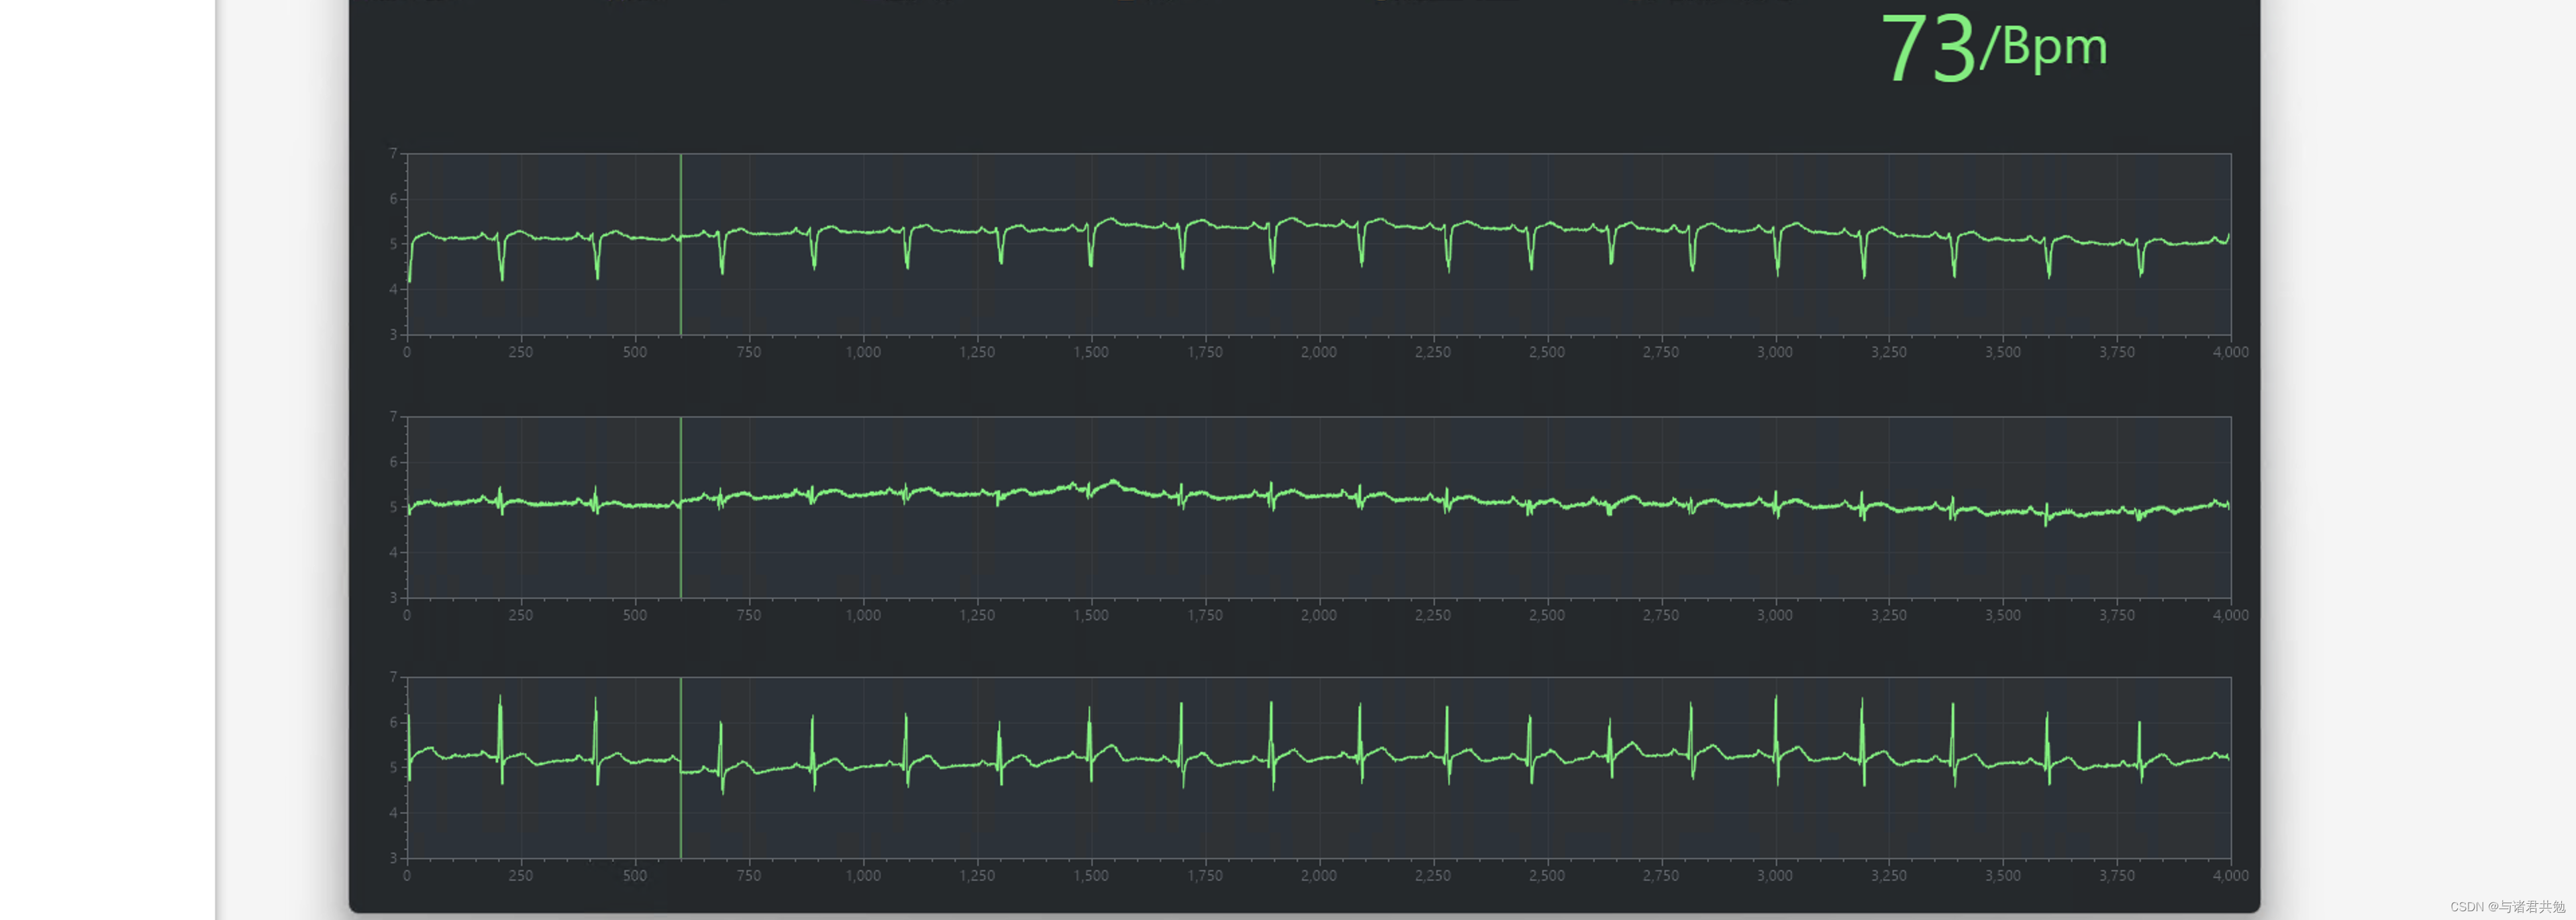
- 实现效果,动态效果懒得录视频了
- 安装
- 代码部分
- UpdateData方法就是用来更新心电图表的方法, 根据消息队列数据去更新是视图中的ScottPlot 图表
avalonia、WPF使用ScottPlot动态显示ECG心电图
avalonia、WPF使用ScottPlot动态显示ECG心电图
实现效果,动态效果懒得录视频了
安装
1.安装ScottPlot.Avalonia NuGet包
注意:
如果开发环境是macos、linux,需要按照官网步骤配置环境
此处是官网配置链接
代码部分
view部分 注意安装包之后引入
xmlns:ScottPlot="clr-namespace:ScottPlot.Avalonia;assembly=ScottPlot.Avalonia"
<Window xmlns="https://github.com/avaloniaui"xmlns:x="http://schemas.microsoft.com/winfx/2006/xaml"xmlns:d="http://schemas.microsoft.com/expression/blend/2008"xmlns:mc="http://schemas.openxmlformats.org/markup-compatibility/2006"mc:Ignorable="d" d:DesignWidth="1920" d:DesignHeight="600"xmlns:vm="using:AvaloniaMedical.ViewModels"x:Class="AvaloniaMedical.Views.xx"xmlns:ScottPlot="clr-namespace:ScottPlot.Avalonia;assembly=ScottPlot.Avalonia"x:DataType="vm:xx"xmlns:views="clr-namespace:AvaloniaMedical.Views"xmlns:i="clr-namespace:Avalonia.Xaml.Interactivity;assembly=Avalonia.Xaml.Interactivity"xmlns:controls1="clr-namespace:Material.Styles.Controls;assembly=Material.Styles"Background="#31363A">此处只显示三导心电<ScottPlot:AvaPlot Height="200"  Name="AvaPlotName1" Grid.Row="1" Grid.Column="0" ></ScottPlot:AvaPlot><ScottPlot:AvaPlot Height="200"  Name="AvaPlotName2" Grid.Row="2" Grid.Column="0" ></ScottPlot:AvaPlot><ScottPlot:AvaPlot Height="200" Name="AvaPlotName3" Grid.Row="3" Grid.Column="0" ></ScottPlot:AvaPlot>
</Window>
using System;
using System.Collections.ObjectModel;
using System.ComponentModel;
using System.Diagnostics;
using System.Drawing;
using System.Threading;
using Avalonia;
using Avalonia.Controls;
using Avalonia.Data;
using Avalonia.Markup.Xaml;
using Avalonia.Threading;
using AvaloniaMedical.ViewModels;
using Npoi.Mapper;
using ScottPlot;
using ScottPlot.Avalonia;
using ScottPlot.Plottable;namespace AvaloniaMedical.Views;public partial class xx : Window
{private readonly double[] liveData = new double[4000];private readonly double[] liveData2 = new double[4000];private readonly double[] liveData3 = new double[4000];private readonly Timer _updateDataTimer;private readonly DispatcherTimer _renderTimer;private readonly VLine vline;private readonly VLine vline2;private readonly VLine vline3;int nextValueIndex = -1;int nextValueIndex2 = -1;int nextValueIndex3= -1;AvaPlot AvaPlot1;AvaPlot AvaPlot2;AvaPlot AvaPlot3;public xx(){InitializeComponent();#if DEBUGthis.AttachDevTools();
#endifAvaPlot1 = this.Find<AvaPlot>("AvaPlotName1");AvaPlot2 = this.Find<AvaPlot>("AvaPlotName2");AvaPlot3 = this.Find<AvaPlot>("AvaPlotName3");AvaPlot1.Plot.AddSignal(liveData, 1, color: Color.LightGreen);AvaPlot1.Plot.AxisAutoX(margin: 0);AvaPlot1.Plot.SetAxisLimits(yMin: 2, yMax:7);AvaPlot2.Plot.AddSignal(liveData2, 1, color: Color.LightGreen);AvaPlot2.Plot.AxisAutoX(margin: 0);AvaPlot2.Plot.SetAxisLimits(yMin: 2, yMax: 7);AvaPlot3.Plot.AddSignal(liveData3, 1, color: Color.LightGreen);AvaPlot3.Plot.AxisAutoX(margin: 0);AvaPlot3.Plot.SetAxisLimits(yMin: 2, yMax: 7);vline = AvaPlot1.Plot.AddVerticalLine(0, Color.LightGreen, 1);vline2 = AvaPlot2.Plot.AddVerticalLine(0, Color.LightGreen, 1);vline3 = AvaPlot3.Plot.AddVerticalLine(0, Color.LightGreen, 1);///Binding binding = new Binding();binding.Source = AvaPlot1;binding.Path = new ropertyPath();AvaPlot1.SetValue(TagProperty, 0);AvaPlot1.Plot.Style(Style.Gray1); AvaPlot2.Plot.Style(Style.Gray1); AvaPlot3.Plot.Style(Style.Gray1); customize styling//AvaPlot1.Plot.Title("Electrocardiogram Strip Chart");AvaPlot1.Plot.Grid(true);AvaPlot2.Plot.Grid(true);AvaPlot3.Plot.Grid(true);// create a traditional timer to update the data//_updateDataTimer = new Timer(_ => UpdateData(), null, 0, 1); create a separate timer to update the GUI_renderTimer = new DispatcherTimer{Interval = TimeSpan.FromMilliseconds(1)};_renderTimer.Tick += Render;_renderTimer.Start();Closed += (sender, args) =>{_updateDataTimer?.Dispose();_renderTimer?.Stop();};}public void UpdateChart(double dto){UpdateData(dto);}public void UpdateChart2(double dto){UpdateData2(dto);}public void UpdateChart3(double dto){UpdateData3(dto);}void UpdateData(double dto){// "scroll" the whole chart to the left// Array.Copy(liveData, 1, liveData, 0, liveData.Length - 1);// place the newest data point at the enddouble nextValue = dto;nextValueIndex = (nextValueIndex < liveData.Length - 1) ? nextValueIndex + 1 : 0;liveData[nextValueIndex] = nextValue;vline.IsVisible = true;vline.X = nextValueIndex;}void UpdateData2(double dto){// "scroll" the whole chart to the left// Array.Copy(liveData, 1, liveData, 0, liveData.Length - 1);// place the newest data point at the enddouble nextValue = dto;nextValueIndex2 = (nextValueIndex2 < liveData2.Length - 1) ? nextValueIndex2 + 1 : 0;liveData2[nextValueIndex2] = nextValue;vline2.IsVisible = true;vline2.X = nextValueIndex2;}void UpdateData3(double dto){// "scroll" the whole chart to the left// Array.Copy(liveData, 1, liveData, 0, liveData.Length - 1);// place the newest data point at the enddouble nextValue = dto;nextValueIndex3 = (nextValueIndex3 < liveData3.Length - 1) ? nextValueIndex3 + 1 : 0;liveData3[nextValueIndex3] = nextValue;vline3.IsVisible = true;vline3.X = nextValueIndex3;}void Render(object sender, EventArgs e){AvaPlot1.Refresh();AvaPlot2.Refresh();AvaPlot3.Refresh();}private void InitializeComponent(){AvaloniaXamlLoader.Load(this);}protected override void OnClosing(CancelEventArgs e){this.Hide();base.OnClosing(e);}}