目录
1.算法流程简介
2.算法核心代码
3.算法效果展示
1.算法流程简介
"""
TOPSIS(综合评价方法):主要是根据根据各测评对象与理想目标的接近程度进行排序.
然后在现有研究对象中进行相对优劣评价。
其基本原理就是求解计算各评价对象与最优解和最劣解的距离来进行排序.
如果过评价对象最靠近最优解同时又最远离最劣解,则为最优;否则不是最优。
这样的评价方法需要多次统一标准,所以要求我们掌握正向化的求解方法.
"""
2.算法核心代码
"""
Question1:现给予你20组有关水质特征的值,分别是含氧量  PH值  细菌总数  植物性营养物量四个参数,请你根据
Topsis方法将20条河流的水质进行对应的评价!
"""
#Topsis综合评价法
import numpy as np
import matplotlib.pyplot as plt
"""
输入评价数据
20个评价数据包含了含氧量 PH值 细菌总数 植物性营养物量四个参数"""
data=np.array([[4.69, 6.59, 51, 11.94],[2.03, 7.86, 19, 6.46],[9.11, 6.31, 46, 8.91],[8.61, 7.05, 46, 26.43],[7.13, 6.5, 50, 23.57],[2.39, 6.77, 38, 24.62],[7.69, 6.79, 38, 6.01],[9.3, 6.81, 27, 31.57],[5.45, 7.62, 5, 18.46],[6.19, 7.27, 17, 7.51],[7.93, 7.53, 9, 6.52],[4.4, 7.28, 17, 25.3],[7.46, 8.24, 23, 14.42],[2.01, 5.55, 47, 26.31],[2.04, 6.4, 23, 17.91],[7.73, 6.14, 52, 15.72],[6.35, 7.58, 25, 29.46],[8.29, 8.41, 39, 12.02],[3.54, 7.27, 54, 3.16],[7.44, 6.26, 8, 28.41]])
#区分指标的性质并且进行正向化处理
"""
一般来说,数据指标分为4种形式:
1.极大值型:越大越好,比如利润
2.极小值型:越小越好,比如死亡数
3.中间值型:越趋近于某一个数越好,比如PH
4.区间值型:越趋近于某一个区间越好
##常见的转化公式
极大值型:x-x_min
极小值型:x_max-x
区间值型:在区间中为1,大于区间:1-(x-r)/M 小于区间:1-(l-x)/M
"""
# 定义position接收需要进行正向化处理的列
position = np.array([1, 2, 3])
# 定义处理类型:1 - > 极小型 2 - > 中间型 3 - > 区间型
Type = np.array([2, 1, 3])
# 定义正向化函数
def positivization(x:np.array,pos:int,type:int)->np.array:if type==1:#极小型值x=x.max()-xelif type==2:best=7#此处可以修改M=np.max(np.abs(x-best))x=1-np.abs(x-best)/Melse:#区间值型:在区间中为1,大于区间:1-(x-r)/M 小于区间:1-(l-x)/Ml=10#区间左端r=20#区间右端M0=max(l-x.min(),x.max()-r)x=np.where(x<l,1-(l-x)/M0,x)x=np.where(x>r,1-(x-r)/M0,x)x=np.where(x>l,1,x)return x
for i in range(len(position)):data[:, position[i]] = positivization(data[:, position[i]], position[i], Type[i])
#矩阵标准化求解
"""
已经正向化后,我们就能够进行矩阵的标准化求解了
把标准化的矩阵记作Z,对于每一个z(i,j)都有:
z(i,j)=x(i,j)/sqrt(sum(x(i,j)*x(i,j)))
"""
Z = data / np.sum(data * data, axis=0) ** 0.5
"""
计算得分并且归一化
"""
max_grd=np.max(Z)
min_grd=np.min(Z)
max_dist = np.sum((max_grd - Z) * (max_grd - Z), axis=1) ** 0.5
min_dist = np.sum((min_grd - Z) * (min_grd - Z), axis=1) ** 0.5
#最终得分
final_score = (min_dist / (max_dist + min_dist))
#归一化处理并且保留精度
final_score /= np.sum(final_score)
final_score = np.around(final_score, decimals=3)
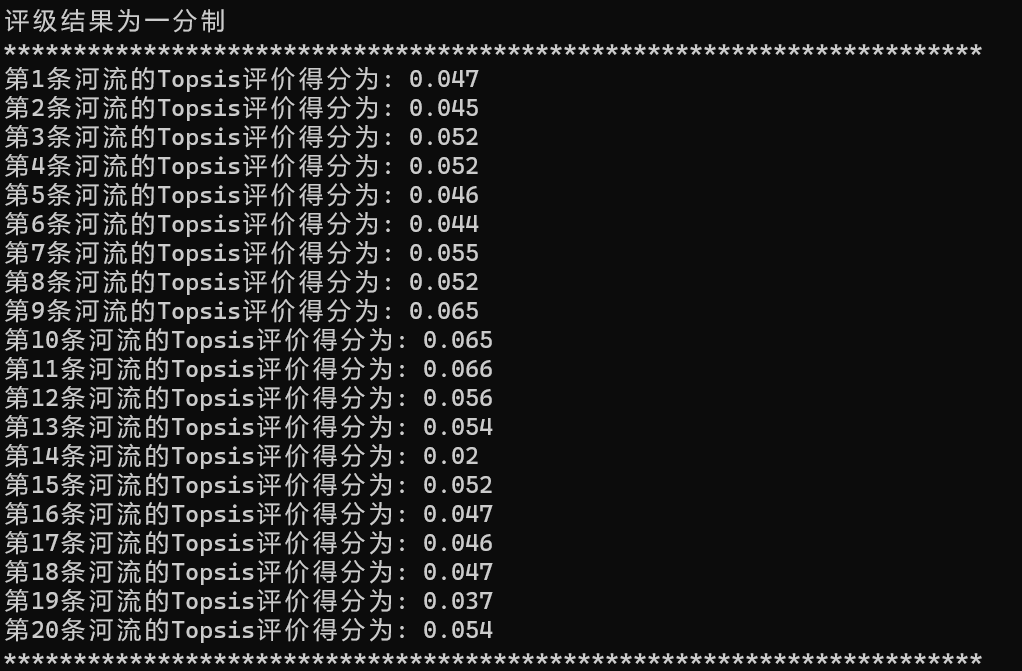
print("评级结果为一分制")
print("**********************************************************************")
for i in range(len(final_score)):print("第{}条河流的Topsis评价得分为:".format(i+1),final_score[i])
print("**********************************************************************")
#绘制可视化图片
number=20#根据数据的个数进行修改即可
x = np.arange(number)
colors=['red','black','peru','orchid','deepskyblue', 'orange', 'green', 'pink', 'rosybrown', 'gold', 'lightsteelblue', 'teal']
x_label = [chr(i) for i in range(65,65+number)]#表示成A,B,C,......Z
#绘制可视化图
plt.figure(figsize=(12, 8))
plt.xticks(x, x_label)
#绘制条形统计图
plt.bar(x, final_score,color=colors)
#设置网格刻度
plt.grid(True,linestyle=':',color='b',alpha=0.6)
plt.title("TOPSIS's Score Figure")
#在柱状图上绘制数据
for xx, yy in zip(x, final_score):plt.text(xx, yy + 0.001, str(yy), ha='center')
plt.savefig('C:\\Users\\Zeng Zhong Yan\\Desktop\\TOPSIS Score Figure.png', dpi=500, bbox_inches='tight')
plt.show()
3.算法效果展示

