文章目录
- Colorbar的作用
- Colorbar的操作
- 截取cmap
- 拼接cmap
- 双刻度列colorbar
- 引用
Colorbar的作用
Colorbar(颜色条)在绘图中的作用非常重要,它主要用于以下几个方面:
- 表示数据范围: Colorbar可以显示图中的颜色映射范围,帮助理解图中不同颜色所代表的数据范围。例如,在热力图中,不同的颜色可能表示不同的温度值,颜色条可以告诉哪种颜色对应哪个温度值。
- 数据解释: Colorbar可以提供关于颜色和数据之间的映射关系的信息。可以通过查看颜色条来了解不同颜色在图中代表的数据值。
- 数据分布: 颜色条可以帮助理解数据的分布情况。例如,颜色条中的颜色分布越均匀,表示数据在整个范围内都有分布。
Colorbar的操作
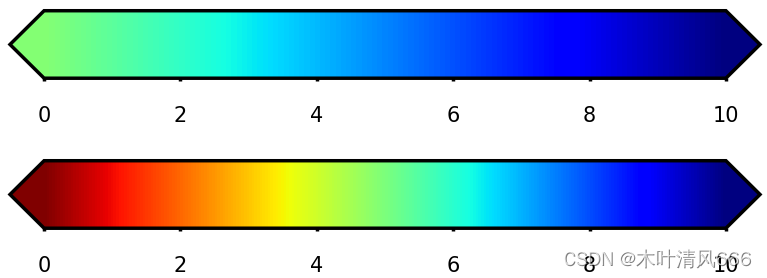
截取cmap
import numpy as np
import matplotlib as mpl
import matplotlib.pyplot as plt
from matplotlib.colors import ListedColormap
cmap=mpl.cm.jet_r          #获取色条    # print(cmap._segmentdata)
newcolors=cmap(np.linspace(0,1,256))  #分片操作
# print(newcolors)
newcmap=ListedColormap(newcolors[125:]) #切片取舍
# print(newcmap)
fig=plt.figure(figsize=(1.5,0.3),dpi=500)
ax1=fig.add_axes([0,0,1,0.45])
ax2=fig.add_axes([0,1,1,0.45])
norm =mpl.colors.Normalize(vmin=0, vmax=10)
fc1=fig.colorbar(mpl.cm.ScalarMappable(norm=norm,cmap='jet_r'),              cax=ax1,                                                      orientation='horizontal',                                                         extend='both')
fc2=fig.colorbar(mpl.cm.ScalarMappable(norm=norm,cmap=newcmap),                                            cax=ax2,                                                      orientation='horizontal',                                         extend='both')
for i in [fc1,fc2]:                                                           i.ax.tick_params(labelsize=3,width=0.5,length=0.5)                           i.outline.set_linewidth(0.5)
拼接cmap
import numpy as np
import matplotlib as mpl
import matplotlib.pyplot as plt
from matplotlib.colors import ListedColormap
import cmaps
plt.rcParams['font.sans-serif']=['FangSong']
plt.rcParams['font.size']=18
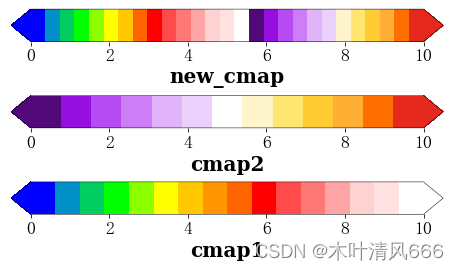
cmap1=cmaps.spread_15lev_r
cmap2=cmaps.sunshine_diff_12lev
list_cmap1=cmap1(np.linspace(0,1,15))
list_cmap2=cmap2(np.linspace(0,1,12))
new_color_list=np.vstack((list_cmap1,list_cmap2))
new_cmap=ListedColormap(new_color_list,name='new_cmap ')
fig=plt.figure(figsize=(6,3))
ax1=fig.add_axes([0,0,1,0.15])
ax2=fig.add_axes([0,0.3,1,0.15])
ax3=fig.add_axes([0,0.6,1,0.15])
norm =mpl.colors.Normalize(vmin=0, vmax=10)
fc1=fig.colorbar(mpl.cm.ScalarMappable(norm=norm,                            cmap=cmap1),cax=ax1,                                     orientation='horizontal',extend='both')
fc2=fig.colorbar(mpl.cm.ScalarMappable(norm=norm,                      cmap=cmap2),cax=ax2,                                      orientation='horizontal',extend='both')
fc3=fig.colorbar(mpl.cm.ScalarMappable(norm=norm,                         cmap=new_cmap),cax=ax3,                                orientation='horizontal',extend='both')
for i in [fc1,fc2,fc3]:                                                           # i.ax.tick_params(labelsize=20,width=0.01,length=1)                           i.outline.set_linewidth(0.5)
双刻度列colorbar
import numpy as np
import matplotlib as mpl
import matplotlib.pyplot as plt
import matplotlib.colors as mcolors
plt.rcParams['font.sans-serif']=['Times New roman']
##第一步,制作雨量色条
fig=plt.figure(figsize=(1.5,0.2),dpi=500)
ax=fig.add_axes([0,0,1,0.5])
colorlevel=[0.1,10.0,25.0,50.0,100.0,250.0,500.0]                        #雨量等级
colordict=['#A6F28F','#3DBA3D','#61BBFF','#0000FF','#FA00FA','#800040']  #颜色列表
cmap=mcolors.ListedColormap(colordict)                                   #产生颜色映射
norm=mcolors.BoundaryNorm(colorlevel,cmap.N)                             #生成索引
fc=fig.colorbar(mpl.cm.ScalarMappable(norm=norm,cmap=cmap),                cax=ax,orientation='horizontal',extend='both')
fc.ax.tick_params(which='major',labelsize=3,direction='out',width=0.5,length=1)
fc.outline.set_linewidth(0.3)        ##第二步,生成双刻度列##
ax2=fc.ax                                                #召唤出fc的ax属性并省称为ax2,这时ax2即视为一个子图
ax2.xaxis.set_ticks_position('top')                      #将数值刻度移动到上边
ax2.tick_params(labelsize=3,top=True,width=0.5,length=1) #修改刻度式,并使上有刻度ax3=ax2.secondary_xaxis('bottom')
ax3.tick_params(labelsize=3,width=0.5,length=1)
ax3.spines['bottom'].set_bounds(0.1,500)                  #截去多余的部分
ax3.set_xticks([40,120,210,290,380,460])
ax3.set_xticklabels(['小雨','中雨','大雨','暴雨','大暴雨','特大暴雨'], fontname="youyuan", fontweight='bold')
ax3.spines['bottom'].set_linewidth(0.3)                    #修改底部到框线粗细

引用
参考资料:https://mp.weixin.qq.com/s/KeRRApCk3qhbRsOvD_7jng
