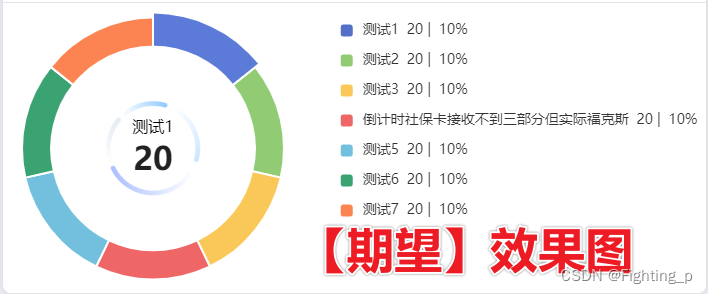
需求
问题 - 暂时无法解决(如果图标居中不存在该问题)
由于此处饼图位置不处于当前 echarts 图表容器的中心位置,而是偏左一点,我们需要设置:
- 中心图片所在靠左位置【见 - 主要代码1】官方手册 https://echarts.apache.org/zh/option.html#graphic.elements-image.left
- 饼图所在靠左位置【见 - 主要代码2】官方手册 https://echarts.apache.org/zh/option.html#series-pie.radius
【主要代码1】【主要代码2】需要同时修改 距左侧距离:
- 写
固定值的话浏览器窗口过大时饼图过大,会导致饼图左侧部分区域超出;
- 写
百分比的话中心图片的距左百分比和饼图距左百分比对应不上(中心图片百分比参照容器计算有问题),会导致错位。(也会超出,但此处错位是主要问题)
代码
<template><div id="AnomalyStatisticsEcharts" />
</template><script>
export default {name: 'AnomalyStatisticsEcharts',components: {},props: {theme: {type: String,required: true},dataList: {type: Array,// required: truedefault: () => {return [{ value: 20, name: '测试1', pre: '10' },{ value: 20, name: '测试2', pre: '10' },{ value: 20, name: '测试3', pre: '10' },{ value: 20, name: '倒计时社保卡接收不到三部分但实际福克斯', pre: '10' },{ value: 20, name: '测试5', pre: '10' },{ value: 20, name: '测试6', pre: '10' },{ value: 20, name: '测试7', pre: '10' }]}}},data() {return {Echarts: null}},computed: {options() {return {graphic: {/*** 【主要代码】图形中心展示图片*/elements: [{type: 'image',style: {image: require('@/assets/images/home/home_pie_center.png'), // 图片地址width: 120,height: 120},// left: '18.5%',left: '60', // 【主要代码1】top: 'center'}]},title: {show: !this.dataList.length,text: '暂无数据',left: 'center',top: 'center',textStyle: {color: this.theme === 'light-theme' ? '#000' : '#fff'}},tooltip: {trigger: 'item'},grid: {left: 0},legend: {type: 'scroll',top: '5%',right: 0,orient: 'vertical',itemGap: 14,itemWidth: 14,formatter: (name) => {for (let i = 0; i < this.dataList.length; i++) {if (this.dataList[i].name === name) {const count = this.dataList[i].valueconst percent = `${this.dataList[i].pre}%`return `{name| ${name}} {count| ${count} |} {percent| ${percent}} `}}},textStyle: {// rich放在textStyle里面rich: {name: {fontSize: 14// width: 100},count: {fontSize: 14},percent: {fontSize: 14}}}},series: [{name: '异常点统计分析',type: 'pie',radius: ['70%', '90%'],// center: ['25%', '50%'],center: ['120', '50%'], // 【主要代码2】avoidLabelOverlap: false,itemStyle: {// borderRadius: 10,borderWidth: 2,borderColor: '#fff'},label: {show: false,position: 'center'},emphasis: {label: {show: true,fontSize: 20,fontWeight: 'bold',renderMode: 'html',formatter: ['{b|{b}}', '{c|{c}}'].join('\n'),// formatter: (params) => {//   console.log('params----', params)//   return `<div>aaaaa</div>`// },rich: {b: {color: '#000',fontSize: 16,padding: [0, 0, 10, 0]},c: {fontSize: 32,color: '#222',fontWeight: 'bold'}}}},labelLine: {show: false},data: this.dataList || []}]}}},watch: {theme() {this.init()},dataList() {this.init()}},created() {},mounted() {window.addEventListener('resize', () => {if (document.getElementById('AnomalyStatisticsEcharts')) {this.Echarts = this.$echarts.init(document.getElementById('AnomalyStatisticsEcharts'))this.Echarts.resize()}})this.init()},methods: {init() {if (this.Echarts) {this.Echarts.dispose()}this.Echarts = this.$echarts.init(document.getElementById('AnomalyStatisticsEcharts'))this.Echarts.setOption(this.options)// 高亮let currentIndex = 0this.Echarts.dispatchAction({type: 'highlight',seriesIndex: 0,dataIndex: currentIndex})this.Echarts.on('mouseover', (params) => {// 取消之前高亮this.Echarts.dispatchAction({type: 'downplay',seriesIndex: 0,dataIndex: currentIndex})// 获取当前高亮索引currentIndex = params.dataIndex// 设置当前高亮this.Echarts.dispatchAction({type: 'highlight',seriesIndex: 0,dataIndex: params.dataIndex})})}}
}
</script><style lang='scss' scoped>
#AnomalyStatisticsEcharts {width: 100%;height: 100%;
}
</style>