效果
实现
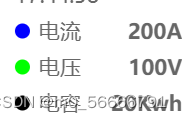
在每个series中添加不同的
tooltip: {
valueFormatter: function (value) {
return value.toFixed(0) + ‘A’;
}
},
代码如下
var option = {// grid: {//           left: '-13vw',//左边距72px//           right: '32%',//           bottom: '64%',//           top: '16%',//           containLabel: false//         },backgroundColor: "white",title: [{text: '.',x: 15,y: '20',textBaseline: 'middle',textStyle: {fontSize: 20,fontWeight: '500',color:"transparent",}}, {text: '.',x: "11",y: '5',textBaseline: 'middle',textStyle: {color:'#cccccc',fontSize: 16,fontWeight: '100'}}, {text: '最新',x2: 235,y: '10',textBaseline: 'middle',textStyle: {fontSize: 12,fontWeight: '100'}}, {text: '最小',x2: 165,y: '10',textBaseline: 'middle',textStyle: {fontSize: 12,fontWeight: '100'}}, {text: '最大',x2: 95,y: '10',textBaseline: 'middle',textStyle: {fontSize: 12,fontWeight: '100'}}, {text: '平均',x2: 20,y: '10',textBaseline: 'middle',textStyle: {fontSize: 12,fontWeight: '100'}}, {text: in_new,x2: 235,y: '26',textBaseline: 'middle',textStyle: {fontSize: 12,fontWeight: '100'}}, {text: in_min,x2: 165,y: '26',textBaseline: 'middle',textStyle: {fontSize: 12,fontWeight: '100'}}, {text: in_max,x2: 95,y: '25',textBaseline: 'middle',textStyle: {fontSize: 12,fontWeight: '100'}}, {text: in_avg,x2: 20,y: '25',textBaseline: 'middle',textStyle: {fontSize: 12,fontWeight: '100'}}, {text: out_new,x2: 235,y: '40',textBaseline: 'middle',textStyle: {fontSize: 12,fontWeight: '100'}}, {text: out_min,x2: 165,y: '40',textBaseline: 'middle',textStyle: {fontSize: 12,fontWeight: '100'}}, {text: out_max,x2: 95,y: '40',textBaseline: 'middle',textStyle: {fontSize: 12,fontWeight: '100'}}, {text: out_avg,x2: 20,y: '40',textBaseline: 'middle',textStyle: {fontSize: 12,fontWeight: '100'}}],legend: [{x2: 300,y: 20,icon: 'rect',itemGap: 3,itemWidth: 11,itemHeight: 11,orient: 'vertical',data: ['接收', '发送']}],grid: [{left: 20,right: 20,top: 80,bottom: 20,containLabel: true}],dataZoom: {type: 'inside',filterMode: 'filter',orient: 'horizontal',xAxisIndex: [0],},tooltip: {trigger: 'axis',axisPointer: {lineStyle: {color: '#57617B'}},// formatter: function (params) {//         //文字加单位//         var relVal = params[0].name;//         for (var i = 0, l = params.length; i < l; i++) {//           relVal +=//             "<br/>" +//             params[i].marker +//             params[i].seriesName +//             " : " +//             params[i].value +//             "%";//         }//         return relVal;//       },},xAxis: [{type: 'category',boundaryGap: false,axisLine: {lineStyle: {color: '#57617B'}},data: date}],yAxis: {type: 'value',axisTick: {show: false},axisLine: {lineStyle: {color: '#57617B'}},axisLabel: {formatter: '{value}',textStyle: {fontSize: 12}},splitLine: {lineStyle: {color: '#cccccc'}},},series: [{name: '电流',type: 'line',showSymbol: false,tooltip: {valueFormatter: function (value) {return value.toFixed(0) + 'A';}},lineStyle: {normal: {width: 0}},itemStyle: {normal: {color: 'rgba(0,0,255)'}},areaStyle: {normal: {color: new echarts.graphic.LinearGradient(0, 0, 0, 1, [{offset: 0,color: 'rgba(0,0,255, 1)'}, {offset: 0.8,color: 'rgba(0,0,255, 0.5)'}])},},data: cur}, {name: '电压',tooltip: {valueFormatter: function (value) {return value.toFixed(0) + 'V';}},type: 'line',showSymbol: false,lineStyle: {normal: {width: 0}},itemStyle: {normal: {color: 'rgba(0,255,0)'}},areaStyle: {normal: {color: new echarts.graphic.LinearGradient(0, 0, 0, 1, [{offset: 0,color: 'rgba(0,255,0,1)'}, {offset: 0.8,color: 'rgba(0,255,0, 0.5)'}])},},data: vol},{name: '电容',type: 'line',tooltip: {valueFormatter: function (value) {return value.toFixed(0) + 'Kwh';}},showSymbol: true,lineStyle: {normal: {width: 2}},itemStyle: {normal: {color: 'black'}},data: cap},
]
};